Stochastic Geometry Approach
.
White Rose Research Online URL for this paper:
http://eprints.whiterose.ac.uk/96391/
Version: Accepted Version
Article:
Hernandez Aquino, R, Zaidi, SAR, McLernon, D et al. (2 more authors) (2015) Tilt Angle
Optimization in Two-Tier Cellular Networks - A Stochastic Geometry Approach. IEEE
Transactions on Communications, 63 (12). pp. 5162-5177. ISSN 0090-6778
https://doi.org/10.1109/TCOMM.2015.2485981
(c) 2015, IEEE. Personal use of this material is permitted. Permission from IEEE must be
obtained for all other uses, in any current or future media, including reprinting/republishing
this material for advertising or promotional purposes, creating new collective works, for
resale or redistribution to servers or lists, or reuse of any copyrighted component of this
work in other works.
[email protected] https://eprints.whiterose.ac.uk/
Reuse
Unless indicated otherwise, fulltext items are protected by copyright with all rights reserved. The copyright exception in section 29 of the Copyright, Designs and Patents Act 1988 allows the making of a single copy solely for the purpose of non-commercial research or private study within the limits of fair dealing. The publisher or other rights-holder may allow further reproduction and re-use of this version - refer to the White Rose Research Online record for this item. Where records identify the publisher as the copyright holder, users can verify any specific terms of use on the publisher’s website.
Takedown
If you consider content in White Rose Research Online to be in breach of UK law, please notify us by
Tilt Angle Optimization in Two-tier Cellular
Networks - A Stochastic Geometry approach
Raul Hernandez-Aquino, Syed Ali Raza Zaidi,
Student Member, IEEE,
Des McLernon,
Member, IEEE,
Mounir Ghogho,
Senior Member, IEEE
and Ali Imran,
Member, IEEE
Abstract—In this work, we address the antenna tilt
optimiza-tion problem for a two tier cellular network consisting of macro-cells and femtomacro-cells, where both tiers share the same spectrum and their positions are modelled via two independent Poisson Point Processes (PPPs). First, we derive the coverage probability for a traditional cellular network consisting only of macrocells and obtain the optimum tilt angle that maximises the overall energy efficiency (EE). Gains of up to 400% in EE were found for a scenario (approximately) equivalent to a hexagonal cell deployment with cell radius of200m when the optimum tilt was selected. We then proceed to model the Heterogeneous Network (HetNet) scenario where femtocells are also deployed in the network’s area. We observe that the macro users performance is highly sensitive to the interference emanating from the femtocell tier. In order to circumvent this issue, interference coordination by employing a guard zone for the macrocell user is proposed. Subsequently, we formulate a joint optimization problem where we derive both, the radius of a guard zone protecting the macro user and the tilt angle that maximize the EE of the network.
Index Terms—Energy efficiency, Rayleigh fading, antenna tilt, Poisson point process.
I. INTRODUCTION
The energy efficiency (EE) of telecommunication systems is a major aspect that needs to be considered for future network deployments, as it has both economical and ecological repercussions. Therefore, new techniques and algorithms are being deployed in order to address these aspects. In this regard, the deployment of heterogeneous networks (HetNets) has the potential benefit of increasing the overall system coverage and throughput by placing tiers of several smaller cells. These smaller cells can provide service to specific areas with the advantage of having a smaller path loss given that the transmitting base stations are placed closer to the users [1]. However, a large scale and unplanned deployment of these smaller cells can incur a significant power penalty if the EE is not considered in the design of the HetNet.
On the other hand, in order to cope to the ever changing demands and configurations of a network, Self Optimizing
This work was supported by CONACYT, Mexico; Secretaria de Educacion Publica; the Mexican government; and U.S. Army Research Lab Grant W911NF-13-1-0216.
R. Hernandez-Aquino, S.A.R. Zaidi and D. McLernon are with the School of Electronic and Electrical Engineering, University of Leeds, Leeds, United Kingdom. email:{elrha, s.a.zaidi, d.c.mclernon}@leeds.ac.uk
M. Ghogho is with the School of Electronic and Electrical Engineering, University of Leeds, Leeds, United Kingdom and also with the Department of Electronics, Logistics, Informatics and Telecommunications, International University of Rabat, Technopolis Morocco. email:{m.ghogho}@leeds.ac.uk
Ali Imran is with University of Oklahoma, USA. email: [email protected]
Networks (SONs) are being studied for future network deploy-ments [2]. In principle, a SON pursues the goal of adapting to the changes in the conditions of the network to provide good performance in a fast and flexible manner. The response to the environmental changes in a SON should be made in an acute manner (agility), in an acceptable period of time (stability), and regardless of the increase in the size or scale of the system (scalability). Among the solutions considered in the context of SONs, the antenna tilt angle has been proposed as a way of self optimizing a network. The antenna tilt, defined as the angle of the main beam of the antenna below the horizontal plane [3], has the potential to achieve gains in the performance of the network by focusing most of the power radiated into a desired location. Additionally, with the use of a remote electrical tilt (RET), a network can reconfigure itself. That way, the performance of the network can be greatly enhanced without the need to physically change the position of the antennas in the base stations (BSs). Moreover, the antenna tilting design has been recognized by industry as a powerful technique for future SONs due to its impact on both the interference, and the coverage as it is pointed out by JDS Uniphase Corporation in its white paper [4]. Furthermore, there have been extensive simulations in the past that have examined which antenna tilt angle provides the best gains for the network in terms of coverage and/or data rates. However, while considering a SON scenario, an open issue still remains as fast convergent algorithms are needed in order to cope with the rapid changes in network parameters. Moreover, it still remains unclear how the tilt angle should be adjusted in a HetNet to cope with the existence of other tiers of interferers in the network, while still achieving an acceptable performance.
(FAPs) as independent Poisson Point Processes (PPPs). The use of PPPs to characterize the macrocell tier provides a lower bound on the actual performance of this tier with a tractable analytical framework [10]–[12]. This is in contrast with the typical hexagonal grid model, which provides an upper bound at the cost of tedious and time consuming simulations and/or numerical integrations. The proposed methodology takes into account the vertical pattern, while making use of the thinning property of a PPP to characterize the behaviour on the hori-zontal plane. Thus, the developed model provides a realistic, yet accurate 3-D representation of a system, considering the antenna pattern. With the proposed PPPs we can provide an analytical framework from which the overall performance of the network can be evaluated without the need to run time and resource consuming simulations. We first address the issue of tilt optimization for a traditional cellular network (only macrocells deployed). We show the existence of an optimum tilt angle that maximizes both the coverage probability and the EE. Then, we analyse the case of a two-tier HetNet where both macro- and femtocell tiers share the same spectrum. It turns out that the interference created by the femtocells has a great effect on the macrocell users’ performance. In order to cope with this issue, we propose an interference coordination scheme in which a guard zone protecting the macrocell user is utilized. Accordingly, we formulate an optimization problem over a guard zone radius (protecting the macrocell users from femto interference) and the tilt angle that would maximize the EE of the network with constraints on the minimum coverage probability of each tier.
A. Related Work
There have been a number of papers considering the issue of the antenna tilt optimization for cellular networks. However, in order to characterize the performance of the network, most of them make use of time consuming simulations and have only studied the case of a traditional cellular network consisting of macrocells only. In [3], a comparison in terms of coverage is carried out between a system with mechanical tilt, electrical tilt and a combination of both. The network is modelled with a hexagonal grid and through simulations, the optimum tilt angle is found for scenarios with different inter-site distance. In [13], an optimization problem is proposed for a network with the presence of hotspots where a high number of users is identified. A hexagonal grid with cells having 3 sectors is assumed. The complexity of the original problem consisting of obtaining the tilt angle that maximizes the throughput of all users is first reduced by considering an optimization of the tilt over a center of gravity where a hot spot is located. Then, the system wide problem is decomposed into a local sub-problem which considers the triplet of adjacent (most interfering) sectors in order to find a decentralized solution. The same approach is followed in [14] but in the context of a network with macrocells and relays which are placed at random positions. At most one relay is placed in each base station sector to provide service where there is a coverage hole or where the concentration of users around that location forms a hotspot.
Now, in the case of HetNets, there are only a few works which consider the effect of the antenna tilt in the presence of other tiers of interferers. In [15] the issue of antenna tilt is addressed for both, a traditional network consisting of macro base stations and a HetNet considering the inclusion of femtocells to provide service to hotspots. The parameters used follow LTE specifications and the results are found via simulations. The emphasis of the work was to obtain a better performance in EE and throughput fairness (ratio of the cell edge users throughput to the cell mean user throughput). A reinforced machine learning algorithm is proposed, in which each base station individually can change its antenna tilt angle and the learning comes from observing the effects of the actions taken. In [16], direct and indirect (learning theory and game theory) biomimetrics approaches are studied in a scenario where macrocells are sectorized and each sector has at most one outdoor femtocell which acts as a fixed relay. In the direct approach, the original problem of optimizing the tilt angles (so that the aggregate throughput in all femtocells achieves a maximum), is decomposed into a local subproblem consisting of finding the optimum angle when a triplet of closest interferers is considered in each case.
errors. Expressions for the expected coverage and data rates are provided for two cell association policies, namely, smallest path loss and the highest received power. The impact of the horizontal antenna pattern and blockages in a dense urban cellular network is presented in [21]. The authors quantized the accuracy of the point process model by comparing it with experimental data from an actual deployment of base stations. Additionally, the authors proposed models of both blockages and antenna pattern which result in a tractable analytical framework. Results showed that the point process is suitable for the modelling of future dense urban networks, when the models for blockages and antenna patterns are accurate.
B. Contributions
In contrast to previous works on antenna tilt optimization, we follow a stochastic geometry approach to model the loca-tion of the base staloca-tions on the network for both, tradiloca-tional cellular macro network and a HetNet consisting of macro-and femtocells. Employing the well established framework of point processes from stochastic geometry, we can obtain tractable expressions. These expressions can be employed to evaluate the overall performance of the network, without the need to run time consuming simulations, effectively providing a theoretical framework from which the performance of a traditional cellular macro network, and a HetNet can be analysed. Additionally, we address the case of an ultra dense user deployment in which the number of femtocells in the area can vary according to the number of users who purchase them, or through sleep mode scheduling, etc. Therefore, the density of femtocells changes according to the users’ needs and it is not a controlled variable, in contrast with scenarios where the tilt is modified in order to serve a particular hotspot. Thus, we can obtain pseudo closed-form expressions with which the scalability of the network can be addressed. It is worthwhile to notice that the results cannot be used in a SON manner, as there is a need to solve the optimization problems formulated. However, these results provide an overall optimum performance in the entire network which could easily be used as a starting point for a SON algorithm or as a tool to adapt to a slowly varying network. The main contributions of this work are as follows.
• Stochastic approach with full antenna pattern: Most of the works where stochastic geometry has been used to model the network do not consider an antenna pattern and resort to an omnidirectional antenna assumption. On the other hand, works where an antenna pattern is considered (with the use of stochastic geometry) have traditionally focused on a 2-D horizontal antenna pattern [17]–[19], [22], and make use of a fixed main and back lobe gain. In this work we attempt to create a bridge between these two approaches by proposing a simplistic (yet realistic) model of the 3-D antenna pattern to go along with a stochastic approach for the positioning of the base stations. This is done by taking as baseline the antenna pattern model recommended by 3GPP [23] with some simplifications in the horizontal plane thanks to stochastic geometry properties. On the vertical plane, we make use of the
exact antenna patter proposed in [23] which provides an exact characterization. Thus, the analysis is simplified while maintaining a realistic model.
• Optimum tilt angle for a traditional network: In contrast to previous works, we focus on the impact of the vertical antenna pattern on the system performance. We derive coverage and EE formulas for the case of a traditional network. In this scenario, the optimum tilt is the one that provides the best performance in terms of the coverage probability and EE. With the resulting expressions, the dependency of the optimum tilt angle on the density of the macrocells is investigated without the need to run time consuming scenario-specific simulations.
• Optimum tilt angle for a two-tier network when both macro- and femtocells share the same resources: In this scenario, as it was obtained from simulations, the interference from the femtocell tier to the macrocell users is really high, and so the performance in the macrocell tier is highly deteriorated. Therefore, we propose the use of a guard zone to protect the macrocell user from the femto-tier interference. Then, we formulate an optimization problem to jointly select the optimum antenna tilt angle and guard zone that provide the highest EE of the network when minimum constraints on Quality of Service (QoS) are considered for each tier.
C. Organisation
The outline of this paper is the following. The proposed system model is described in Section II for both the macro and femto tiers. In Section III, we obtain the coverage probability expressions for both macrocells and femtocells. Section IV describes the EE metric used and the optimization problems proposed. In Section V we present the numerical results of this work. Finally, in Section VI, concluding remarks are presented.
The following notation will be used throughput the paper.
E[X] stands for the expected value of the random variable
X. A random variable X following a complex Gaussian distribution with mean µ and variance σ2 is expressed as
X ∼ CN(µ, σ2). Finally, a Poisson distribution with mean µ
is expressed asPois (µ), and an exponential distribution with mean µis written asExp1µ.
II. SYSTEMMODEL
Consider the downlink of a two-tier cellular OFDMA sys-tem (such as LTE) consisting of macro- and femtocells, where both share the same resources for transmission, which are assigned as a time-frequency pair. Then in each time slot a user can be served on an available subchannel. We model the base stations in both tiers as independent Poisson Point Processes (PPPs) Φi, i ∈ {m, f}, where m and f stand respectively,
for macro- and femtocell. The number of base stations Ni,
follows a Poisson random variable with parameter λi, i.e.
Ni∼Pois(λiS),i∈ {m, f}, whereS is the deployment area
it is assumed that users acquire their FAPs and place them inside their houses, offices, etc., where an increase in coverage and/or data rates is required. The propagation model is a composite of Rayleigh fading (with hj,i ∼ CN(0,1)
repre-senting the channel betweenj-th transmitter andi-th receiver) and path loss l(R) = R−αi, dependent on the distance R
from transmitter to receiver and the path loss exponent αi,
i∈ {m, f}. Each MBS is assumed to be sectorized with Ns
sectors. We assume an ultra dense user scenario where all base stations always have a user to serve and also assume that a symbol sj,k, is sent in each time slot, whereE|sj,k|2= 1.
We also assume that all Ns sectors operate in a different
subchannel. In the macrocell tier, each user connects to the base station which provides the highest long term expected received power. In other words, the users will be assigned to the closest base station. Under this scheme, the network cells form a Voronoi tesselation [10]. This means that the size (and shape) of the macrocells are variable, in contrast with the typical regular grid shapes commonly used, such as the hexagonal grid. In order to provide a realistic scenario for the sizes of the macrocells, we match the mean area of a Voronoi cell with the area of a hexagonal grid cell, e.g., in a PPP with density value of λ= 1.54 x 10⁻⁶ the (mean) Voronoi
cell area corresponds to that of a hexagonal shape cell with radius 500 m, approximately. In the case of femtocells, we assume that each FAP has a user to serve and which is located indoors and uniformly distributed in the femtocell coverage area with radiusRf. The FAP radiation pattern is assumed to
be omnidirectional in accordance with 3GGP specifications [28]. Also according to LTE specifications, for the MBSs we model the antenna vertical radiation pattern G, which expressed in [29] as
GdB(φtilt) =−min 12
φ+φtilt
φ3dB 2
, AdB !
(1)
where φ < 0 is the angle between the base station antenna and the receiver, φtilt > 0 is the tilt angle, φ3dB represents
the 3dB beamwidth with value10, andAdB is the minimum
power which is leaked to the sectors other than the desired one, and which has a typical value of 20 dB. As for the horizontal plane, we make use of the thinning property of a PPP, and so we thin the PPP by a factor equal to the number of sectors, i.e., we consider an omnidirectional pattern in the horizontal plane, but the effective density of interferers is expressed as Nsλ . This assumption is justified given that in the downlink, the radiation pattern of the antennas is symmetric in the horizontal plane, i.e., modifying the pattern of all antennas in the network similarly (as a result of sectorization) does not modify significantly the SIR perceived by the desired user. In addition, as each sector is assumed to operate in a different subchannel, the interference is reduced by a factor ofNs. The
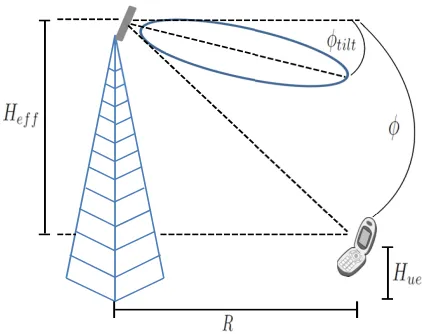
angle between the base station antenna and the desired user’s antennaφcan be expressed as a function of the effective height
Hef f (difference in heights between transmitter and receiver
[image:5.612.327.538.61.228.2]antenna), and the distance R between the transmitting base
Fig. 1: Vertical antenna pattern and tilt angle.
station and a receiver, as
φ=−tan−1
Hef f
R
(2)
whereHef f =Ha−Hue represents the effective height that
results from substracting the user equipment’s heightHuefrom
the base station’s antenna heightHa. Applying this definition
to (1), and converting to linear scale, we obtain
G(R, φtilt) = 10
−min
12
−tan−1Heff
R
+φtilt
φ3dB
2
,AdB
/10 .
(3) The antenna vertical pattern as well as the tilt angle are depicted in Fig. 1. Now, from the definition of (3) we observe that G(R, φtilt) can be divided into 2 or 3 parts (depending
upon the tilt angle), because of the limiting value ofAdB. So,
for small values ofφtilt, there is only a value ofR=rth1 at
which the function value reaches−AdB. However, whenφtilt
is large enough, there are two values ofR (rth1 andrth2) at
which the function reaches its limit. And so, solving for the threshold distancesrth1 andrth2, we obtain
rth1=
Hef f
tanpAdB/12 φ3dB+φtilt
(4)
rth2=
Hef f
tan−pAdB/12 φ3dB+φtilt
. (5)
Note from Eq. (5) that rth2 only takes positive values when
the conditionφtilt≥ p
AdB/12 φ3dB is fulfilled, and so, Eq.
(3) can be expressed as follows
G(R, φtilt) =
A if R < rth1
10
−1.2
−tan−1
Heff R
+φtilt
φ3dB
2
if R≥rth1
R
0
200
400
600
800
1000
G
(
R
,
φ
tilt
)
0
0.2
0.4
0.6
0.8
1
φtilt= 2◦
φtilt= 8◦
[image:6.612.49.290.52.230.2]φtilt= 18◦
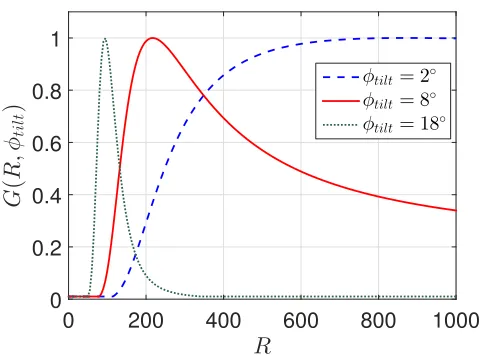
Fig. 2: Vertical antenna pattern (3), as a function of the distanceRfrom base station to the user for antenna tilt values
φtilt= 2◦,8◦ and18◦. Note that depending on the tilt angle,
the shape of the lines change and the function can be further defined by parts as in (6) or (7).
for φtilt< p
AdB/12 φ3dB, and
G(R, φtilt) =
A if R < rth1
10
−1.2
−tan−1
Heff R
+φtilt
φ3dB
2
if rth1≤R < rth2
A if R≥rth2
(7)
for φtilt≥ p
AdB/12φ3dB, whereAis the value of−AdB
in linear scale. The vertical antenna pattern, re-defined in terms of the distance from the MBS to the user, is presented in Fig. 2 for values of antenna tilt φtilt = 2◦,8◦ and18◦. Note that
the maximum angle between the user and the MBS is 0◦, when R → ∞, and so the horizontal axis sets a limit on the values that the function G(R, φtilt) can take. Therefore,
it can be seen that when the antenna tilt is small (φtilt < p
AdB/12 φ3dB) the function is defined by 2 parts as in (6)
because the functionG(R, φtilt)never reaches the valueAas
R increases. However, as the tilt angle becomes large enough (φtilt ≥
p
AdB/12 φ3dB), the function is now defined by 3
parts as in (7) due to the fact that for a given value of R the function does attain value A.
III. COVERAGE
In this section, we obtain the coverage probability expres-sions first for a traditional network (macrocells only) and then for a HetNet consisting of femtocells overlaid with the macrocell tier. We consider an interference limited scenario, and so the effect of noise will be neglected. However, it could be easily included into the calculations in a straightforward manner.
A. Traditional Macrocell Network
For a macrocell traditional network, there is one PPP Φm
used to model the positions of the MBSs. Considering that the
user connects to the closest MBS, the received signal at the user in a given time slot is expressed as
y=
q
Ptx
m l(r0,0)G(r0,0, φtilt) h0,0s0,0
+ X
j∈Φm\{0} q
Ptx
m l(rj,0)G(rj,0, φtilt) hj,0sj,j (8)
wherePtx
m is the MBS transmit power,rj,k,hj,k andsj,kare
respectively, the distance, channel gain and symbol sent from thej-th base station to thek-th user. Note thatr0,0represents
the distance from the closest base station to the desired user. For easiness of representation we drop the subscripts in the desired link. Using Slivnyak’s theorem [30], placing a typical point at the origin does not change the statistics of the PPP, and so we locate the typical user at the origin and obtain its statistics. The signal to interference ratio (SIR) is given by
SIR= |h|
2r−αG(r, φ tilt) P
j∈Φm\{0}
|hj,0|2rj,−0αG(rj,0, φtilt)
=|h|
2r−αG(r, φ tilt)
IΦm
(9)
whereIΦm is the effective interference from the base stations
and|hj,k|2 ∼Exp(1). The coverage probabilityPcis defined
as the probability that the receivedSIR in the entire service area is above a certain threshold β, which depends on the network’s Quality of Service (QoS). From (9), we have
Pc =P(SIR > β)
=Er,IΦm [exp (−s IΦm)]|s=βrαG(r,φtilt)
=Er
EIΦm[exp (−s IΦm)]
=ErLIΦm(s)
(10)
where LIΦm(s) is the Laplace transform of the interference
IΦm, and the expectation with respect tor is obtained using
the fact that the distance to the closest base station for a PPP is Rayleigh distributed [10], i.e. f(r) = 2πλr e−λπr2
. The value of the Laplace transform is expressed as
LIΦm(s) =EΦm,|hj,0|2
"
e−
s P
j∈Φm
|hj,0|2r −α
j,0 G(rj,0,φtilt)
#
=EΦm
Y
j∈Φm
E|hj,0|2
h
e−s|hj,0|2r−j,0αG(rj,0,φtilt)i
.
(11)
Given the fact that|hj,0|2 is independent for allj∈Φm and
|hj,0|2 ∼ Exp(1), by taking the inner expectation in (11), we
obtain
LIΦm(s) =EΦm
Y
j∈Φm
1 +s rj,−0αG(rj,0, φtilt) −1
.
Using the definition of the generating functional of a PPP [30] we obtain
LIΦm(s) = exp
−2πλm
N s
Z ∞
r
y dy
1 +s−1yαmG−1(y, φ
tilt)
= exp
−2πλm
N s
Z ∞
r
y dy
1 + ryαm β GG−−11(y,φtilt(r,φtilt))
.
(13) Substituting (13) into (10), and using the definitions in (6) and (7), the coverage probability can be expressed as in (15), where ζ(a, b) = 2F1 1,1−2a; 2−2a;−b
is the Gauss hypergeometric function, ρ(a, b, c) = Rab y dy
1+(yr)αmc, and we
made use of the following function definition
F(a, φtilt) = 10
−1.2
−tan−1
Heff a
+φtilt
φ3dB
2
. (14)
The derivation of (15) is found in Appendix A.
B. Heterogeneous network
We now consider the case of a HetNet consisting of macro-and femtocells deployed in the coverage area. The femtocells are assumed to operate in closed subscriber group, meaning that they only serve their subscribed users which are assumed to be located indoors. As mentioned in section II, the antennas of the FAPs are all assumed to have an omnidirectional pattern [28]. The FAPs are also assumed to operate in the same frequencies as the macrocells. Therefore, there is inter-tier interference from macro- to femtocells and vice-versa. As previously stated, the femtocell users are uniformly distributed in the coverage area of their serving FAP, which corresponds to a circular area of radiusRf. A wall partition lossLw, defined
as the amount of power which is lost when the signal goes through a wall, is considered also.
Now, as the macrocell users are seriously affected by the femtocell tier interference, we propose the use of a guard zone with radius Rc protecting the macrocell users from the
nearby FAPs interference. In this scenario, a cooperation is assumed between femto and macro tiers, where if femtocells detect a macrocell user within a distanceRc, they will restrain
themselves from transmitting. This assumption is supported by considering that both macro and femtocells are deployed by the same network operator, which can have an estimate on the location of their macrocell users. This information in turn, can be made available to femtocells by means of a macro to femto interface, such as the X2 interface. This model is then equivalent to having a macrocell user with a guard zone preventing any femtocell transmissions within a distance Rc.
The potential use of a guard zone has been reported previously to protect a given user from interference [8], [31]. So, with this model we analyse the effect of the guard zone and the tilt angle when changes in the density of femtocells are perceived. Once again, we place the typical users at the origin and then, the received signals by a macrocell user (ym) and femtocell
user (yf) are given by
ym= q
Ptx
m l(r0,0)G(r0,0, φtilt) h0,0s0,0
+ X
j∈Φm\{0} q
Ptx
m l(rj,0)G(rj,0, φtilt) hj,0sj,j
+ X
k∈Φ′
f\{B(0,Rc)} q
Ptx
f l(dk,0)Lw gk,0xk,k (16)
yf = q
Ptx
f l(d0,0) g0,0x0,0
+ X
j∈Φm q
Ptx
m l(rj,0)G(rj,0, φtilt)Lw hj,0sj,j
+ X
k∈Φ′
f\{0} q
Ptx
f l(dk,0)L2w gk,0xk,k (17)
where B(x, b) represents the 2-dimensional ball with radius
b centered at x, Ptx
m (Pftx) is the transmission power of a
MBS(FAP), rj,k (dj,k) is the distance from the j-th MBS
(FAP) to the k-th user, hj,k (gj,k) is the Rayleigh fading
channel between the j-th MBS (FAP) and the k-th user and
sj,k(xj,k) is the transmitted symbol from thej-th MBS (FAP)
to the k-th user, with |sj,k|2= 1 |xj,k|2= 1
. Additionally,
Φ′
f represents the femtocell resulting point process after all
FAPs that fall within the guard zone of a macrocell user have been removed in each macrocell. Note that in the femtocell tier, we use L2
w given the assumption that femtocell users
are located indoors, and so the interfering signal has to get throught two walls. For easiness of representation, from now on we drop the subscript in the desired links. The SIRs are given as
SIRm=
|h|2r−αmG(r, φ tilt)
Im
Φm+I m
Φ′
f
(18)
SIRf =
|g|2d−αf
IΦfm+I f
Φ′
f
(19)
whereIm
Φm = P
j∈Φm\{0}
|hj,0|2rj,−0αmG(rj,0, φtilt)and
Im
Φ′
f =
P
k∈Φ′
f\{B(0,Rc)}
|gj,0|2η d−k,αf0 Lw, represent,
re-spectively, the interference from the macrocell and fem-tocell tier observed by the macrocell user. Addition-ally, IΦfm =
P
j∈Φm
|hj,0|2rj,−0αmG(rj,0, φtilt) and IΦf′
f =
P
k∈Φ′
f\{0}
|gk,0|2d−k,α0L2w represent, respectively, the
interfer-ence from the macrocell and femtocell tier perceived by the femtocell user. Following the same approach as for the traditional network, the coverage probability in the macrocell tier is given as
Pc
m=P(SIRm> βm)
=Er,Im
Φm,I m
Φ′
f h
exp −s Im
Φm
exp−ηLws IΦm′
f i
=Er
EIm
Φm
exp −s Im
Φm
EIm
Φ′
f h
exp−ηLws IΦm′
f i
=Er
LIm
Φm(s)LI m
Φ′
f
(ηLws)
Pc=
R
rth10 2λmπr e
−λmπnr2+ 2
N s
hβrαm
αm−2(r −αm−2
ζ1−rth−αm1 +2ζ2)+ρ1 io
dr+
R
∞rth1
2λmπr e−λmπ{r
2
+ 2
N sρ2}dr
ifφtilt< q
AdB
12 φ3dB
R
rth10 2λmπr e
−λmπnr2+ 2
N s
h βrαm αm−2(r
−αm+2ζ
1−r−thαm1 +2ζ2)+rth−αm2 +2ζ3+ρ3 io
dr
+
R
rth2rth1
2λmπr e
−λmπ
r2+ 2
N s
ρ4+
βAF−1 (
r,φtilt)rαm r−thαm2 +2
(αm−2) ζ4
dr+exp(−λmπr
2
th2{1+N s2 [ β αm−2ζ1]})
1+ 2
N s( β αm−2ζ1)
ifφtilt≥ q
AdB
12 φ3dB
(15)
with ζ1=ζ(αm, β), ζ2=ζ
αm, rthr1 −αm
β, ζ3=ζ
αm, rthr2 −αm
β, ζ4=ζ
αm, rthr2 −αm
βAF−1(r, φ
tilt)
,
ρ1 = ρ
rth1,∞,AF
−1(y,φtilt)
β
, ρ2 = ρ
r,∞,β FF−−1(1y,φtilt(r,φtilt))
, ρ3 = ρ
rth1, rth2,AF
−1(y,φtilt)
β
, ρ4 =
ρr, rth2, F
−1(y,φtilt)
β F−1(r,φtilt)
.
where s = βmrmα G(r, φtilt) and η = Pftx Ptx
m. The Laplace
transform of the macrocell tier can be expressed as
LIm
Φm(s) = exp
−2πλm
N s
Z ∞
r
y dy
1 + ryαm βmF−F1−(1y,φtilt(r,φtilt))
.
(21) where the definition of the generating functional of a PPP was again used. It is worthwhile to notice that we have approximated (3) by (14) in this case. This approximation was not used in section III-A, because a macrocell only network, not providing a minimum radiated power (AdB), results in
not considering the minimum amount of interference leaked, which in turn is reflected in the optimum tilt angle always taking the maximum allowable value. In the case of the HetNet, this assumption is possible, since the femtocell tier provides the baseline interference. Note also that the Laplace transform for the macrocell interferenceIΦm can be neglected
in some scenarios where a large number of femtocells are deployed in the area. This depends on the values of the wall partition loss and path loss exponent. This assumption can greatly simplify the analysis (and speed up the result of the proposed optimization)
On the other hand, the Laplace transform of the interference from femtocells to macrocells (Lm
Φ′
f) forms a hole point
process for which an approximation (lower bound) can be expressed by considering the interference outsideRcand using
the formula for Rayleigh fading in [32]. The Laplace transform is then given by
LIm
Φ′
f
(ηLws) =
e−λfπ
(ηLws)δfEhhhδfγ1−δf,ηLwshR−cαf
i
− R2c ηs ηLw s+Rαfc
.
(22) whereh∼Exp(1). We further extend (22) and expressLIΦ′
f
as LIm
Φ′
f
(ηLws) =eλfπR
2
c ·
e−λfπR
2
c2F1
1,−δf;1−δf;−βrαmF−1(r)ηLwR−αf
c
.
(23) The derivation of (23) is given in Appendix B. Then, using the expressions for the Laplace transforms found in (21) and (23), the coverage probability for the macro-cell tier is expresed as in (28), where C(αm, φtilt, r) =
R
∞r
y dy
1+(yr)
αm F−1 (
y,φtilt)
βm F−1 (
r,φtilt) .
In the case of the femtocell tier, the number of femtocells which are interfering with each other is reduced due to the fact that all the femtocells which fall within the area comprised within a radius of Rc surrounding a macrocell user will
not transmit. Therefore, we use the thinning property of a PPP [30], in which case the effective density of interfering femtocells is given bypλf, wherepis the thinning probability.
ConsiderV=Sj∈ΦmVjas the set of all Voronoi cells formed
from the PPPΦm, whereVjrepresents the Voronoi cell having
point xj ∈ Φm as seed. The thinning probability represents
the probability that a femtocell placed at a point xk ∈ Φf
is located inside a Voronoi cell Vj and outside the area with
radiusRc surrounding a macrocell user located at a pointxu
uniformly distributed insideVj. This applies to all the Voronoi
cells in the network as we consider that all cells have a user to serve in each time slot. Thus, the thinning probability can be expressed as
p=P(xk∈ B/ (xu, Rc)|xk∈ Vj), ∀j∈Φm
= 1−P(xk ∈ B(xu, Rc)|xk∈ Vj)
(a)
≈1− πR
2
c
Acell
whereAcellis the typical (mean) area of a Voronoi cell, which
is by definition Acell = λm1 . Note that the approximation in
step (a) is obtained by using the ratio of the circular area covered by a radius Rc and the area of the Voronoi cell.
Note also from (24), that the maximum radius permissible is Rmax
c = √λmπ1 . With this value the area covered by the
guard zone equals the mean value of the Voronoi cells. Now, because a femtocell will only transmit if it is outside a radius
Rcfrom a macrocell user, there can be two types of outage: the
first is the one that occurs when a femtocell does not transmit (with probability 1−p) and second is one that takes place when the femtocell does transmit (with probabilityp) but the perceivedSIRf at the femtocell user is belowβf. Taking this
into account, we obtain the mean coverage probability for the femtocell tier as
Pfc=p P(SIRf > βf)
= (1−λmπR2c)Ed h
EIf
Φm h
exp−s′η−1dα0If
Φm i
·EIf
Φ′
f h
exp−s′L
wdα0IΦff i
= (1−λmπR2c)Ed
LIf
Φm(s
′η−1dα0)L
IΦf′
f
(s′Lwdα0)
.
(25)
wheres′=β
fLw. In order to simplify the analysis, and thanks
to the small expected distances between femtocells users and their serving FAPs, we use Jensen’s inequality in (25), in which case the femtocell coverage probability is approximated by
Pc
f ≈(1−λmπR2c)LIΦfm(s′η−
1R¯
f α0
)LIf
Φ′
f
(s′L
wR¯f α0
)
(26) whereR¯f = 2Rf3 , is the expected value of the distance from
femtocell users to their designated FAP. This expected value was found using the fact that the pdf of the distance D to the origin of a user uniformly distributed in a circular area of radius Rf isfD(d) = R2d2
f [25]. The results of simulations
presented in section V show that this approximation is indeed very accurate. Using the definition of the generating functional of a PPP like in the macrocell only case, the Laplace transform of the macrocell interference can be expressed as
LIf
Φm
(s′η−1R¯f α0
) =e−
2πλm Ns
R
∞0
x dx
1+β−1 ¯Rf−α0F−1 (
x,φtilt)xαm.
(27) On the other hand, the Laplace transformLIf
Φ′
f
(s′L
wR¯f α0
)
in (25) can be obtained directly from [33], considering the reduction of the interfering femtocells by a factor p. There-fore, using the values for the Laplace transforms previously described, the femtocell tier coverage probability is given as in (29). As in the macrocell coverage probability, for a highly dense scenario and depending on the wall partition loss, the interference from the macrocell tier could be neglected, re-sulting in a closed form expression for the femtocell coverage probability for those particular scenarios.
IV. ENERGY EFFICIENCY
We use the inverse of the Energy Consumption Rating (ECR) to characterize the EE of the network, which is given by
EE= T
P b/J/Hz (30)
whereT is the achievable throughput in bps/Hz andP is the total power consumed in Watts. So, the EE for the traditional and heterogeneous networks is given by
EE=
P
i∈{m,f}
λiPiclog2(1 +βi) P
i∈{m,f} λiPiT
(31)
wherePT
i is the total power consumed by a base station in the
i-th tier. For PT
i , we make use of the commonly used model
[34]–[36], which for macro- and femtocells is given by
PT
m=Ns Pcm+κmPmtx
(32)
PfT =Pcf+κfPftx (33)
where Ptx
i is the transmit power in the i-th tier, Pci is the
constant power component related to the signal processing, cooling of the site as well as battery backup in thei-th tier and
κiis a factor related to the efficiency of the power amplifier in
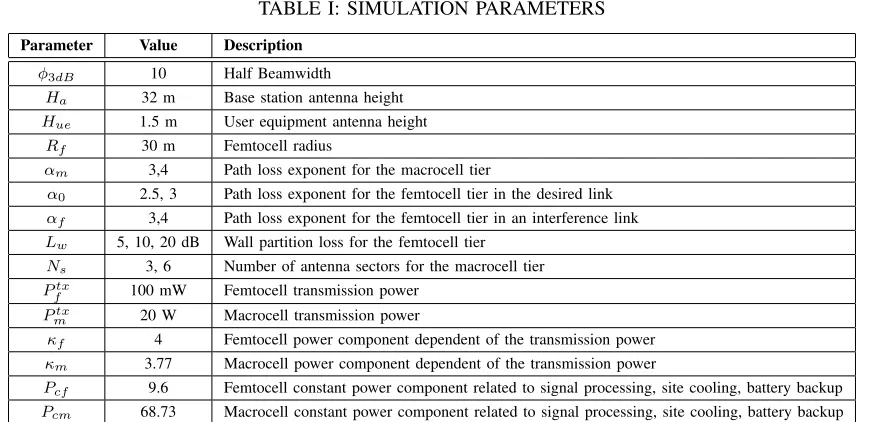
thei-th tier. The power related component values, along with the other network’s parameters are presented in Table I. We proceed to define the EE optimizations for both the traditional and two-tier networks.
A. Traditional Macrocell Network
For the case of an traditional network, the expression in (31) is simplified and the optimization problem proposed consists of finding the optimum antenna tilt (φ∗
tilt) that maximizes the
EE of the network, i.e.
φ∗tilt= arg max φtilt
Pc
m(βm, φtilt) log2(1 +βm)
Ns(Pcm+κmPmtx)
| {z }
EE
. (34)
Due to the complexity of the expression forEE in (34), we cannot find a closed-form solution. However, as the tilt angle is limited (same as its sensitivity in practice), the solution can be found for a small number of steps using a greedy search over the possible tilt values. Therefore, the complexity of the algorithm is simplyndegrees, wherendegreesis the number of
possible antenna tilts that the RET can provide. The results obtained for the traditional network are found in Section V.
B. Heterogeneous Network
In the case of the two-tier network described in Section III, the guard zoneRchas the effect of enhancing the performance
of the macrocell tier by reducing the received interference from femtocells located in the vicinity of a macrocell user, therefore a bigger value ofRcis desired in this case. However,
the selection of the size of Rc has a negative impact in the
Pmc = eλfπR
2
c Z ∞
0
2λmπre− λmπr2
1+ 2
r2NsC(αm,φtilt,r)
−λfπR2
c2F1
1,− 2
αf;1−
2
αf;−βrαmF(r,φtilt)
−1ηLwR−αf
c
dr (28)
Pfc = 1−λmπRc2
e−
λf(1−λmπR2c)(Rf¯ α0βL2
w)δf π2δf
sin(πδf)− 2πλm
Ns
R
∞0
x dx
1+β−1 ¯Rf−α0F−1 (
x,φtilt)xαm
[image:10.612.90.528.150.361.2](29)
TABLE I: SIMULATION PARAMETERS
Parameter Value Description
φ3dB 10 Half Beamwidth
Ha 32 m Base station antenna height Hue 1.5 m User equipment antenna height
Rf 30 m Femtocell radius
αm 3,4 Path loss exponent for the macrocell tier
α0 2.5, 3 Path loss exponent for the femtocell tier in the desired link αf 3,4 Path loss exponent for the femtocell tier in an interference link Lw 5, 10, 20 dB Wall partition loss for the femtocell tier
Ns 3, 6 Number of antenna sectors for the macrocell tier Ptx
f 100 mW Femtocell transmission power Ptx
m 20 W Macrocell transmission power
κf 4 Femtocell power component dependent of the transmission power κm 3.77 Macrocell power component dependent of the transmission power
Pcf 9.6 Femtocell constant power component related to signal processing, site cooling, battery backup Pcm 68.73 Macrocell constant power component related to signal processing, site cooling, battery backup
cause a higher number of femtocells to stop transmitting, and so, the coverage probability in this tier would be reduced. This leads to the conclusion that there must be a tradeoff in the selection of the guard zone size to balance the performance of macro- and femtocell tiers. On the other hand, as described in Section I, the selection of the tilt angle φtilt can significantly
increase the performance of the macrocell tier, and with the inclusion of a tier of interfering femtocells its optimum value is different from the one found for a traditional network. Furthermore, we are interested in obtaining the values of Rc
and φtilt that would yield a good performance in terms of
the overall network energy efficiency. Taking into account the considerations just described, we propose an optimization problem to maximize the energy efficiency of the network with constraints on the QoS requirements of both tiers. We aim to find both the optimum antenna tilt angleφ∗
tiltand guard
zoneR∗
c that maximize the energy efficiency with the required
constraints. Formally, the problem is described as follows
φ∗tilt, R∗c = arg max φtilt,Rc
λmPmclog2(1 +βm) +λfPfclog2(1 +βf)
Ns(Pcm+κmPmtx) +Pcf+κfPftx
| {z }
EE
(35)
s.t. Pmc ≥1−ǫm,
Pfc≥1−ǫf
where ǫm and ǫf are respectively, the maximum outage
probabilities permitted for macro and femto tiers. We denote
EE⋆ as the maximum energy efficiency that can be achieved
by selecting the optimum values φ⋆
tilt andR⋆c. Although the
proposed optimization problem cannot adapt to the changes in the environment in an online fashion, it can still provide an overall solution to the system without the need to run time consuming simulations. Therefore, when a change in the system parameters (such as the densities of macro- and/or fem-tocell) occurs, the network operators can obtain a centralized solution that will yield a good performance depending upon the changes in the system. For the expressions in (35), we proceed to use a non-linear software package in Matlab, using an interior point method to solve the optimization problem. The numerical results are showed in Section V.
V. RESULTS
The numerical results of this work are presented in figures 3 to 9, where the lines correspond to the analytical results while the circles represent the results of MonteCarlo simulations. The system parameters used in the simulations are presented in Table I, where we have used typical values found in practice. For the simulations, we first generate a random number of MBSs in the area following a PPP. Then, we proceed to obtain the Voronoi tessellation with the MBSs deployed. The typical user is located at the origin and associated with the closest MBS, according to Slivnyak’s theorem. Then, we obtain the interference from the other MBSs considering the distant-dependent vertical pattern, while at the same time, the number of interferers is reduced randomly by a factor equal to Ns
[image:10.612.50.303.607.694.2](uniformly) distributed user is generated within the area of each Voronoi cell. Then, a circular area of radius Rc is
considered around each user and all the FAPs that fall within its circular area are considered inactive. The performance of both macro- and femtocell users is obtained by considering only the femtocells which remain active. Additionally, the simulations for the femtocell tier are obtained by considering that the user is uniformly distributed in the coverage area of its serving FAP, while the analytical results are attained by using the expected value of the distance from the user to its serving FAP, as presented in the theoretical analysis. As mentioned before, we focused on a RET system, where the downtilt of the antenna can be remotely configured. Typical ranges for the electrical antenna tilt found in practice are 0−15◦ [37], [38]. However, state of the art antennas have been reported to achieve 18◦ [39], and even 20◦ [40]. Therefore we select the latter as the maximum permissible tilt angle in our setup.
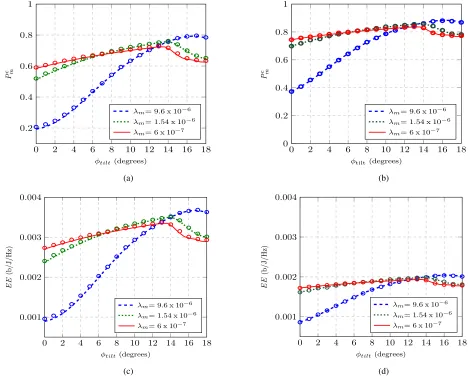
The coverage probability and EE of a traditional network are presented in Fig. 3 as a function of the tilt angle. Figures 3(a) and 3(b) show the coverage probabilities for antennas with
120◦ (N
S = 3) and60◦ (NS = 6) sectorization, respectively.
It can be seen that there is an antenna tilt angle that maximizes the coverage probability (and therefore, the energy efficiency). The former can be explained as follows: for low values of
φtilt the coverage probability is low, due to the fact that the
direction of the main lobe of the antenna does not point to the desired coverage area of each cell. As φtilt increases,
most of the radiated power is pointed towards the area of the desired cell and less interference is created at the neighbouring cells, which is reflected in an increase in the coverage (and energy efficiency) of the network. Finally, the coverage reaches a maximum at the point where a significant portion of the radiated power is projected towards the desired cell while little interference is caused at the other cells. After that maximum, increasing φtilt cause very little interference but would also
cover a very small portion of the desired cell, which would make the coverage probability drop. Additionally, it can be seen that (as expected) the optimum tilt angle is strongly coupled with the density of macro stations. This is due to the fact that with a higher density, the mean area of the cells is smaller and so a higher value of the antenna tilt is required to point to the smaller cell area. As is expected, the coverage probability is further increased with the use of more antenna sectors, as the interference is further reduced. On the other hand, Figures 3(c) and 3(d) show the performance in terms of the EE. It can be seen that while the lines follow the same trends as in the case of coverage probability, the 120◦ sectorized antennas outperform the 60◦ sectorized antennas. This is due to the fact that the power consumed by using extra antenna sectors has more impact on the EE than the gains in throughput. Therefore, an inherent trade-off between the throughput and the EE of the system can be perceived.
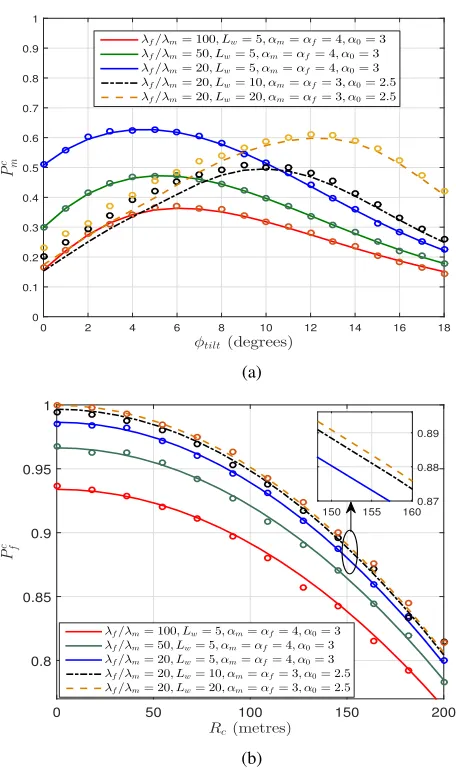
In Fig. 4 the coverage probability for the macrocell and femtocell tiers are shown as a function of the antenna tilt angle and guard zone, respectively. The results are presented for an average number of femtocells20,50and100deployed per macrocell, and for different values of path loss exponents and wall partition loss. In 4(a), the coverage probability of
the macrocell tier is displayed as a function of the antenna tilt angle when a guard zone of Rc = 200 m. is used.
It can be seen that the interference from the femtocell tier has the effect of decreasing the value of the optimum tilt angle in comparison with a traditional network. We observe that the tilt angle that maximizes the coverage probability is highly dependent on both, the path loss exponent and the wall partition loss. In general, a higher value of Lw results in a
higher value of the optimum tilt angle. This is due to the fact that a higher wall partition loss prevents interference from the femtocell to seriously affect the macrocell user performance, and so, the results resembles one of a macrocell-only network. Additionally, in general the smaller the path loss exponent, the highest the value of the antenna tilt angle. This also agrees with the behaviour previously described, in the sense that a smaller value of the path loss exponent results in an increase in the interference received from the femtocell tier. On the other hand, Fig. 4(b) shows the coverage probability for the femtocell tier as a function of the macrocell’s guard zoneRc.
As an increase in the size ofRcwould prevent a larger number
of femtocells from transmitting in the proximity of a macrocell user, the overall coverage in the femto tier is reduced. In this case, a smaller value of the path loss exponent results in an increase in the femtocell user performance. This is due to the small distances between a femtocell user and its serving FAP, for which a smaller path loss exponent results in a stronger signal received at the desired link, effectively increasing the performance. We also observe that the wall partition loss does not have such a strong effect on the femtocell tier as opposed to the case of the macrocell tier. This is due to the fact that the signal from an indoor FAP to another has to transverse through 2 walls. Moreover, the scenarios with wall partition loss of10
dB and20 dB present almost identical performances. Fig. 5 shows two views of the coverage probability of the macrocell tier as a function of both, φtilt and Rc. It is
evident that a bigger guard zone is desirable in this tier, as it would protect the macrocell users from a higher number of interferers. Also from Fig. 5, it can be seen that the tilt angle
φtilt that maximizes the coverage probability varies with the
size ofRc. In general, the values ofφtilt in this scenario are
smaller than the ones found for the traditional network, when the number of femtocells deployed is relatively small. On the other hand, increasing λf results in an increase on the tilt
angle that maximizes the coverage in this tier.
Fig. 6 shows the EE for a two tier network as a function of
Rc andφtilt. It can be seen that there is an antenna tilt angle
that maximizes the EE for each value ofRc. Also, the smaller
the value of Rc, the higher is the EE of the network. This
is entirely related to the femtocell tier, given the fact that the femtocells provide high gains in the total throughput of the network, and so, with a higher number of active femtocells (smaller value ofRc), there are more gains in the EE of the
0 2 4 6 8 10 12 14 16 18 0.2
0.4 0.6 0.8 1
φtilt(degrees)
P
c m
λm= 9.6 x 10⁻⁶ λm= 1.54 x 10⁻⁶ λm= 6 x 10⁻⁷
(a)
0 2 4 6 8 10 12 14 16 18
0 0.2 0.4 0.6 0.8 1
φtilt(degrees)
P
c m
λm= 9.6 x 10⁻⁶ λm= 1.54 x 10⁻⁶ λm= 6 x 10⁻⁷
(b)
0 2 4 6 8 10 12 14 16 18
0.001 0.002 0.003 0.004
φtilt(degrees)
E
E
(b
/J
/H
z)
λm= 9.6 x 10⁻⁶ λm= 1.54 x 10⁻⁶ λm= 6 x 10⁻⁷
(c)
0 2 4 6 8 10 12 14 16 18
0.001 0.002 0.003 0.004
φtilt(degrees)
E
E
(b
/J
/H
z)
λm= 9.6 x 10⁻⁶ λm= 1.54 x 10⁻⁶ λm= 6 x 10⁻⁷
[image:12.612.50.520.59.436.2](d)
Fig. 3: Coverage probabilities for (a) 3 sectors (Ns= 3) and (b) 6 sectors (Ns= 6), and energy efficiencies for (c) 3 sectors (Ns= 3) and (d) 6 sectors (Ns= 6) of a traditional network as a function ofφtilt,. In all figures,βm= 3and we present the results forλm= 9.6 x 10−6,1.54 x 10−6 and6 x 10−7 .
The results from the optimization problem are presented in figures 7 to 9. Fig. 7 shows φ⋆
tilt as a function of the density
of femtocells deployed per macrocell. It can be seen that for a small number of femtocells, the optimum tilt angle is also small. However, as the interference from the femtocell tier increases, the tilt angle that maximizes the EE (and satisfies the constrains) increases until it settles at a fixed value when the number of femtocells deployed is high enough. Intuitively, as the number of femtocell increases, the edge users suffer the most damage to their received signal strength, and so a higher value for the tilt angle would steer the main lobe to an area closer to the edge of the cell to compensate for the interference from the femto tier.
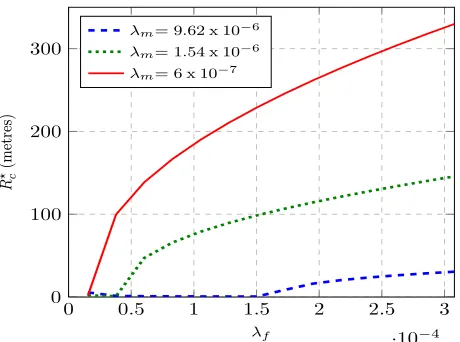
Fig. 8 showsR⋆
c as a function of the density of femtocells
deployed per macrocell. As expected, as the number of fem-tocells increases, a bigger guard zone is required in order to protect the macrocell users from the femtocell tier interference. Fig. 9 shows the optimum EE that complies with the constraints of the optimization problem when the density of femtocells per macrocell varies. It can be seen that when the number of femtocells increases from a small value, the EE of
the network is significantly increased. This is in accordance with the overall expected gains in throughput in the network that come from having more femtocells deployed. However, if the number of femtocells deployed is too high, the maximum achievable EEmax first reaches a limit and then it starts to
decay. This occurs when the interference starts to have a major effect and the gains in throughput are not as high as compared with the total power consumed in the network. In other words, the power consumed starts to outweigh the gains in throughput obtained by deploying a higher number of femtocells in the network. It is worthwhile to notice that even in the highest number of femtocells analysed in this work (200), the overall EE of the network is still superior to the case of the traditional network when the same value of λm is used. However, the
φtilt(degrees)
0 2 4 6 8 10 12 14 16 18
P
c m
0 0.1 0.2 0.3 0.4 0.5 0.6 0.7 0.8 0.9 1
λf/λm= 100, Lw= 5,αm=αf= 4,α0= 3
λf/λm= 50, Lw= 5,αm=αf= 4,α0= 3
λf/λm= 20, Lw= 5,αm=αf= 4,α0= 3
λf/λm= 20, Lw= 10,αm=αf= 3,α0= 2.5
λf/λm= 20, Lw= 20,αm=αf= 3,α0= 2.5
(a)
Rc(metres)
0 50 100 150 200
P
c f
0.8 0.85 0.9 0.95 1
λf/λm= 100, Lw= 5,αm=αf= 4,α0= 3
λf/λm= 50, Lw= 5,αm=αf= 4,α0= 3 λf/λm= 20, Lw= 5,αm=αf= 4,α0= 3 λf/λm= 20, Lw= 10,αm=αf= 3,α0= 2.5 λf/λm= 20, Lw= 20,αm=αf= 3,α0= 2.5
150 155 160 0.87 0.88 0.89
[image:13.612.49.277.51.435.2](b)
Fig. 4: Coverage probability of a heterogeneous network, with
βm =βf = 3, Lw = 5dB, αm =αf = 4,α0 = 3, λm =
1.54 x 10⁻⁶ (typicall hexagonal cell radius of 500 m.), and
λf/λm = 20,50 and100 for (a) macrocell as a function of
φtilt (with fixed Rc = 200 m), and (b) femtocell tier as a
function of Rc.
VI. CONCLUSION
In this work we provided a stochastic geometry framework to analize the performance of the network in terms of EE when the antenna tilt angle of macrocells is considered as an optimization parameter. In the case of a traditional network, we observe that our results can be easily scaled with regards to the density of macrocells deployed in the network. As expected, the higher the density of macrocells, the bigger is the antenna tilt angle that optimizes the overall coverage and EE. In the case of a heterogeneous network consisting of macro-and femtocells we observe that even for a small number of femtocells deployed in the network, the performance of the macrocell user significantly decreases. Therefore, the use of a guard zone along with the tilt angle was proposed. From the results, it was verified that the EE of the network can be greatly increased by the inclusion of femtocells in comparison with a traditional network. However, the inclusion of femtocells using
0 5
10 15
20
0 100
2000
0.2
0.4
φtilt(degrees)
Rc(metres)
P
[image:13.612.328.547.59.208.2]c m
Fig. 5: Macrocell coverage probability as a function of φtilt
and Rc with βm = βf = 3, Lw = 5 dB, αm = αf = 4,
λm= 1.54 x 10⁻⁶ (typical hexagonal cell radius of 500 m),
and λmλf = 50.
0 10
20 0
100 200
8·10−2 9·10−2 0.1 0.11
φtilt(degrees) Rc(metres)
Fig. 6: Energy efficiency of a two tier network as a function of Rc and φtilt for a two tier network with βm = βf = 3,
Lw = 5 dB, αm = αf = 4, α0 = 3, λm = 1.54 x 10⁻⁶
(typicall cell radius of500 m), and λmλf = 50.
[image:13.612.315.534.314.467.2]0 0.5 1 1.5 2 2.5 3
·10−4
5 10 15
λf
φ
⋆ tilt
(d
eg
re
es
)
[image:14.612.315.544.52.225.2]λm= 9.62 x 10⁻⁶ λm= 1.54 x 10⁻⁶ λm= 6 x 10⁻⁷
Fig. 7: Optimum tilt of a two tier network as a function of the density of femtocells for a two tier network withLw= 5,
βm=βf = 3,λm= 9.6 x 10⁻⁶, 1.54 x 10⁻⁶ and 6 x 10⁻⁷,
ǫm= 0.3 andǫf = 0.8.
0 0.5 1 1.5 2 2.5 3
·10−4
0 100 200 300
λf
R
⋆ c(m
et
re
s)
λm= 9.62 x 10⁻⁶ λm= 1.54 x 10⁻⁶ λm= 6 x 10⁻⁷
Fig. 8: Optimum Rc (i.e., R∗c) of a two tier network as a
function of the density of femtocells for a two tier network with Lw = 5,βm=βf = 3, λm = 9.6 x 10−6,1.54 x 10−6
and6 x 10−7m.), ǫ
m= 0.3andǫf = 0.8.
APPENDIXA DERIVATION OFPmc IN(15)
First, we derive two important expressions that will help to express the final value ofPc
m. We take the general expression Z b
a
y dy
1 +B1 yrαm (36)
whereB can be any function not dependant ony. We proceed to find an alternative expression for (36). Similar to the anal-ysis in [10], we make use of the substitutionu=
rj
rB
1
αm 2
, and so
Z b
a
y dy
1 + 1
B y r
αm =
Z b
rB
1
αm
!2
a
rB1/αm
2
rBαm1 2
du
1 +uαm2
. (37)
0 0.5 1 1.5 2 2.5 3
·10−4
0 5·10−2
0.1 0.15
λf
E
E
⋆(b
it
s/
J/
H
z)
[image:14.612.54.282.52.225.2]λm= 9.62 x 10⁻⁶ λm= 1.54 x 10⁻⁶ λm= 6 x 10⁻⁷
Fig. 9: Optimum energy efficiency of a two tier network as a function of the density of femtocells for a two tier network withLw = 5, βm =βf = 3,λm= 9.6 x 10⁻⁶, 1.54 x 10⁻⁶
and6 x 10−7,ǫ
m= 0.3andǫf = 0.8.
Now, the binomial negative series expansion is defined as
(c+x)−n =
∞
X
k=0
−n
k
xkc−n−k
=
∞
X
k=0
(−1)k
n+k−1
k
xkc−n−k. (38)
Applying the definition in (38) to (37), with c = uαm2 ,
x= 1andn= 1, we obtain
Z b
a
y dy
1 +B1 yrαm =
(39)
rBαm1 2
2
∞
X
k=0
Z b
rB1/αm
2
a rB1/αm
2 (−1)
k(1)k
k! u
−αm(2k+1)du (40)
where (x)k = Γ(Γ(x+x)k) = x(x+ 1)...(x+k −1), is the
Pochhammer symbol [41], and we used the property (1)k =
k!. Evaluating the integral on the R.H.S. of (40) we obtain
Z b
a
y dy
1 +B1 yrαm =
rBαm1 2
2
∞
X
k=0
(−1)k(1)k
k!
a rB1/αm
−(1+k)αm+2
αm(k+1) 2 −1
−
∞
X
k=0
(−1)k(1)k
k! −
b rB1/αm
−(1+k)αm+2
αm(k+1) 2 −1
=rαmB
a2−αm
∞
X
k=0
(−1)k(1)k
k!
a rB1/αm
−αmk
αm−2 +k
−b2−αm ∞
X
k=0
(−1)k(1)k
k!
a rB1/αm
−αmk
αm−2 +k
[image:14.612.53.283.293.464.2]By noting that (x)k
(x+1)k = x
x+k, withx=αm−2, then (41)
can be expressed as
Z b
a
y dy
1 + 1
B y r
αm =
rαmB
αm−2
a2−αm
∞
X
k=0
(1)k
k!
(αm−2)− rB1a/αm
−αmk
αm−2 +k
−b2−αm
∞
X
k=0
(1)k
k!
(αm−2)− a rB1/αm
−αmk
αm−2 +k
. (42)
The summations in (42) correspond to the general expression of the hypergeometric function given by 2F1(a, b;c;x) =
∞
P
k=0 (a)k(b)k
(c)k
(x)k
k! , and so using this expression we obtain
Z b
a
y dy
1 +B1 yrαm =
rαmB
αm−2
a22−αmF1
1,1− 2
αm
; 2− 2
αm
;−a
r
−αm
B
−b22−αmF1 1,1− 2
αm
; 2− 2
αm ;− b r −αm B !! . (43)
In the special case in which b=∞, (43) reduces to
Z ∞
a
y dy
1 + 1
B y r
αm =
rαmB a2−αm
αm−2 2
F1
1,1− 2
αm
; 2− 2
αm
;−a
r −αm B . (44)
Note that the expressions in (43) and (44) only hold when B
is not a function ofy, in which case we cannot find a closed form expression for (36). Now, as was stated in Section II, depending upon φtilt, we have two cases of antenna pattern
expressions. Forφtilt< p
AdB/12φ3dB we have the sum of
two integrals expressed as
Pmc = Z rth1
0
2πλmexp −λmπr2
+ 2
Ns "Z rth1
r
y dy
1 + 1β yrα +
Z ∞
rth1
y dy
1 +G100−1(βy) yrα
#)!
dr
+
Z ∞
rth1
2πλmexp −λmπr2
+ 2
Ns Z rth1
r
y dy
1 + FF−−11((rri))β
y r α
dr. (45)
And for the case of φtilt ≥ p
AdB/12φ3dB, we have 3
integrals expressed as
Pmc = Z rth1
0
2πλmrexp −λmπr2
+ 2
Ns "Z rth1
r
y dy
1 +β1 yrα +
Z rth2
rth1
y dri
1 +F100−1(βy) yrα +
Z ∞
rth2
y dy
1 + 1
β y r α #)! dr +
Z rth2
rth1
2πλmrexp −λmπ
r2
+ 2
Ns Z rth2
r
y dy
1 +FF−−11((ry))β
y r α+ Z ∞ rth2 y dy
1 + 1
β y r α dr + Z ∞ rth2
2πλmrexp −λmπ r2 + 2 Ns Z ∞ r y dy
1 +FF−−11((ry))β
y r α
dr. (46)
Substituting the expressions (43) and (44) previously found into (45) and (46), we obtain the results in (15), which concludes the proof.
APPENDIXB PROOF OFLIΦ′
f(ηs) IN(23)
From (22), we have
LIΦ′
f(ηs) =exp
−λfπ
(ηs)δfEh h
hδfγ1−δf, ηshR−cαf i
| {z }
ξ
− R
2
cηs
ηs+Rαfc
. (47)
By using the definition of the incomplete Gamma function in
ξ, we have
ξ=
Z ∞
0
hδfe−h
Z ηshRc−αf
0
e−tt−δfdt dh. (48)
By using the substitutionx=t−1(ηshR−αf
c ), we obtain
ξ=ηsR−cαf
1−δfZ ∞
1
xδf−2
Z ∞
0
h e−
h 1+ηsR
−αf
c x
!
dh dx
=ηsR−cαf
1−δfZ ∞
1
xδf−2
1 +ηsR
−αf
c x
2dx
=ηsR−cαf
1−δfZ ∞
1
xδf
x+ηsR−cαf 2 dx.