An Empirical Analysis to Identify the Effect of
Indexing on Influence Detection using Graph
Databases
Mitali Desai, Rupa G. Mehta, Dipti P. Rana
Abstract: The data generated on social media platforms such as Twitter, Facebook, LinkedIn etc. are highly connected. Such data can be efficiently stored and analyzed using graph databases due to the inherent property of graphs to model connected data. To reduce the time complexity of data retrieval from huge graph databases, various indexing techniques are used. This paper presents an extensive empirical analysis on popular graph databases i.e. Neo4j, ArangoDB and OrientDB; with an aim to measure the competencies and effectiveness of primitive indexing techniques on query response time to identify the influencing entities from Twitter data. The analysis demonstrates that Neo4j performs efficient and stable for load, relation and property queries compare to other two databases whereas the performance of OrientDB can be improved using primitive indexing.
Index Terms: graph database, index, influence detection, query processing, Twitter
I. INTRODUCTION
Social media has emerged as a global digital platform for people to communicate, socialize, launch discussion forums, conduct surveys and share their personal information. Apart from such activities, people use social media to express their opinions about any forthcoming events and/or feedbacks about past events. Such data are highly impactful in future predictions and decision making in various sectors such as education, business intelligence, marketing, government bodies, commercial organizations and politics [1]. Each user has the potential to outspread his opinions (positive/negative) across the social network but some users demonstrate their dominance in opinion propagation. Identifying these dominant (influential) users who can influence the opinions of other users by word of mouth, viral promotions or specific actions is helpful for marketing, advertising or spreading influence.
Social media data are highly connected. Graph databases are extremely essential for highly connected data produced on social media platforms such as Twitter, Facebook, Google and LinkedIn [2]. Property queries, executed on node properties in graph databases play significant role for influence detection e.g. identifying influencing entities in various domains of social media data, analyzing the influence of food habits on commutative/non commutative diseases, recognizing influencing customers for customer retention analysis.
Revised Manuscript Received on 30 June, 2019.
Mitali Desai, Rupa G. Mehta,Dipti P. Rana, Computer Engineering Department, Sardar Vallabhbhai National Institute of Technology (SVNIT), Surat, India.
,
Query responsiveness is a crucial parameter for such highly
interactive applications. Traditional sequential search techniques implemented in graph databases demonstrate poor performance due to high computational complexity of pair-wise comparisons, making it unsuitable for real time applications [3]–[ 4]. As the connected and high-volume data in graph databases demand an efficient query processing mechanism [5], various indexing techniques are implemented in graph databases [6]–[11].
In literature, extensive comparisons of various graph databases like Neo4j, ArangoDB, OrientDB, MarkLogic, AllegroGraph, Flock, Titan, GraphDB, HyperGraphDB [12]–[21] are performed, with respect to several aspects of data, storage and query. To the best to our knowledge, no extensive analysis is done on graph databases, with an aim to analyze the effect of indexing on query response time. The objective of this research is to present an extensive analysis on primitive indexing techniques of recent graph databases. Amidst all recent graph databases, Neo4j, ArangoDB and OrientDB are highly exploited as they possess protuberant characteristics like application diversity, ACID property, interactive GUI, simple query language, provision for property graph models and extensive primitive indexing. This research focuses on graph databases supporting single core graph and simple data structure i.e. Neo4j, ArangoDB and OrientDB for influence detection from ‘Russian Troll Tweets’ dataset.
II. TECHNICALBACKGROUND
This section emphases on the storage structure and indexing mechanisms of Neo4j, ArangoDB and OrientDB. The related work and incentive of this research are furthermore described in this section.
A. Neo4j
Neo4j has been recently emerged as a leading graph database [13]–[14]. Neo4j supports property graph model with nodes and relations, and both having properties in terms of attributes-value pairs [19]. It utilizes Cypher Query Language (CQL) for traversal and property queries [12], [21]. Initially the indexing implemented in Neo4j required each index operation to be performed explicitly and manually. To eliminate the manual intervention and enhance the indexing module, Neo4j introduced auto indexing which automatically incorporates any changes made on data into index using the global property key. The global property key excerpts same property of different nodes having no semantic correlation, which degrades query
property ‘name’ extracts both Person.name and Company.name from database having two distinct nodes Person and Company. This limitation is resolved by introducing schema indexing in latest version of Neo4j for node properties while index on edge properties is still a persistent challenge for researchers [12], [16].
B. ArangoDB
ArangoDB is a native multi-model data storage platform and supports three kinds of data structures i.e. documents, key-value pairs and graphs. Using a single query language i.e. ArangoDB Query Language (AQL), any data structure can be exploited [4]. From the perception of data model, ArangoDB has a document based intrinsic storage where documents are grouped into collections. Every collection depicts either a node or a relation. To give the deception of graph like structure, two or more document collections (node types) are linked by another document collection (edge type) in database. Edge type collection includes two special attributes i.e. _from and _to for creating edges in graph database. ArangoDB automatically indexes documents using system attributes _id and _key for node collections, whereas _from and _to for edge collections. The former index is a primary index and is mainly a hash value for each document key. The latter index is an edge index. These indexes are automatically used while performing AQL queries [21]. In addition, ArangoDB allows various user defined indexing such as hash, skiplist, fulltext and geo indexes [4], [21]. Hash and skiplist indexes can be created on single or multiple attributes and can optionally be declared as sparse. Sparse option will not index documents containing any of the index attribute values as NULL. The skiplist index is used for range as well as equality queries on index attributes. The fulltext index in ArangoDB is specifically used on attributes having textual values. The fulltext index created on such attributes fragments the textual values into individual words and stores along with the document comprises them. Then, queries can be performed on documents by individual words or a combination of words. The geo index stores geo coordinates and can be used to efficiently find all documents that are in neighboring of certain geo coordinate.
C. OrientDB
Like ArangoDB, OrientDB supports three data structures i.e. documents, key-value pairs and graphs. To exploit any data structure in OrientDB, Structured Query Language (SQL) similar query language is used [4]. Like the collection in ArangoDB, group of documents is signified as cluster in OrientDB [7]. OrientDB has three kinds of indexing techniques. Apart from, hash and fulltext indexes explained in Section B, OrientDB provides SB Tree index which is based on B-Tree index with several optimizations for data insertion and range queries [12].
D. Related Work and Findings
Mpinda, Ferreira, Ribeiro and Santos in [16] evaluated the performance of Neo4j and OrientDB for Twitter data, through indexing. The authors concluded that for large data, OrientDB with indexing outperforms Neo4j. Angles provided systematic comparison of AllegroGraph, DEX, Filament, G-Store, InfiniteGraph, Neo4j, Sones, vertexDB and
HyperGraphDB based on data storage, data manipulation, data structure, data representation, query mechanism and integrity constraints in [17]. The author concluded that Neo4j provides an innate support for majority of features like data storage, data manipulation, query mechanism and integrity constraints; nonetheless this study lacks the real-life implementation of its analysis. Fernandes and Bernardino in [18] presented comparison of AllegroGraph, Neo4j, ArangoDB, InfiniteGraph and OrientDB based on schema flexibility, query language, backup capability and scalability. The authors concluded that Neo4j, ArangoDB and OrientDB offer the superlative performance among all. Neo4j provides great support for storage, backups, scalability and powerful query languages whereas ArangoDB and OrientDB provide an additional superiority in terms of flexible schema. In [19], Jadhav and Oberoi presented the empirical study on Neo4j and DEX for synthetic Facebook dataset based on SocNet data model 2.2 and deduced that Neo4j outperforms DEX. Jouili and Vansteenberghe in [20], presented distributed graph database comparison framework and analyzed the performance of Neo4j, OreintDB, Titan and DEX for three workloads i.e. load, traversal and intensive workloads. Authors concluded that Neo4j outperforms among all for traversal workload while DEX has efficient performance for read-write intensive workload compare to Neo4j.
From thorough literature survey [14]–[21], we deduce: i) for various applications such as influence detection, sentiment analysis, recommendation system, community discovery and topic detection in social network; generally, Neo4j is used. ii) the inherent document based storage structure makes ArangoDB and OrientDB less suitable for complex network data. Though, the performance can be improved using various indexing mechanisms. iii) several literatures present the theoretical comparisons of popular graph databases whereas the empirical analysis is lacking, especially with a clear purpose of exploring the effect of indexing on property query responsiveness. iv) existing literature that majorly focuses on experiential analysis of various graph databases includes search which exploits the link information of the graph, e.g. “Finding the chain of friends of a specific user to certain depth”. However, the query focused on properties e.g. “Finding the users located in MUMBAI” needs researchers’ attention.
In this paper, an extensive experimental analysis of primitive indexing solutions of three most popular graph databases i.e. Neo4j, ArangoDB and OrientDB is presented, for influence detection from Twitter data, precisely in terms of property queries.
III. OPERATIONALGROUNDWORK
In this section, the dataset information, framework of execution, the built query set and the implementation process flow are discussed in detail.
A. Dataset Description and Data Model
database [13]–[14]. In the domain of influence detection, Politics is a dominant sector, where influential users who can appeal the masses are identified from social network and then approached for political campaigns. Considering the expediency of finding influence in political domain, in this research, the experiments are carried out on ‘Russian Troll Tweets’ dataset that contains Millions of Tweets tied by Twitter as vindictive activity from Russia-linked Twitter accounts during the 2016 U.S presidential election [22]. The dataset has been widely explored in different applications like influence finding, sentiment analysis, Natural Language Processing (NLP), fill in missing values and analysis of various graph algorithms.
The data contain three file fragments i.e. users (record count: 50 and size: 3.5 KB), tweets (record count: 20,757 and size: 1.5 MB) and hashtags (record count: 84,908 and size: 3.1 MB). As the aim of this research is to work with graph database, formulation of data into suitable graph model is necessary. The graph model is depicted in Fig. 1.
[image:3.595.304.547.85.235.2]The data model is formulated depending upon the data files in the dataset. The relations are created to connect distinct data files in the dataset whereas the metadata of a single file are stored as properties in graph model.
Fig. 1. Data model.
B. Execution Framework
The execution framework to find the influence from the dataset is represented in Fig. 2.
Fig. 2. The execution framework.
Load queries signify importing dataset into Neo4j, ArangoDB and OrientDB respectively. Using import data scripts, three files of dataset i.e. users, tweets and hashtags as discussed in Section A are loaded and three respective kinds of nodes are created. The additional information is stored as node properties with individual node. Relation queries are performed to formulate the complete graph structure by building relations (edges) among created nodes as per the data model depicted in Fig. 1. Property queries are built on node properties and are designed to find top k (here k = 10) influencing entities such as influencing users, tweets, locations and hashtags from the dataset.
C. Query Set
As depicted in Fig. 2, the execution framework encompasses three core tasks i.e. data loading (node creation), relations construction and influence finding from dataset. In accordance, the queries are categorized in three types i) load queries ii) relation queries and iii) property queries, respectively for each task.
Table I. Query set
Query Type
Quer y ID
Query (Influence)
Attribute
Query
No. of Records Retrieve
d
Load Query
(QL) QL1
- Load Users file
-
QL2 Load Tweets file
QL3 Load Hashtags file
Relation Query
(QR) QR1
- Create TWEETS relation
-
QR2 Create HAS_HASHTAG relation
QR3 Create USED_HASHTAG relation
Property Query (Influence)
(QP)
QP1 Followers count Display all users having more than 100 followers 46
QP2 Screen name Display information of user with a specific screen name 1
QP3
Location Display 10 most popular locations that users list in their profiles in decreasing order of total count
10
QP4 Friends count Display user IDs of top 10 users having maximum friends in descending order of friends count 10 QP5 Retweet count Display top 10 users and their tweets having maximum retweets count in descending order 10
QP6 Hashtags Display most popular top 10 hashtags used by users in descending order with their usage count 10
QP7 Tweet count Display top 10 users having maximum tweets in descending order 10
QP8 Screen name
Location Followers count
Display a user with specific screen_name, location and followers_count 1
QP9 Display a user with specific location, screen_name and followers_count 1
QP10 Name Display all records of user having ‘Lindsey’ in name 1
QP11 Mentions Display all records of tweets having ‘real dlhughley’ in mentions 4
A set of queries is built to accomplish each task and evaluated in selected graph databases. Each query type is
[image:3.595.44.553.391.754.2]each type is represented as QTi.
The categorization of queries is presented in Table I with detailed description of query tasks and query attributes. The response time for each query is noted with: i) no indexing ii) single indexing iii) multiple indexing and iv) hybrid indexing. The indexing is performed on queries based upon the appropriateness of index type and query attributes; e.g. the full text index is performed only on queries having query attributes with textual values. Queries QP1 to QP7 are regular queries whereas QP8 to QP11 are specially designed to analyze specific indexes such as full text and composite hash index.
Various analysis on primitive indexing techniques of three graph databases i.e. Neo4j, ArangoDB and OrientDB are performed and results are represented in Section IV.
D. Process Flow of Implementation and System Specifications
[image:4.595.307.545.107.223.2]The implementations are carried out on system having Ubuntu 16.04 LTS (64-bit) operating system, 8 GB Memory and Intel Core i7-7700 processor.
Fig. 3. Implementation process flow.
The graph databases used are Neo4j (version: 3.5.0), ArangoDB (version: 3.4.0) and OrientDB (version: 3.0.11). The implementation framework is presented in Fig. 3 with all operational stages and their details.
IV. PERFORMANCEEVALUATION
The performance of primitive indexing techniques of Neo4j, ArangoDB and OrientDB is evaluated and the results are represented as three case studies in this section.
A. Neo4j
In this case study, the queries QP1 to QP7 are evaluated in Neo4j. For QL, all three data files i.e. users, tweets and hashtags are imported in Neo4j iteratively. Import process creates nodes under three distinct labels for respective files. After importing data files, relationships among the nodes are formed as per the data model described in Fig. 1. The property queries are performed to identify various influencing entities from the dataset based upon the query attributes mentioned in Table I.
For QL and QR, the response time is measured against number of records created or retrieved. As displayed in Table II, for QL, 50 nodes of users, 20757 nodes of tweets and 84908 nodes of hashtags are created. Total 1,05,715 nodes are created in , milliseconds. In QR, 20757 TWEETS, 8817 HAS_HASHTAG and 8817 USED_HASHTAG relations are created. Total , relations are created in 333
milliseconds. For relation TWEETS, number of created relations are large compare to relations HAS_HASHTAG and USED_HASHTAG. Number of relations created depends on number of records in two interrelated data files.
Table II. Query performance in Neo4j
Query Type Query ID No. of Records Created /
Retrieved Time (ms)
QL
QL1 50 368
QL2 20,757 1,236
QL3 84,908 938
Total: 1,05,715 2,542
QR
QR1 20,757 77
QR2 8,817 108
QR3 8,817 148
Total: 38,391 333
For QL, the time varies irrespective of number of records created in Neo4j depending upon the cardinality of each data file. For QR1, high number of records are created in less time compare to QR2 and QR3; while for same number of records created, response time of QR3 is high compare to QR2. Response time increases as the number of data files as well as the cardinality of each data file increase across which the relation spans.
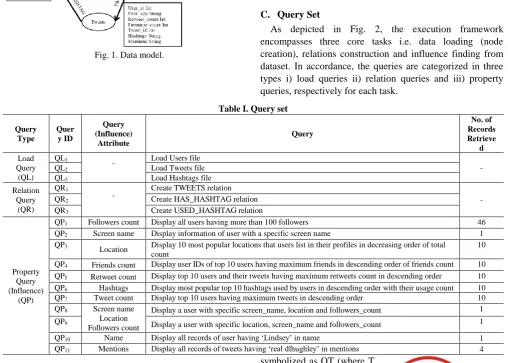
Experiment I: Schema Index
For the second phase of analysis, schema indexes are constructed on attributes mentioned in Table I for queries QP1 to QP7. The index construction time for each index is constant and approximately one millisecond. The queries are executed with created indexes and the response time is measured. The response time varies for different queries depending upon the number of data files and the cardinality of each data file
[image:4.595.45.289.298.436.2]across which the relation spans.
Fig. 4. Performance of schema index in Neo4j
The results are presented in Fig. 4. For each query, the response time is marginally high with schema index compare to no index. Creating and using schema index cost overhead in terms of time complexity while the link based internal storage of Neo4j works efficiently without any explicit indexing. B. ArangoDB
In this case study the query set is evaluated in ArangoDB. It is evident from Table III that for QL, total , , nodes are created in , milliseconds. For QR, Total , relations are created in , , milliseconds.
The observations about response time and data file cardinality in Neo4j hold in the case of ArangoDB also. Table III. Query performance
[image:4.595.304.546.348.559.2]Query
Type Query ID
No. of Records
Created / Retrieved Time (ms)
QL
QL1 50 4,772
QL2 20,757 4,825
QL3 84,908 5,437
Total: 1,05,715 15,034
QR
QR1 20,757 1,289
QR2 8,817 14,09,032
QR3 8,817 70,397,127
Total: 38,391
Like in Neo4j, in ArangoDB also response time increases as the number of collections and cardinality of each collection increase across which the relation spans.
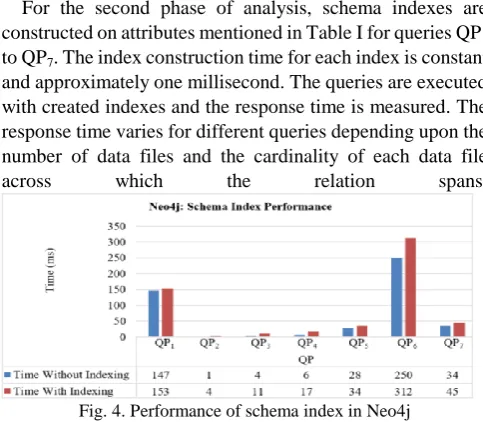
Experiment I: Skip list Index
Queries QP3 and QP4 are evaluated with skiplist index on attributes mentioned in Table I. The analysis is done i) without indexing ii) with skiplist indexing iii) with sparse skiplist indexing. Sparse skiplist indexing outperformance first two kinds as it excludes NULL attributes in indexing which fastens the query processing as shown in Fig. 5 (a). Further, for QP5, apart from skiplist index on ‘retweet_count’, hash index on ‘user_id’ in tweets collection is created. This combination outperforms sparse skiplist indexing on single attribute due to the unique constraint of user_id. Subsequently, multiple sparse skiplist indexes on attributes ‘retweet_count’ and ‘user_id’ in tweets collection are created. For QP5, multiple sparse skiplist indexing outperforms as shown in Fig. 5 (b). Creating multiple sparse skiplist indexing greatly decreases the search space compare to previous cases which in turn reduces the time complexity of retrieval process.
(a)
(b)
Fig. 5. Performance of skiplist index in ArangoDB (a) single skiplist; (b) multiple skiplist.
Experiment II: Hash Index
To evaluate the hash indexing of ArangoDB, for QP1 to QP3, QP5 and QP6 hash index is created on query attributes mentioned in Table I.
The results achieved are shown in Fig. 6. For every query performed with hash index on its attribute, the sparse hash index outperforms simple hash indexing. As sparse hash index eliminates the records having documents in which at
[image:5.595.46.290.50.167.2]least one of the index attributes is not set or has NULL value, it fastens the retrieval process. For the next experiment, query QP5 with multiple sparse hash indexes on attributes ‘retweet_count’ and ‘user_id’ is executed. Results show that multiple sparse hash indexing outpaces single sparse hash indexing as multiple unique constraints reduces the search space. Here for the results of hash index, two different graphs are shown in Fig. 6 due to the drastic difference in response time of queries.
Fig. 6. Performance of hash index in ArangoDB.
[image:5.595.307.545.276.380.2]To exploit hash-based indexing further, composite hash index is created on properties mentioned in Table I for queries QP8 and QP9.
Fig. 7. Performance of composite hash index in ArangoDB.
The queries are executed with composite hash index i) in order of indexing attributes ii) in random order of indexing attributes. It is evident that query that executed in order of the attributes on which index is created has less response time. In first case, the sparse composite hash index outperforms regular composite hash index as shown in Fig. 7.
Experiment III: Fulltext Index
[image:5.595.49.289.432.647.2]To evaluate the performance of fulltext index, queries QP10 and QP11 are executed with fulltext index on attributes mentioned in Table I.
Fig. 8. Performance of fulltext index in ArangoDB.
Fulltext index performs great over sequential scan as mentioned in Fig. 8. Other advantage of using fulltext index on attributes having textual content is for given a single word in query search, it results
[image:5.595.308.546.591.697.2]containing that word as a part. C. OrientDB
[image:6.595.304.543.50.163.2]For the analysis with OrientDB, Neo4j graph of our data are directly imported using Neo4j importer into OrientDB.
Table IV. Query performance in OrientDB
Query Type
No. of Records Created / Retrieved
Time (ms)
QL 1,05,715 14,000
QR 38,391 14,000
While importing the graph from Neo4j to OrientDB, the import process gives the cumulative time to import all nodes and all the relations rather than single file import time. The cumulative time to import all nodes and all relations is 14,000 milliseconds each as shown in Table IV.
Experiment I: Hash Index
Firstly, simple non-unique hash index is created on each query attribute mentioned in Table I. The non-unique index allows duplicate records. For all property queries, response time with hash index outperforms sequential scan. Then, unique composite hash index is created on attributes:
‘screen_name’, ‘location’, ‘followers_count’,
[image:6.595.50.286.377.479.2]‘friends_count’, retweet_count’ in order. The latter case gives less response time for almost all queries as shown in Fig. 9.
Fig. 9. Performance of hash index in OrientDB.
Experiment II: SB Tree Index
[image:6.595.305.543.455.560.2]As the first experiment with hash index, same testing is carried out for SB tree index. According to the results achieved and depicted in Fig. 10, composite SB tree index outperforms both simple SB tree and sequential scan for majority of the queries due to the unique constraint expediency.
Fig. 10. Performance of SB tree index in OrientDB.
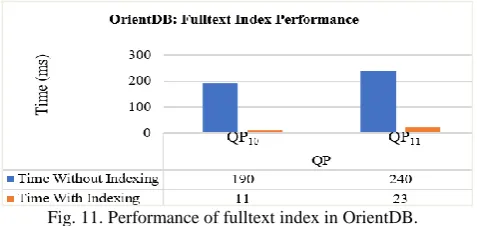
Experiment III: Fulltext Index
To evaluate the performance of fulltext index, fulltext indexes on attribute ‘name’ in users collection and attribute ‘mentions’ in tweets collection are created.
For queries mentioned in Fig. 11, fulltext index performs great over sequential scan for attributes containing textual values in graph.
Fig. 11. Performance of fulltext index in OrientDB. D. Comparative Analysis
[image:6.595.47.285.581.692.2]In this section, the performance of Neo4j, ArangoDB and OrientDB is compared for three types of queries i.e. load query, relation query and property query as mentioned in Table I. The analysis and comparisons are performed on time complexity of data retrieval process. For social media based highly interactive applications, the response time of query is as crucial as the accuracy of query result. Performing and analyzing various primitive indexing of different graph databases help in determining which index and which database is suitable to handle highly connected data while maintain the query accuracy along with query response time. Apart form query response time, the time to load data into graph database and to form relation among them are significant for the whole application. Thus, in this analysis, the data loading time, relation creation time and query response time of property queries are compare for three leading graph databases.
To load total 1,05,715 nodes, Neo4j takes significantly less time compare to ArangoDB and OrientDB as depicted in Fig. 12.
Fig. 12. Performance comparison for load queries.
For relation query, to formulate total 38,391 relations, again Neo4j performs superior compare to ArangoDB and OrientDB as shown in Fig. 13. The Y-axis is represented as the logarithmic scale of time in Fig. 12 and Fig. 13.
Fig. 13. Performance comparison for relation queries.
[image:6.595.303.548.629.822.2]based inherent storage structure which makes them less efficient for property graph data, which results into high time complexity for loading data in form of nodes and relations. Though, ArangoDB and OrientDB are less efficient for load and relation queries in graphs compare to Neo4j, as the Neo4j graph is directly imported into OrientDB using importer, the performance of OrientDB is improved over ArangoDB.
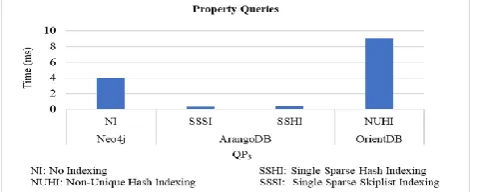
The performance of primitive indexing of Neo4j, ArangoDB and OrientDB is compared with respect to two cases of property queries. In both the cases, for every indexing type, the most efficient indexing from each case study is considered for better comparison.
[image:7.595.49.288.300.396.2]For case I, the comparison is performed for the query QP3 which involves only single attribute indexing on nodes under a single label. As an example, sparse hash index on property ‘friends_count’ of nodes having label users. In such scenario, as shown in Fig. 14, ArangoDB with skiplist index and hash index outperforms the primitive indexing of OrientDB and non-indexed Neo4j. The observation holds for every property query of same kind.
Fig. 14. Performance comparison of property queries for case I.
For case II, the query QP5 is considered which involves indexing on multiple attributes of connected nodes. As an example, index on two attributes ‘user_id’ and ‘retweet_count’ of two respective nodes users and tweets which are connected with the relation TWEETS. Fig. 15
demonstrates the achieved results.
Fig. 15. Performance comparison for property queries for case II.
For case II, Neo4j without index outperforms other databases, whereas OrientDB with composite hash index outperforms ArangoDB. Here, composite index is considered as a special case of index on multiple attributes. An efficient traversal mechanism of Neo4j significantly reduces the time complexity of retrieval when the property query spans across multiple relations.
V. CONCLUSIONANDFUTUREWORK
Three most popular graph databases i.e. Neo4j, ArangoDB and OrientDB are evaluated in this research. The evaluation is performed for ‘Russian Troll Tweets’ dataset, with an intention to identify the entities such as hashtags, users, locations and tweets from original data that have major influence in spreading trolls. The goal is to retrieve such data,
by the means of property queries, with precision and less time complexity. To achieve the goal, the constructed property query set is evaluated with distinct indexing techniques supported by each graph database. The evaluation results show that, for Neo4j, the query performance is efficient without using any indexing as the latter case degrades the performance. In ArangoDB, for single attribute index under single node label, sparse hash and sparse skiplist index work efficiently among all kinds. Whereas for multiple attribute index on connected nodes, the performance is degraded. In OrientDB, unique composite sparse hash index outperforms for property queries on connected nodes. The comparative analysis illustrations that Neo4j performs stable for load, relation and property queries whereas using indexing and Neo4j importer the efficiency of OrientDB can be improved. ArangoDB demonstrates poor performance for property queries on highly connected data.
In future, we aim to evaluate our analysis on big social network data, leveraging the parallel query processing services in order to analyze the effectiveness of indexing provided by distributed graph databases, on various other datasets for complete comparison.
REFERENCES
1. R. Hecht and S. Jablonski, “NoSQL evaluation: A Use Case Oriented Survey”, in Proceedings of the International Conference on Cloud and Service Computing, 2011, pp. 336-341.
2. T. Petkova, “Why Graph Databases Make a Better Home for Interconnected Data than the Relational Databases”, January 6. Available:https://ontotext.com/graph-databases-interconected-data-rela
tional-databases/ [Accessed: June 11, 2018].
3. S. Ma, J. Li J, C. Hu, X. Lin X, J. Huai, “Big graph search: Challenges and Techniques, Frontiers of Computer Science, Vol. 10, No. 3, 2016, pp. 387–398.
4. D. K. Singh and R. Patgiri, “Big Graph: Tools, Techniques, Issues, Challenges and Future Directions”, in 6th International Conference on Advances in Computing and Information Technology (ACITY 2016),
Chennai, India, July 2016, pp. 119–128.
5. A. Silberschatz, H. F. Korth and S. Sudarshan, "Indexing and Hashing”, in Database System Concepts, 6th ed., New York: McGraw-Hill, 2011,
pp. 475-527.
6. L. Ciglan and A. Averbuch, “Benchmarking Traversal Operations over Graph Databases”, in th
International Conference on Data Engineering Workshops, IEEE, 2012.
7. G. Graefe, “Query Evaluation Techniques for Large Databases”, ACM Computing Surveys, Vol. 25, No. 2, June 1993, pp. 73-170.
8. S. Sakr and G. Al-Naymat, “Graph Indexing and Querying: A Review”,
International Journal of Web Information Systems, Vol. 6, No. 2, 2010, pp. 101-120.
9. O. Batarfi, R. El Shawi, A. G. Fayoumi, R. Nouri, A. Barnawi and S. Sakr, "Large Scale Graph Processing Systems: Survey and An Experimental Evaluation", Cluster Computing, Vol. 18, No. 3, 2015, pp. 1189-1213.
10. H. Dinari, “A Survey on Graph Queries Processing: Techniques and Methods”, International Journal of Computer Network and Information Security, 2017, pp. 48-56.
11. C. Park, “Reducing Redundancy in Keyword Query Processing on Graph Databases”, Journal of Information Science and Engineering, Vol. 34, No. 2, 2018, pp. 551-574.
12. A. Patel and J. Dharwa, “Graph Data: The Next Frontier in Big Data Modeling for Various Domains”, Indian Journal of Science and Technology, Vol. 10, No. 21, June 2017, pp. 1-7.
13. S. Agrawal and A. Patel, “A Study on Graph Storage Database of NoSQL”, International Journal on Soft Computing, Artificial Intelligence and Applications (IJSCAI), Vol. 5, No. 1, February 2016, pp. 33-39.
Surveys (CSUR), Vol. 40, No. 1, February 2008, pp.1-39.
15. R. K. Kaliyar, “Graph Databases: A survey”, in International Conference on Computing, Communication and Automation (ICCCA),
July 2015, pp. 785-790.
16. S. A. T. Mpinda, L. C. Ferreira, M. X. Ribeiro and M. T. P. Santos, “Evaluation of Graph Databases Performance Through Indexing Techniques”, International Journal of Artificial Intelligence & Applications (IJAIA) Vol. 6, No. 5, September 2015, pp. 87-98. 17. R. Angles, "A Comparison of Current Graph Database Models", in 28th
International Conference on Data Engineering Workshops, IEEE, 2012, pp. 171-177.
18. D. Fernandes, and J. Bernardino, “Graph Databases Comparison: AllegroGraph, ArangoDB, InfiniteGraph, Neo J, and OrientDB”, in
Proceedings of the 7th International Conference on Data Science, Technology andApplications, Porto, Portugal, 26–28 July, 2018, pp. 373–380.
19. P. Jadhav and R. Oberoi, “Comparative Analysis of Different Graph Databases”, International Journal of Engineering Research and Technology, Vol. 3, No. 9, September 2014, pp. 820-824.
20. S. Jouili and V. Vansteenberghe, “An Empirical Comparison of Graph Databases” in SocialCom, IEEE, 2013, pp. 708–715
21. D. S. Rawat and N. K. Kashyap, “Graph Database: A Complete GDBMS Survey”, International Journal for Innovative Research in Science & Technology, Vol. 3, No. 12, May 2017, pp. 217-226.
22. A. Romano, “The Massive Data Dump Reveals How Trolls Disrupt and Destabilize Local and Global Politics”, October , . Available: https://www.vox.com/2018/10/19/17990946/twitter-russian-trolls-bots
-election-tampering [Accessed: March 13, 2019].
AUTHORSPROFILE
Mitali Desai received her M.E. degree in the Computer Engineering Department at Sarvajanik College of Engineering and Technology, Surat. She is pursuing her Ph.D. in Computer Engineering at Sardar Vallabhbhai National Institute of Technology (SVNIT), Surat. Her research areas are Data Mining, Web Mining, Social Network Analysis and Big Data Analytics.
Rupa G. Mehta is an Associate Professor in the Computer Engineering Department at Sardar Vallabhbhai National Institute of Technology (SVNIT) in Surat. She received her Ph.D. degree in Computer Engineering from Sardar Vallabhbhai National Institute of Technology in 2015. Her research interest mainly focusses on Database Management Systems, Advance Data Structure, Data Mining, Big Data Analytics and Fuzzy Classification Discretization.