International Journal of Innovative Technology and Exploring Engineering (IJITEE) ISSN: 2278-3075, Volume-8 Issue-10, August 2019
Abstract: With the rapid development of IoT devices, security risks become clearer in smart houses with the emergence of more types of IoT Botnet. With the development of machine learning technology applied to dynamic analysis methods, the automatic detection of variations of IoT Botnet has many achievements. However, there are still some difficulties such as building Sandbox suitable for IoT Botnet with specific chip architectures, collecting full of malicious behavior, imbalance in dataset,... affecting the accuracy of the learning model. In this paper, the authors introduce method of detecting IoT Botnet through system call of executable file to address some difficulties mentioned above. We edit sandbox environment based on QEMU to collect more monitoring data and focus to system calls behavior of malware. By using the CNN network architecture combined with One-class classification and features extracted from the system call graph, the authors have built a IoT Botnet detection model with an accuracy of up to 97% and F-measure 98.33%.
Index Terms: IoT Botnet; One-class CNN classification; System call graph.
I. INTRODUCTION
Internet of Things (IoT) is one of the trends of the 4.0 technology revolution, it not only changes the view of technology but also brings many utilities, based on connects together. According to Cisco forecasts, by 2020 there will be about 50 billion devices connected to the Internet, even this number is even more increased[1]. The number is increasing, IoT devices gradually become an attractive and popular environment for hackers to attack and attack. The objective of the attacks is not only for individuals but also for businesses, units and organizations with increasing nature and severity. In the world, many studies have shown the danger from malicious code on IoT devices such as: Bashlite, Mirai, Tsunami, Psyb0t [2]. In particular, with more than 1 million infectious devices including IP cameras, DVRs and routers, Bashlite malicious code can launch DDS attacks up to 400 Gbps through simple techniques like UDP or TCP Flood [2]. This represents a dramatic change in the composition of the Botnet networks that we have met in the past. Bashlite malicious code is considered the precursor to
Revised Manuscript Received on August 7, 2019
Hai-Viet Le, Department of Information Technology and Information Security, People’s Security Academy, Hanoi, Vietnam.
Quoc-Dung Ngo, Department of Information Technology, Posts and Telecommunications Institute of Technology, Hanoi, Vietnam.
Van-Hoang Le, Graduate People's Security Academy, Department of Information Technology and Information Security, People’s Security Academy, Hanoi, Vietnam.
Mirai, the malicious code affects a wide variety of IoT devices. Mirai's Botnet network used in DDoS attacks reaches a record of 1.1 Tbps with more than 100,000 IoT devices for home use [3]. In response to these risks, researchers have been developing new methods and techniques to detect malicious code on IoT devices [4][5][6][7][8][9][10]. These studies can be divided into two main groups: static analysis [4][5][7] and dynamic analysis [6][8][9][10].
Static analysis method allows detailed control of the control flow (CFG) and data flow (DFG) to detect malicious code by specific analytical techniques such as byte code, system calls API or Printable- Strings-Information (PSI) [7]. This method allows detailed analysis of files and gives the activation capabilities of malicious code [11]. However, the static analysis method is difficult to apply to malicious code using complicated techniques (obfuscation) or difficult to collect samples because malicious code only stores on the device's RAM [1]. According to Andreas Moser [12], the static analysis method should be used as a complement to the dynamic analysis method.
Dynamic analysis is a method of monitoring, collecting and analyzing system behavior to detect malicious code [13]. This technique uses a set of rules that are considered normal to check whether the program intentionally violates these predetermined rules. In using dynamic analysis techniques there are many methods, but the most popular approach today is to use machine learning/deep learning technology. When using machine learning/deep learning technology, data and corresponding data labels are required to serve the training process to create a suitable learning model, with high accuracy forecasts. In addition, the important requirement for dynamic analysis is to build a fully simulated environment (sandbox) of the necessary functions of the analyzed device and be able to monitor the behavior of malicious code when executing and avoiding all infections of actual field tissue. All data collected from the Sandbox plays an important role in the accuracy of detecting malicious code. However, collecting benign files is not trivial compare to malware sample. There exists a lot of malware sample databases such as IoTPot or Detux etc. Therefore, there is a bias in the data set for training machine learning models when applied to sandbox environments. Therefore, to solve the above problem, the authors select the method of One-class classification. One-class classification is a method of determining patterns of a specific class, by training on a set that only contains samples of that class [14]. In the problem of detecting malicious code, this method will determine whether a sample is in the malicious code (or benign layer). With the problem of
Iot Botnet Detection Using System Call Graphs
and One-Class CNN Classification
detecting malicious code, one-class classification will play the role of supporting 2 main methods which are static and dynamic analysis. With One-class classification used in static analysis, Justin Sahs and Latifur Khan have presented a model of One-class SVM machines that detect malware on Android devices [15]. The featured from the permissionand control flow graph is extracted and coaching on One-class SVM model in an offline (off-device) manner from APK file, in order to leverage the higher computing power of a server or cluster of servers. However, applying this model to real-time detection with flow control charts is a big challenge.To solve the problem of real-time Botnet detection, dynamic methods using One-class classification have been proposed.
In dynamic analysis, Laskov et al. [16] proposed an IDS model using a quarter-spherical SVM, optimized for non-negative attributes with one-sided distribution, as a variant of the One-class SVM with 75% accuracy for KDDCup 1999 data set.Song et al.[17] also proposed an anomaly detection method based on clustering and multiple one-class SVM to improve the detection rate (with 85%) while maintaining a low false positive rate below 3%. Based on dynamic method, Miao [18] and colleagues proposed methods for detecting malicious code on the Windows operating system platform. This study uses One-class support vector machines (SVM) to classify malicious codes based on system calls. Similarly, Burnaev [19] and colleagues applied a One-classSVM classification to detect malicious code on the Windows platform, based on features extracted from n-grams, reaching the above detection rate 80%.
The above methods have good accuracy and are applicable to malicious code on Windows platform. For malicious code on IoT devices, it has its own characteristics and is different from normal malicious code on the Windows platform, so the application of the above methods will not make good results. Moreover, these studies are quite old and have not taken advantage of the advantages, as well as the development of deep learning in recent years. Therefore, to solve a class classification problem in order to detect botnet on IoT devices, in this paper,we use dynamic analysis methods combined with One-class classification. The main approaches of this method include as follows: Using deep learning as a deep feature extraction technique (deep features), to pre-process data, as input to traditional class classification methods like a one-class SVM or Support Vector Data Description (SVDD).The contributions of our paper are as follows:
We propose an approach that uses the One-class CNN to detect IoT Botnet.
Edit Sandbox environment based on QEMU to collect more monitoring data.
Provide deep features based on the structure of the system call as input for the One-class classifier.
We evaluate the approach for IoT Botnetwith an accuracy of up to 97.22% and F-measure 98.33%.
The structure of this paper is as follows: Section 2 discusses the proposed method, an overview of our IoT Botnet detection system, system call Graph construction and classification algorithms used in experiments. The system evaluation is presented in Section 3 whose results are interpreted and commented in the same section. Section 4 concludes our achievements, future works and summarizes
our results.
II. THE PROPOSED APPROACH
In this section we describe the design of various components that proposed approach, and our motivations for such an architectural design.
A. Overview
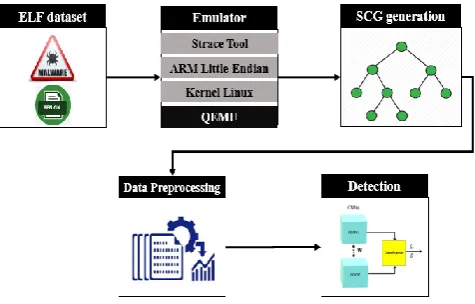
[image:2.595.307.545.181.333.2]This section is used to describe the main components of the proposed approach and their functions. An overall view of this approach is shown in Figure 1.
Figure 1. Model overview of the proposed method
The proposed approach consists of four main components which are Emulator, System call graph generation, Data preprocessing, Detection Botnet module. In the first step, the ELF file is put into execution in emulated environments, based on QEMU[20] and Aurel's image for the ARM chip architecture. Special thanks to Aurel who has uploaded pre
built QEMU Debian VM images for ARM
architectures[21].We integrate into this virtualization field an agent based on the source code of the Strace tool[22] for collecting system call logs.During the experiment, we compared the results of system call collection of different sandboxes (Cuckoo, Detux,...) with our sandbox environment. The comparison results show that for our edited IoT Botnet sandbox environment is more effective in collecting system calls.Next, the unnecessary instructions are deleted from the system call log by a simple data pre-processor. After that, we have a clear system call log comprising only needed instructions to construct system call graph (SCG). Next, the system call graph of input ELF-file is generated by this cleared system call log. Because the classification algorithm implementation on these graphs is very complicated and takes a lot of time, we convert these graphs into a set of vectors (i.e a vector for each graph).These graphs are quite significant, so the vectors varying from graphs are too large as well. A feature extraction algorithm is employed to reduce the size of these vectors. After the feature extraction, a subset of these vectors is used as training set to construct the learning model by One-class classification. A detection module uses this learning model to realize the input file is malware or benign. In the following parts of this section, SCG construction and learning model are described by detail.
B. IoT Botnet life cycle
International Journal of Innovative Technology and Exploring Engineering (IJITEE) ISSN: 2278-3075, Volume-8 Issue-10, August 2019
analyzing the characteristics of IoT Botnets such as Bashlite,Wifatch, Mirai,Remaiten [3], we recognize many similarities such as different stages in the life cycle and actions of IoT Botnet in the that stage. Based on the above mentioned IoT Botnet analysis, we have identified five separate stages in the IoT Botnet life cycle: Scanning for the appropriate target, Attacking the target, Infecting, Connecting with C&C server, Execute commands from Botmaster, Upgrade and maintenance. At the first stage of the life cycle, a common behavior of IoT Botnets is to scan IoT devices, which often contain security vulnerabilities that can be infected. This is usually done by simple network scanning techniques with commonly targeted service ports like Telnet (port 23, 2323), SSH (port 22),... Next, when a device is detected IoT is potentially infectious, these malicious code carry out a hijacking attack in different ways such as: dictionary attacks, brute-force attacks, exploit known security holes (like CVE-2014-9222 "Misfortune Cookie" bug on routers using standard TR-069, TR-064), ... After gaining control of the device, they will proceed to download the necessary executable files and proceed with the installation. in the device. At the 4th stage will include activities that attempt to connect to the Command and Control (C&C) server to receive commands from the Botmaster. The next stage is the period of showing malicious behavior from the required commands of Botmaster. The final stage is upgrade and maintenance. This stage serves for the Botmaster to monitor the effectiveness of infected devices and update new versions of malicious code.
C. Collection system call log
A representative trace system calls log must show some malicious behavior for our algorithm to detection. If there are no difference between the executions of the malware and of the benign programs, then no malicious behavior can be detected. In practice, getting the IoT Botnet to be malicious is not difficult, as most IoT Botnet tries to connect, communicate with C&C server; try to infect other IoT devices by scanning IP and attacking service ports like Telnet, SSH, FTP [2]. The traces are collected by passively monitoring the execution of each program in a contained environment that is similar to an IoT device fully connected to the Internet. This emulated environment is built on the QEMU platform and the Aurel's image for ARM chip architecture. Dynamic analysis method is applied to this proposed approach to aim to collect system call log. ELF file templates are implemented in the emulated environment and record the system call behavior using the built-in agent from Strace tool source[22].With system calls recorded, the behavior of Botnet malware is exposed as if trying to connect to C&C server; detect other devices via open service ports such as SSH, Telnet, FTP.A system call log segment collected from the ELF file is illustrated in Figure 2.
Figure 2. Trace system call when executing ELF file D. System call Graph construction
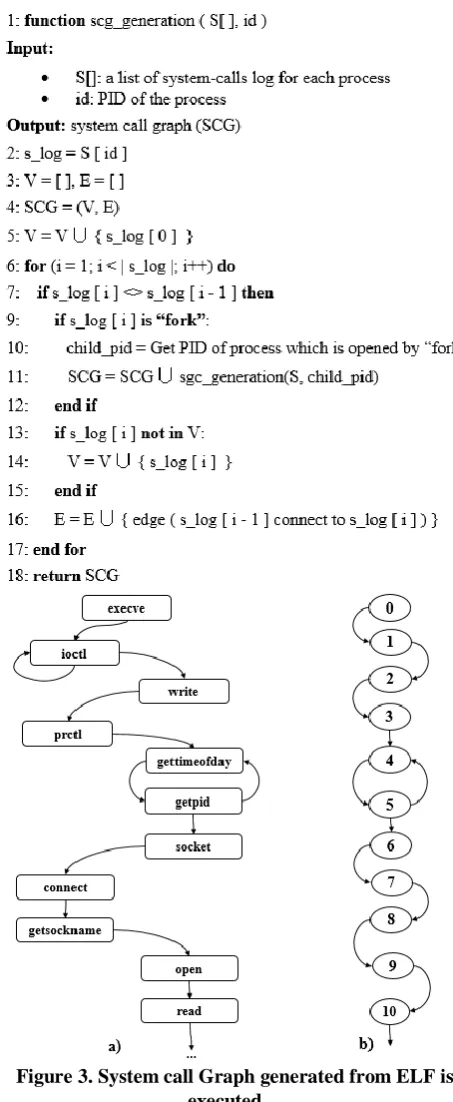
We now describe in detail the SCG generation algorithm introduced in Section 2, with emphasis on the collection trace system call and building SCG algorithm. First, we use system call graph defined as follows:
DEFINITION 1 (SCG). A system call graph is a directed graph with nodes labeled using system call from an alphabet
set of system calls and labeled edges represent the
relationship between two consecutive system calls.
Formally, the system call graph SCG is written SCG = (V,E,,), where:
V is the set of vertices and E is the set of edges,
EV×V,
associates vertices with symbolic system calls,
:V×2Vars,
associates constraints with nodes and edges,
:VE.
For a node in Vwith label L = (),let us denote by L both the node and its system call label when the context allows it unambiguously. We write n1, n2 Efor an edge from node n1to node n2in the system call graph. The two vertices will be connected by the edge e Ewhen two system calls corresponding to these two vertices appear consecutively during the ELF file being executed.An example of a system call graph is illustrated in Figure 3 (b). This SCG generation algorithm is based on dynamic analysis techniques that use execution traces obtained by running malware and benign ELF file in emulated environments. The inputs to the algorithm are a set of malware and benign programs. Pseudo-code for SCG generation is given in Algorithm 1.
Figure 3. System call Graph generated from ELF is executed
E. One-class CNN network
[image:4.595.315.544.56.202.2]The authors used the characteristic system call graph (defined in Section 2) as input to the learning model training process. This dataset is divided into two sub-data sets: the target data set (target dataset - T) contains only IoT Botnet patterns and reference data sets (reference dataset - R) containing both IoT Botnet and benign. These two sets of data are trained by the weighted convolution neural network as shown in Figure 4.
Figure 4. Overview architecture of the proposal neural network
Before introducing details of the proposed one-class CNN network, the authors define some necessary functions in building and selecting the following functions[23]:
Compactness loss: The authors define the loss function lC to represent the convergence or concentration of the target set (target dataset). Through this loss-based learning function, neural networks are able to show the similarity of a sample to the target data set. The function lC calculates the average distance between data points in a given set. The authors use a variety of distances for this function such as the distance Manhattan, Euclidean or Cosine in the experiment to find the most optimal function for the training process. Define X = {x1, x2,…, xn} Rn × kto be the input to the loss function,
where the batch size of the input is n and xi = (xi1, xi2,.., xik). Forward Pass: For each ith sample xiRk, where 1 in, the distance between the given sample and the rest of the samples zi can be defined as: zi = xi - mi where,
is the mean of rest of the samples. Then, compactness loss lCis defined as the average Euclidean distance as in,
Descriptiveness loss: The loss function lDis calculated from the reference dataset that evaluates the classification in this dataset showing the classification of the network. Through learning, neural networks are able to classify different characteristics in the dataset. The classification can be calculated using common loss functions commonly used in traditional CNN network models. Here the authors use cross-entropy loss functions [24] to play this role.
International Journal of Innovative Technology and Exploring Engineering (IJITEE) ISSN: 2278-3075, Volume-8 Issue-10, August 2019
and the reference network will calculate the classification lD. Since then the loss function used to optimize the model is calculated by the following formula:
In which, λ is a super parameter that represents the priority of two component functions in calculating the loss function. A large λ value indicates that the classification process is not as important as the convergence of the malicious data set. In this paper, the authors experiment with λ = 0.1 and achieve high detection results.
III. EXPERIMENT RESULT
This section describes the environment configuration and evaluation of test results. For experiment, the authors use CPU Intel Core i5-8500, 3.00 GHz with 16GB RAM and Nvidia GPU GTX 1070Ti 8GB. The dataset contains 600 ELF sample, which consists of 503 malicious files and 97 benign files. The botnet samples were collected from VirusShare and IoTPOT[25]. The benign samples were collected from the firmware of IoT devices such as Router and IP Camera. During the experiment, the authors used loss function l = lD + λlC with λ = 0.1. Based on this loss function, the weights of deep neural network were customized to gain the best results.
A. Evaluation metrics
To demonstrate the ability of the proposed method, the dataset was separated into training and testing sets, containing 70% and 30% of samples respectively. We used 4 metrics which are Accuracy (Acc), Precision (Pre), Recall (Rec), F-measure to evaluate the performance of this proposed method. We also used False Positive Rate (FPR) and False Negative Rate (FNR) as metrics because of the imbalance between malware set and benign set. These metrics are defined and calculated with the following standard formulas:
Acc = (TP + TN)/(TP + TN + FP + FN)
Pre = TP/(TP + FP)
Rec = TP/(TP + FN)
F-Measure = (2 * Pre * Rec) / (Pre + Rec)
FPR = FP/(FP + TN)
FNR = FN/(FN + TP)
Therein:
TP - True Positive: indicating that malware samples are correctly predicted.
TN - True Negative: indicating that benign samples are correctly predicted.
FP - False Positive: indicating that benign samples are incorrectly predicted as malware.
FN - False Negative: indicating that malware sample are incorrectly predicted as benign.
B. Results
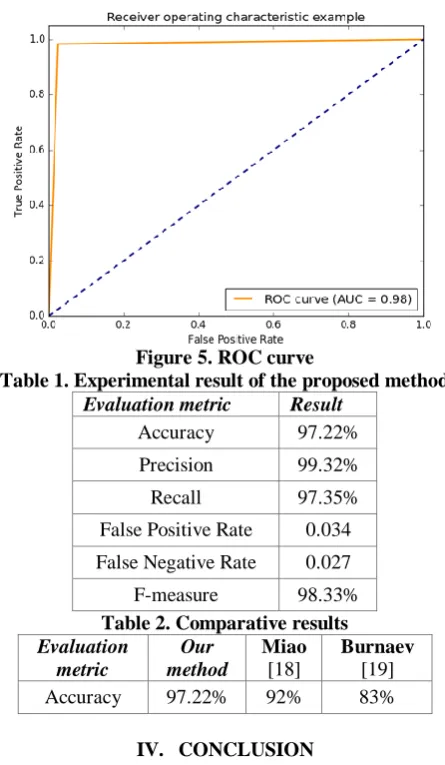
[image:5.595.314.537.56.439.2]Experimental results with the value of evaluation indicators are presented in Figure 5 and Table 1.Our results when compared with other methods are presented in Table 2.
Figure 5. ROC curve
Table 1. Experimental result of the proposed method Evaluation metric Result
Accuracy 97.22%
Precision 99.32%
Recall 97.35%
False Positive Rate 0.034
False Negative Rate 0.027
F-measure 98.33%
Table 2. Comparative results Evaluation
metric
Our method
Miao
[18]
Burnaev
[19]
Accuracy 97.22% 92% 83%
IV. CONCLUSION
In this paper, the authors propose method to detect Botnet activity on IoT devices. This method is based on neural network classification of a class convolution and characteristic system call graph. With the experimental results 97.22% accuracy and F-measurement 98.33% reached, the authors have demonstrated the effectiveness of the proposed method. However, the initial results only apply on IoT botnet file but not yet expanded with other malicious lines on IoT device. In the future, the authors will apply the proposed method for data sets including more malicious codes to increase accuracy and applicability in ensuring information security and safety on IoT devices.
ACKNOWLEDGMENT
Thanks to the BH.2016.T31.04 project and People’s Security Academy Vietnam for supporting us in the process of studying this issue.
REFERENCES
1. D. Evans, “The internet of things: How the next evolution of the internet is changing everything,” CISCO white paper, vol. 1, no. 2011, pp. 1–11, 2011.
3. E. Bertino and N. Islam, “Botnets and Internet of Things Security,” Computer, vol. 50, no. 2, pp. 76–79, Feb. 2017.
4. C. Kruegel and Y. Shoshitaishvili, “Using Static Binary Analysis To Find Vulnerabilities And Backdoors In Firmware,” Black Hat USA, 2015.
5. P. Celeda, R. Krejci, J. Vykopal, and M. Drasar, “Embedded malware-an analysis of the chuck norris botnet,” presented at the Computer Network Defense (EC2ND), 2010 European Conference on, 2010, pp. 3–10.
6. Pavel Celeda, Radek Krejci, and Vojtech Krmicek, “Revealing and analysing modem malware,” IEEE International Conference on Communications (ICC), pp. 971–975, 2012.
7. D. Davidson, B. Moench, S. Jha, and T. Ristenpart, “FIE on Firmware, Finding vulnerabilities in embedded systems using symbolic execution.” Proceedings of the 22nd USENIX Security Symposium, 2013.
8. Andrei Costin, Jonas Zaddach, Aur´elien Francillon, and Davide Balzarotti, “A Large-Scale Analysis of the Security of Embedded Firmwares,” EURECOM, Sophia-Antipolis, Biot, France, 2014. 9. D. D. Chen, M. Egele, M. Woo, and D. Brumley, “Towards Automated
Dynamic Analysis for Linux-based Embedded Firmware,” 2016. 10. Jonas Zaddach, Luca Bruno, Aurélien Francillon, and Davide Balzarotti,
“Avatar: A Framework to Support Dynamic Security Analysis of Embedded Systems Firmwares,” Blackhat, 2014.
11. T. Ronghua, “An Integrated Malware Detection and Classification System,” MEng Chongqing Univ. BEngChangchun Univ. Sci. Technol., vol. Doctor of Philosophy, Aug. 2011.
12. Andreas Moser, Christopher Kruegel, and Engin Kirda, “Limits of Static Analysis for Malware Detection,” 23rd Annual Computer Security Applications Conference, 2007.
13. Konrad Rieck, Thorsten Holz, Carsten Willems, Patrick Düssel, and Pavel Laskov, “Learning and Classification of Malware Behavior.” Lecture Notes in Computer Science, vol 5137, 2008.
14. S. S. Khan and M. G. Madden, “A survey of recent trends in one class classification,” presented at the Irish conference on artificial intelligence and cognitive science, 2009, pp. 188–197.
15. J. Sahs and L. Khan, “A machine learning approach to android malware detection,” presented at the 2012 European Intelligence and Security Informatics Conference, 2012, pp. 141–147.
16. P. Laskov, C. Schäfer, I. Kotenko, and K.-R. Müller, “Intrusion detection in unlabeled data with quarter-sphere support vector machines,” Praxis der Informationsverarbeitung und Kommunikation, vol. 27, no. 4, pp. 228–236, 2004.
17. J. Song, H. Takakura, Y. Okabe, and Y. Kwon, “Unsupervised anomaly detection based on clustering and multiple one-class SVM,” IEICE transactions on communications, vol. 92, no. 6, pp. 1981–1990, 2009. 18. Q. Miao, J. Liu, Y. Cao, and J. Song, “Malware detection using bilayer
behavior abstraction and improved one-class support vector machines,” International Journal of Information Security, vol. 15, no. 4, pp. 361–379, 2016.
19. E. Burnaev and D. Smolyakov, “One-class SVM with privileged information and its application to malware detection,” presented at the 2016 IEEE 16th International Conference on Data Mining Workshops (ICDMW), 2016, pp. 273–280.
20. “QEMU.” [Online]. Available: https://www.qemu.org/. [Accessed: 28-May-2019].
21. “Debian Squeeze and Wheezy armel images for QEMU.” [Online]. Available: https://people.debian.org/~aurel32/qemu/armel/. [Accessed: 28-May-2019].
22. “Strace - linux syscall tracer.” [Online]. Available: https://strace.io/. [Accessed: 16-Jan-2019].
23. P. Perera and V. M. Patel, “Learning deep features for one-class classification,” arXiv preprint arXiv:1801.05365, 2018.
24. P.-T. De Boer, D. P. Kroese, S. Mannor, and R. Y. Rubinstein, “A tutorial on the cross-entropy method,” Annals of operations research, vol. 134, no. 1, pp. 19–67, 2005.
25. Y. M. P. Pa, S. Suzuki, K. Yoshioka, T. Matsumoto, T. Kasama, and C. Rossow, “Iotpot: A novel honeypot for revealing current iot threats,” Journal of Information Processing, vol. 24, no. 3, pp. 522–533, 2016.
AUTHORS PROFILE
Hai-Viet Le is currently working as lecturer in the Department of Information Technology and Information Security, People’s Security Academy, Hanoi, Vietnam. He has completed his Master degree in Computer systems and networking at Irkutsk National Research Technical University, Irkutsk, Russia (2014).
He has been doing research, application and teaching since then in the fields of network security, artificial intelligence, machine learning, and more recently in malware analysis. Currently, he is a PhD student at the University of Science and Technology, VAST, Hanoi, Vietnam.
Quoc-Dung Ngo is currently working as Lecturer in the Department of Information Technology, Posts and Telecommunications Institute of Technology, Hanoi, Vietnam. He has completed his doctoral degree in Informatics applied in automation and manufacturing at the Grenoble Institute of Technology, Grenoble, France. He has been actively participated in all the research activities. He has many books and has more than 10 research papers to his credit. He also has guest edited several edited books.His research area includes network security, malware analysis, artificial intelligence, optimal energy.