Do Map Drawing Styles Of Novice Programmers Predict Success in
Programming? A Multi-national, Multi-institutional Study.
Denise Tolhurst
University of New South Wales, Australia
Bob Baker
University of New South Wales, Australia
John Hamer University of Auckland, NZ
Ilona Box
University of Technology Sydney, Australia
Quintin Cutts University of Glasgow, UK
Michael de Raadt
University of Southern Queensland, Australia
Sally Fincher University of Kent, UK
Patricia Haden Otago Polytechnic, NZ
Margaret Hamilton RMIT University, Australia
Raymond Lister
University of Technology Sydney, Australia
Marian Petre Open University, UK
Anthony Robins University of Otago, NZ
Simon
University of Newcastle, Australia
Ken Sutton
Southern Institute of Technology, NZ
Jodi Tutty
Charles Darwin University, Darwin, Australia
Abstract
In this paper, we present the results of one aspect of a multinational, multi-institutional study of computer programming students. Specifically, this paper reports on an exploration of relationships between novice programmers’ map-drawing styles (landmark, route or survey) and success in a first programming course at tertiary level. Relationships were found between
map-Copyright © 2006, Australian Computer Society, Inc. This paper appeared at the Eighth Australasian Computing Education Conference (ACE2006), Hobart, Tasmania, Australia, January 2006. Conferences in Research in Practice in Information Technology, Vol. 52. Denise Tolhurst and Samuel Mann Eds. Reproduction for academic, not-for profit purposes permitted provided this text is included.
drawing style and success of students in introductory programming courses, but there were mediating factors that resulted in some mixed findings between the countries in which data was collected. The results of this study identify some rich areas for further exploration, and suggests how this line of research might progress.
Keywords: Navigation, way-finding, introductory programming, novice programmers
1
Introduction
representations, for example the description of a problem space as a landscape:
“…oh, that happens over there… it’s on the horizon, so I can keep an eye on it, but I don’t really need to know…” (p117)
Finding one’s way in information space has been likened to way-finding and navigation in physical space. Metaphors of getting lost, navigational links, hyperspace,
disorientation, moving up and down in text, information
landscapes, and so on are now commonplace in the literature on hypertext and the World Wide Web (McKnight, Dillon and Richardson, 1991).
In the context of programming, program code has been characterised as a virtual space – a Codespace (Cox and Fisher, 2004; Cox, Fisher and O’Brien, 2005), and many of the problems that programmers face in navigating a Codespace have been likened to those encountered when navigating physical space. While developing and in understanding program code, the programmer has to locate code segments and to move between them. Cox and Fisher stress the importance of a structural view of a program – its layout and organisation – for being able to move around a Codespace.
In a study of Novice Programmers, Mosemann and Wiedenbeck (2001) investigated whether different program navigation methods would lead to differences in program comprehension, as characterised by Biggerstaff, Mitbander and Webster (1993);
“A person understands a program when able to explain the program, its structure, its behaviour, its effects on its operational context, and its relationships to its application domain in terms that are qualitatively different from the tokens used to construct the source-code of the program.”
Mosemann and Wiedenbeck (2001) hypothesized that a sequential flow strategy ‘would lead to a fragmented bottom-up view of the program, whereas a control flow strategy would lead to a top-down, hierarchical view of a program. They found no significant difference between the two strategies on measures of program comprehension, and that novice programs were comfortable with both styles of navigation. They note that in spite of the sequential method being most natural for novice programmers, those that used a control flow strategy performed as well.
We were interested in finding whether these patterns of preferences for navigation strategies were reflected in map drawing tasks, and how these physical navigation strategies related to performance in a programming course.
1.1
Landmark, route, and survey knowledge
Werner et.al. (1997) suggest a hierarchy in acquisition of spatial knowledge, from landmark to route to survey knowledge, which they describe as follows;“Different forms and representations of spatial information can be identified in systems navigating in
complex surroundings. One of the most common distinctions in spatial navigation research concerns the difference between landmark, route, and survey knowledge of an environment. Landmarks are unique objects at fixed locations, routes correspond to fixed sequences of locations as experienced in traversing a route; survey knowledge abstracts from specific sequences and integrates knowledge from different experiences into a single model.”
A similar transitional model is suggested by Poucet (1997), who identifies three stages in building a survey representation:
1. A representation of place with local reference frames (landmarks)
2.Place representations are linked to together but retain local references (routes)
3. The reference frames for different places are changed to a common reference system (survey) We used these distinctions as a basis for coding the maps produced in the mapping task, described below.
2
Method
2.1
Coding of the map-drawing data
A map-sketching exercise was designed to assess students’ ability to articulate a simple familiar search and decision strategy effectively.
Participants were asked to carry out a mapping task in two phases; firstly to draw a map of a given area so that the researcher could get from one location to another. Participants were then asked to annotate the map with key decision points, explaining what a person using the map would need to do at the decision points. Students were given a differently coloured pen to add their annotations in the second phase.
Maps constructed in this activity were photographed or scanned electronically and the resulting images printed. These maps were then analysed for evidence one of one of the three broad navigation strategies of Landmark, Route or Survey.
Decisions about the strategy used by participants were based on identifying the following criteria in the participants’ maps:
Landmark:
• the focus of the map is key visual landmarks
(fountains, sculptures, notable buildings) which are given prominence
• landmarks are unique objects
• landmarks often exaggerated in size or distorted, or
otherwise given prominence (e.g. labelling, bolder print)
• route moves from landmark to landmark
Route:
• the focus of the map is the actual route taken
• route takes prominence, often with a path identified
• features on the route are identified Survey:
• the map focuses on an overview of the area
surrounding the route and includes detail beyond the route
• there is a focus on overall structure of the area • may include compass points
• may not have the route drawn on, or the route is not
prominent
• shows integrated knowledge of the area
Samples of map-styles and key characteristics follow.
2.1.1
Example of a landmark map
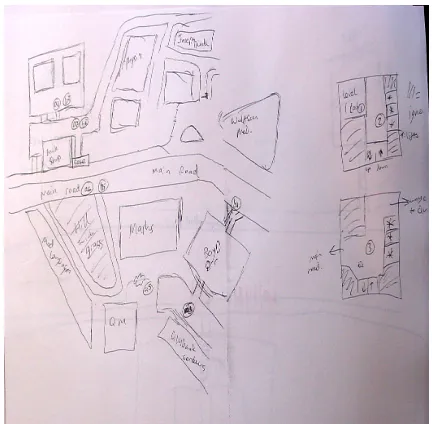
[image:3.595.314.537.70.194.2]The map in Figure 1 was characterised as using a landmark map-drawing strategy because the route is predominately identified by key landmarks on the route, for example: ‘big square cube thing’, ‘cobblestone path’, traffic lights’, etc. The focus of the map is these landmarks.
Figure 1 Example of a ‘landmark’ map-drawing strategy
2.1.2
Example of a route map
[image:3.595.80.259.312.542.2]The map in Figure 2 was characterised as using a route map-drawing strategy because the route is predominately identified by a path from the beginning to destination. The focus is on the route, with little detail provided of the surrounding area. Some landmarks are evident (the Botanical garden for example) the focus of the map is on the path to be taken.
Figure 2: Example of a ‘route’ map-drawing strategy
2.1.3
Example of a survey map
The map in Figure 3 was characterised as using a survey map-drawing strategy because the map predominately includes a survey of the surrounding area to the route. Detail goes beyond the path for the route, providing ‘survey’ information for orientation. This map shows survey information around the route to get to the required building, and also survey information of the building.
Figure 3: Example of a ‘survey’ map-drawing strategy
2.2
Strategy identification problems
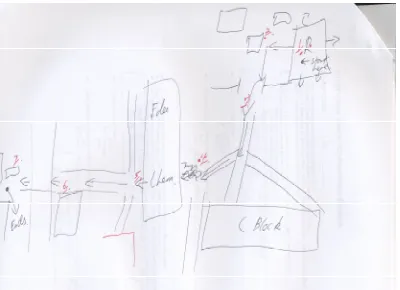
[image:3.595.317.533.333.545.2]2.3
Map-drawing strategy limited by physical
environment
[image:4.595.71.271.263.408.2]Some institution locations were such that the physical environment limited students to drawing maps that could make little use of landmarks and had little scope for providing survey information. These locations did not allow students to draw detailed orienting information that was indicative of a survey strategy. Such an institution was a campus based in a high-rise building, in a street of high-rise buildings that had a visually consistent streetscape. The task that students were effectively reduced to in this locations was ‘maze-running’, which provided no scope for including landmark information or survey detail. An example of a map from this campus is shown in Figure 5.
Figure 4: Sample of map that provided difficulties in coding – map-drawing strategy with features of both route
and survey.
The strategy to overcome the first issue, of difficulty in coding some maps, is described in the following section. Analysis was carried out on the data for all institutions, with some further analysis excluding data from those institutions where participants were restricted in the map-drawing strategies they were able to use, due to the nature of the environment they were sketching.
Figure 5 Sample of map that provided difficulties in coding – map-drawing strategy limited by physical
environment of city streets and high-rise building.
2.4
Coding of maps for reliability
Two researchers worked together on one data set and developed a coding scheme to identify the mapping strategies (landmark, route and survey). This scheme was trialled on another set of data for one institution and refined to the scheme described above in the introduction. The two researchers then independently coded the remaining maps as landmark, route and survey. The codes from the two researchers were compared with a reliability of 76% (with removal of the data for the institutions whose physical environments that caused problems, as described above). A third researcher then considered the codes that were anomalous. Ultimately the three researchers reached consensus on the final coding of the maps with originally anomalous coding.
2.5
Measurement of programming success
Final marks in the respective courses of study were taken as measures of success in introductory programming. The method of assessment in each course was determined by each institution involved and there was no assessment approach defined by the study.3
RESULTS
3.1
Descriptive Statistics
Basic descriptive statistics were calculated using SPSS V11.0 for each institution.
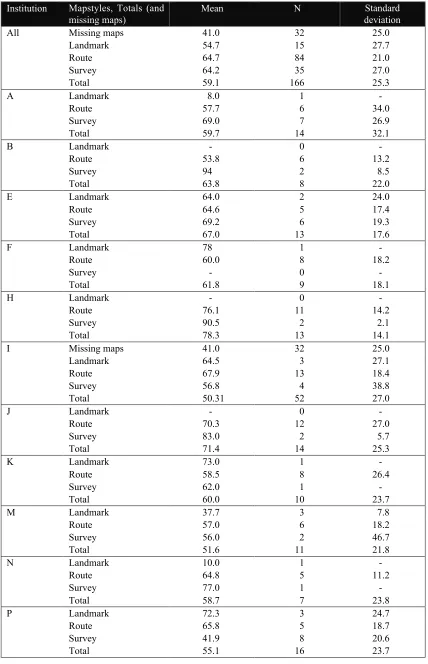
Table 1 shows means, Ns, and standard deviations as a total for each institution, and also divided according to map-drawing strategies of landmark, route and survey.
3.2
Analyses of variances
Analyses of variance using the software package SuperANOVA 1.11 indicate some statistically significant differences in the map-drawing strategies for some variables. It should be noted however that there are uneven cell-sizes for the comparison groups (see Table 1). For this reason the following ANOVA results should be interpreted cautiously.
3.2.1
Two-way analysis of variance of marks
based on map style and country
[image:4.595.97.240.543.731.2]Institution Mapstyles, Totals (and missing maps)
Mean N Standard
deviation
All Missing maps 41.0 32 25.0
Landmark 54.7 15 27.7
Route 64.7 84 21.0
Survey 64.2 35 27.0
Total 59.1 166 25.3
A Landmark 8.0 1
-Route 57.7 6 34.0
Survey 69.0 7 26.9
Total 59.7 14 32.1
B Landmark - 0
-Route 53.8 6 13.2
Survey 94 2 8.5
Total 63.8 8 22.0
E Landmark 64.0 2 24.0
Route 64.6 5 17.4
Survey 69.2 6 19.3
Total 67.0 13 17.6
F Landmark 78 1
-Route 60.0 8 18.2
Survey - 0
-Total 61.8 9 18.1
H Landmark - 0
-Route 76.1 11 14.2
Survey 90.5 2 2.1
Total 78.3 13 14.1
I Missing maps 41.0 32 25.0
Landmark 64.5 3 27.1
Route 67.9 13 18.4
Survey 56.8 4 38.8
Total 50.31 52 27.0
J Landmark - 0
-Route 70.3 12 27.0
Survey 83.0 2 5.7
Total 71.4 14 25.3
K Landmark 73.0 1
-Route 58.5 8 26.4
Survey 62.0 1
-Total 60.0 10 23.7
M Landmark 37.7 3 7.8
Route 57.0 6 18.2
Survey 56.0 2 46.7
Total 51.6 11 21.8
N Landmark 10.0 1
-Route 64.8 5 11.2
Survey 77.0 1
-Total 58.7 7 23.8
P Landmark 72.3 3 24.7
Route 65.8 5 18.7
Survey 41.9 8 20.6
Total 55.1 16 23.7
[image:5.595.51.479.56.720.2]Note: There are no missing maps for participants at institutions unless otherwise stated.
Source df Sum of Squares Mean Square F-Value P-Value Country 2 119.340 59.670 .115 .8911 MapStyle 2 731.465 365.733 .708 .4948 Country * MapStyle 4 6205.512 1551.378 3.002 .0210 Residual 125 64608.441 516.868
[image:6.595.370.472.134.239.2]Dependent: Mark Type III Sums of Squares
Table 2: Results of ANOVA of marks for the variables mapstyle and country
[image:6.595.123.224.245.347.2]Trends in the map-drawing strategies adopted by students in each institution are shown in the box-plots in Figures 4.1 to 4.13. Figure 4.1 shows the box-plot for all institutions, and Figure 4.2 shows a box-plot for all institutions except the two institutions that were problematic to code (as discussed in section 2.4).
L R S NA
0
20
40
60
80
[image:6.595.367.475.283.392.2]100 All institutions
Figure 4.1 Box-plot of map-drawing strategies for all institutions
L R S NA
0
20
40
60
80
100All institutions except F and H
Figure 4.2 Box-plot of map-drawing strategies for all institutions, except F and H
Figure 4.3 shows the box-plot for the one United Kingdom institution involved in the study, indicating a trend in which students who draw maps focusing on landmarks gain higher overall final marks, students who draw route maps gain the middle marks in the cohort and students who draw survey maps gain overall lower marks.
L R S
0
20
40
60
80
100 Institution P
Figure 4.3 Box-plot of map-drawing strategies for United Kingdom institution P
Figures 4.4 to 4.7 show the box plots for institutions in New Zealand. The box-plots for these institutions indicate a trend in the opposite direction to those found in the United Kingdom institution. Students drawing maps focussing on survey style gain highest marks, while those using a landmark style gain lowest marks.
L R S
0
20
40
60
80
100 Institution A
Figure 4.4 Box-plot of map-drawing strategies for New Zealand institution A
R S
0
20
40
60
80
[image:6.595.120.232.394.507.2]100 Institution B
Figure 4.5 Box-plot of map-drawing strategies for New Zealand institution B
R S
0
20
40
60
80
[image:6.595.360.481.443.566.2]100 Institution J
Figure 4.6 Box-plot of map-drawing strategies for New Zealand institution J
L R S
0
20
40
60
80
100 Institution K
[image:6.595.367.474.623.733.2] [image:6.595.121.225.631.736.2]Box-plots for the Australian institutions, Figures 4.8 to 4.13, show a trend consistent to that found in the New Zealand institutions, but not as strong.
L R S
0
20
40
60
80
[image:7.595.361.481.63.185.2]100 Institution E
Figure 4.8 Box-plot of map-drawing strategies for Australian institution E
L R
0
20
40
60
80
[image:7.595.116.230.106.221.2]100 Institution F
Figure 4.9 Box-plot of map-drawing strategies for Australian institution F
R S
0
20
40
60
80
[image:7.595.366.475.235.345.2]100 Institution H
Figure 4.10 Box-plot of map-drawing strategies for Australian institution H
L R S NA
0
20
40
60
80
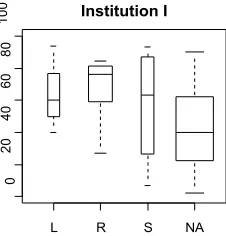
100 Institution I
Figure 4.11 Box-plot of map-drawing strategies for Australian institution I
L R S
0
20
40
60
80
[image:7.595.116.232.271.388.2]100 Institution M
Figure 4.12 Box-plot of map-drawing strategies for Australian institution M
L R S
0
20
40
60
80
[image:7.595.118.229.435.553.2]100 Institution N
Figure 4.13 Box-plot of map-drawing strategies for Australian institution
Means for each of the groups, together with the cell-sizes for the groups are shown in Table 3. The variation in cell-sizes should be noted by the reader.
Count Mean Std. Dev. Std. Error
NZ, S 12 74.917 22.781 6.576
NZ, R 31 61.798 26.463 4.753
NZ, L 2 40.500 45.962 32.500
A, S 15 67.480 27.310 7.051
A, R 48 66.401 17.123 2.471
A, L 10 52.250 25.770 8.149
UK, S 8 41.875 20.553 7.266
UK, R 5 65.800 18.727 8.375
UK, L 3 72.333 24.705 14.263
Means Table
Effect: Country * MapStyle Dependent: Mark
Table 3 Means, counts, standard deviations and standard errors for each cell in the ANOVA based on
map style and country
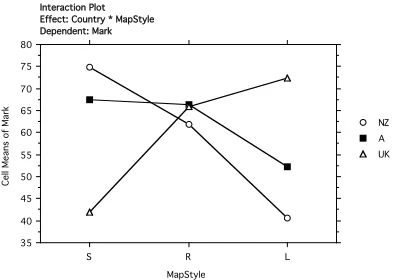
[image:7.595.309.556.441.557.2] [image:7.595.117.230.603.721.2]S R L 35
40 45 50 55 60 65 70 75 80
UK A NZ Interaction Plot
Effect: Country * MapStyle Dependent: Mark
MapStyle
[image:8.595.73.272.60.200.2]Cell Means of Mark
Figure 5 Plot of interaction between students’ map-drawing style and country of institution in which
students is studying.
3.2.2
ANOVA of map style and student
descriptions of decision points
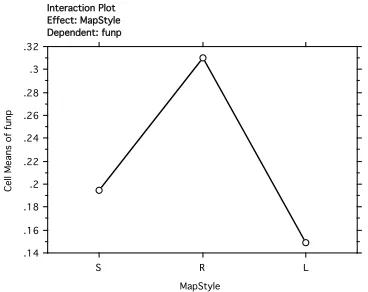
Analyses of variance were undertaken to detect differences between the map-drawing styles students adopted (landmark, route, survey) and the descriptions they used for decision points in the map-drawing exercise. Student descriptions of decision points were categorised as being based on environmental factors (what a feature looked like; e.g., large tree, big red building, etc.), as functional descriptors (in terms of the function of a building; e.g., a car-park, a coffee shop rather than the name of a feature), as a label (giving a name of a building, street, etc.), and other types of description. These categorisations were then calculated as a percentage of the total number of decision points offered by a student. Tables 4 and 5 show the results of analysis of variance based on map style and students use of environmental and functions descriptors, respectively. These ANOVAs indicate statistically significant differences between map style and environmental descriptions (p=.04) and between map style and functional descriptors (p=.02). No significant differences were found for other decision-point descriptors (label and other).
Source df Sum of Squares Mean Square F-Value P-Value MapStyle 2 .599 .300 3.213 .0438 Residual 118 11.001 .093
Dependent: envp Type III Sums of Squares
Table 4 Results of ANOVA for the variables mapstyle and proportion of environmental descriptors of
decision points
Source df Sum of Squares Mean Square F-Value P-Value
MapStyle 2 .500 .250 3.873 .0235
Residual 118 7.615 .065
Dependent: funp Type III Sums of Squares
Table 5 Results of ANOVA for variables mapstyle & proportion of student functional descriptors of
decision points
Means for each of the groups, together with the cell-sizes for the groups are shown in Table 6 and Table 7. Variations in cell-sizes should be noted by the reader.
Count Mean Std. Dev. Std. Error
S 35 .609 .286 .048
R 72 .480 .321 .038
L 14 .652 .265 .071
[image:8.595.308.536.87.310.2]Means Table Effect: MapStyle Dependent: envp
Table 6 Means, counts, standard deviations & standard errors for each cell in the ANOVA based on map style and proportion of student environmental descriptors of
decision points
Count Mean Std. Dev. Std. Error
S 35 .195 .208 .035
R 72 .310 .278 .033
L 14 .149 .227 .061
Means Table Effect: MapStyle Dependent: funp
Table 7 Means, counts, standard deviations & standard errors for each cell in the ANOVA based on
mapstyle & proportion of student functional descriptors of decision points
Figures 6 and 7 show respectively the plots for the mean percentage of environmental and functional descriptors used by students organised according to map-drawing style adopted. In comparing the two plots, it is interesting to note the trends are reversed.
4
Discussion
There is a general trend for students who drew a survey map to gain higher marks than those who drew a route map, who in turn do better than those who drew landmark maps. We refer to this as the “L-R-S” trend. This trend mirrors the hierarchy of spatial knowledge described above Werner (1997), Poucet (1993). These parallels suggest that our participants do have preferred navigational strategies, and that these strategies are relevant to success in an introductory programming course.
S R L
.46 .48 .5 .52 .54 .56 .58 .6 .62 .64 .66
MapStyle
Cell Means of envp
[image:8.595.325.523.542.702.2]Interaction Plot Effect: MapStyle Dependent: envp
Figure 6: Plot of the proportion of environmental descriptors used by students organised according to
S R L .14
.16 .18 .2 .22 .24 .26 .28 .3 .32
MapStyle
Cell Means of funp
[image:9.595.85.269.60.206.2]Interaction Plot Effect: MapStyle Dependent: funp
Figure 7 Plot of the proportion of functional descriptors used by students organised according to
map-drawing style.
How these are relevant is a matter for conjecture at this stage, but the literature reviewed briefly above suggests that different navigational strategies may affect the way in which programmers are able to navigate programming code and to form a conceptualisation of the major features of this code in so doing.
The grouped results for the United Kingdom, New Zealand and Australia (see Figure 4.14) show an interaction-effect between country and mapping style. The differences in cell size means the interpretation of this result must be treated with caution. If we accept that there is an effect, we cannot tell whether this is due to general educational effects, the nature of the courses in each country, or the components used to determine the final mark for each course. The reasons for differences in the results for these countries require further investigation.
Although a significant relationship was found between descriptions of Decision Points given by participants and their map style (see Tables 4 and 5), these Decision Point descriptors were not related to final marks. This suggests that students’ ability to represent navigational knowledge visually may not be related to their ability to describe it. There are some potential implications here for the use of written examinations over practical examinations, in capturing students’ comprehension and creation of program structures.
In a study that included an examination of program design representations (Fincher, Petre, et.al., 2004) it was found that first competency (novice) students tended to rely on more textual representations, educators (more expert programmers) frequently employed diagrammatic representations and graduating students were evenly distributed among textual, graphical and standard diagrammatical representations. These variations in experience and representation method may have some correlation with the route, landmark and survey representations found in this study. Future studies could compare students’ map-drawing strategies and compare them to program representation strategies to help identify a predictor for successful program design.
Problems associated with the coding of some maps as being landmark, route or survey could be attributable to the fact that students were not using one strategy
exclusively. Student may have been conceptually using a mixture of approaches to develop their maps, which resulted in their maps exhibiting features of more than one approach. Attempting to code as exhibiting ‘pure’ approaches may not have been appropriate.
There are three confounding factors that may have contributed to the lack of any conclusive findings. Firstly, we did not assess the degree of environmental support given to navigation in the physical environment, such as campus maps and directional signs. Exposure to navigational support in the physical environments may have influenced the map-drawing approach taken by students. A second confounding factor is that the differences in the physical environments for which the maps were drawn. We speculate that the difficulty with these maps is due to the “maze-like” nature of the route sketched, principally through building corridors. Navigation in mazes is known to involve different navigational approaches (Werner, 1997). Future studies that explore map-drawing approaches should ensure that a given task is not maze-following.
The third potentially confounding factor in this study is the nature of the assessment strategies used to determine final marks. As these were not standardised across the institutions involved in this study there is potential for differences found to be attributable to differences in assessment strategy. Assessment approaches could include tasks such as: actual program design and coding tasks; tasks that require students to express conceptual understanding of program control-structures; written exams; practical exams; or, multiple choice questions. Future studies should be structured so that the assessment tasks are designed to measure higher-order skills and are consistent across institutions.
There are also some other potentially fruitful directions for future research. In addition to previously mentioned possibilities of further exploration of differences between countries and exploration of any predictive link between map-drawing strategies and representation of program designs, other research could include a number of possibilities. The most obvious of these is to repeat the research, but to include controls for the factors identified as confounding in this study.
We believe that it would also be informative to include in any future students the capture of information that exposes the sequence in which students constructed their maps. Video or graphic-tablet capture of the map-construction sequence may expose indicators of the conceptualisation that students have of the task. Whether students lay down survey information and then indicate a route, or describe a path and then add survey or landmark information as elaboration. Sequence of map construction would, we believe, provide richer information about students’ cognitive processes.
are the same skills used in physical navigation tasks. We feel that further investigation of the relationship between students’ map-drawing style and success in computer programming is warranted.
5
Acknowledgements
This study was supported by an ACM Special Interest Group in Computer Science Education (SIGCSE) Special Projects Grant and by a grant from Computing Research and Education Association of Australasia (CORE). Thanks to Caroline Wills for assistance with workshop organisation and transcription; to Diane Hagan, CSSE, Monash University, for her insight and assistance in conducting the study with Monash students while a participating researcher was on a Visiting Scholar Grant; to Warren Hill of Charles Darwin University, Charles Thevathayan of RMIT University, and Dongmo Zhang of University of Western Sydney for facilitating access to participants; to Susan Snowdon for her contribution to the literature search; to Anthony Robins and Raymond Lister for exemplary workshop organization and support; and to Box Catering Inc for phenomenal food.
6
References
Biggerstaff, T. J., Mitbander, B. G., and Webster, D. (1993). The concept assignment problem in program understanding. Paper presented at the 15th International conference on Software Engineering, Baltimore, Maryland.
Cox, A., Fisher, M. and O’Brien, P. (2005) Theoretical considerations on navigating codespace with spatial cognition. Romero, P., Good, J., Acosta Chaparro, E. and Bryant, S. (eds) 17th Workshop of the Psychology pf Programming Interest Group, Sussex University, June 2005. 92-105.
Cox, A., & Fisher, M. (2004). Navigating codespace: A new direction for spatial cognition research. Paper presented at the International Society for Human Ethology.
Fincher, S., Baker, B., Box, I., Cutts, Q., de Raadt, M., Haden, P., Hamer, J., Hamilton, M., Lister, R., Petre, M., Robins, A., Simon, Sutton, K., Tolhurst, D., Tutty, J. Programmed to succeed?: a multi-national, multiinstitutional study of introductory programming courses (2005). Computing Laboratory Technical Report 1-05, University of Kent, Canterbury, UK. Fincher, S, Petre, M. Tenenberg, J. Blaha, K., Bouvier, D.
Chen, T-Y., Chinn, D., Cooper, S., Eckerdal, A., Johnson, H., McCartney, R., Monge, A., Mostrom. J. E., Powers, K., Ratcliffe, M., Robins, A., Sanders, D., Schwartzman, L., Simon, B., Stoker, C., Tew A. E. and VanDeGrift, T. (2004) Cause for Alarm? A multi-national, multi-institutional study of student-generated software designs. Technical Report No. 16-04, Computing Laboratory, University of Kent.
Green, T. R. G. (1997). Cognitive approaches to software comprehension: results, gaps and limitations. Paper
presented at the Experimental Psychology in Software Comprehension Studies, Limerick, Ireland.
McKnight, C., Dillon, A., and Richardson, J. (1991). Hypertext in Context. Cambridge, UK. Cambridge University Press.
Mosemann, R., and Wiedenbeck, S. (2001). Navigation and comprehension of programs by novice programmers. Paper presented at the EEE 9th International Workshop on Program Comprehension (IWPC 2001).
Petre, M., & Blackwell, A. F. (1999). Mental imagery in program design and visual programming. International Journal of Human-Computer Studies, 51(1), 7-30. Poucet, B. (1993). Spatial cognitive maps in animals:
New hypotheses on their structure and neural mechanisms. Psychological Review, 100, 163-182. Werner, S., Krieg-Bruckner, B., Mallot, H. A.,