City, University of London Institutional Repository
Citation
:
Stumpf, S., Skrebe, S., Aymer, G. & Hobson, J. (2018). Explaining smart heating systems to discourage fiddling with optimized behavior. CEUR Workshop Proceedings, 2068,This is the published version of the paper.
This version of the publication may differ from the final published
version.
Permanent repository link:
http://openaccess.city.ac.uk/20036/Link to published version
:
Copyright and reuse:
City Research Online aims to make research
outputs of City, University of London available to a wider audience.
Copyright and Moral Rights remain with the author(s) and/or copyright
holders. URLs from City Research Online may be freely distributed and
linked to.
City Research Online: http://openaccess.city.ac.uk/ [email protected]
Explaining smart heating systems to discourage fiddling
with optimized behavior
Simone Stumpf, Simonas Skrebe, Graeme Aymer, Julie Hobson
Centre for HCI Design, School of Mathematics, Computer Science and Engineering
City, University of London
UK
{Simone. Stumpf.1, Simonas.Skrebe, Graeme.Aymer, Julie.Hobson}@city.ac.uk
ABSTRACT
Our work focuses on textual and graphical explanations for smart heating systems. We have started to investigate the opportunities for when to provide explanations, how we can design these explanations, and we have started to evaluate these explanations. We argue that explanations need to be carefully crafted to fit with their desired aim, in our case to
encourage users’ trust and reliance while minimizing user
interactions.
Author Keywords
Explanations; smart heating systems; trust; constrained engagement.
ACM Classification Keywords
H.5.m. Information interfaces and presentation (e.g., HCI): Miscellaneous.
INTRODUCTION
Intelligent user interfaces for heating systems are becoming increasingly popular in recent years. Based on user preferences and other characteristics, modern smart heating systems like Nest, Ecobee and Lyric are able to make intelligent decisions to optimize comfort and savings on the user's behalf [9], for example to pre-heat the home or switch the heating off when it is sensed that nobody is present. While traditional heating systems are essentially directly manipulated by users, smart heating systems make some heating decisions by themselves; hence, from the user's perspective, the system has temporarily some control over what decisions are executed and how.
Not only are user interfaces for controlling heating systems getting more intelligent, the network and heat sources involved in customers’ heating are also getting smarter.
Two such new ways are demand response and hybrid heat pumps. Demand response means fluctuating consumption in the energy network is taken into account to reduce or shift a customer's energy consumption during peak periods. A hybrid heat pump is a heat source which can move energy from outside (either air or the ground) and "pumps" it to a unit where it can be used to provide central heating. In addition to this mode of operation, it can also switch to gas or electricity as a primary heat source. The system can, for
example, determine to run on gas if the home needs a short temperature "boost" which cannot be achieved with a heat pump that takes longer to heat up. Therefore, hybrid heat pumps are ideally suited for demand response due to their ability to shift to different energy sources without a reduction in comfort.
These modern smart heating systems are highly optimized to balance comfort and cost. Previous work involving smart heating systems has called for constrained engagement
between the system and user [13], where the user can engage with the system to feed back important information to the system or override it if necessary but communication is constrained so it does not overwhelm the user or push itself to the front. Smart heating systems thus follow the concept of calm technology [12], in which the technology fades into the periphery. Most research has been focused on eco-feedback to manage and, ideally, reduce energy consumption [e.g. 2, 4]. Our endeavor is different; we seek to explain system behavior so that users can engage with these highly optimized systems to manage their comfort as a co-operative team. Contrary to most explainable systems, our aim is to stop users from fiddling with the system, i.e.
provide explanations for these systems to encourage users’
trust and reliance while minimizing user interactions. Our work is set in a larger project to understand the overall value and user experience of hybrid heat pump deployment in demand response settings. This project, FREEDOM
(Flexible REsidential Energy Demand Optimisation and Management), led by Passiv Systems Ltd. and funded by Western Power Distribution and Wales and West Utilities, is the first of its kind to investigate consumer engagement with these new technologies as part of a smart heating system. We describe a study to understand when and what needs to be explained, how we created designs for a smart system control app, and a study to investigate the impact of aspects of these explanations on user understanding and trust. We conclude with a brief discussion and our plans for future work.
INVESTIGATING OPPORTUNITIES FOR CONSTRAINED ENGAGEMENT AND CALM TECHNOLOGY
Drawing on previous work in intelligibility, transparency and explanations [3, 5, 6, 7, 8], we investigated how to support users to feel engaged with their smart heating system so that they feel in control and understand what the
system is doing, and the potential effects of constrained engagement on the user experience. A fuller account of the methodology and results can be found in [10]. Similar in approach to User Enactments [2], we involved 14 participants who went through 5 hypothetical scenarios to explore their reactions and ensuing interactions with a paper prototype interface which the researcher and the participant jointly constructed on the fly (Figure 1 and 2). Throughout the study, participants were encouraged to draw on the sketches and verbalize their thoughts and decisions, thus providing a rich medium to capture participant's perceptions and expectations [11].
We found that there are certain points in the system’s
behavior when opportunities for constrained engagement present themselves. Participants interacted with the smart heating system when their comfort was compromised or when the system actions were unexpected. Participants expected to be notified when decisions were taken, however, they can be dissuaded from intervening to over-ride system behavior through appropriate explanations. Participants wanted detailed information about what the system is doing as well as the motivation and benefits for doing them. Textual and very simple graphical visualizations seem to be able to communicate past and future actions but if the content and form are not appropriate it might lead to users to abandon the system and might cause distrust in energy providers (instead of the user
interface providers). More complex graphical explanations were often found to be overwhelming and confusing.
DESIGNING THE EXPLANATIONS FOR A SMART HEATING USER INTERFACE
We then engaged in designing and implementing the user interfaces for a smart heating system that explains its behavior to users while trying to minimize follow-on user interactions. Our premise was that in some instances, explanations serve as persuasive arguments and can deter users from correcting system actions [1]. We started by identifying all the opportunities for constrained engagement in the system by listing decision points that might need to be communicated. Overall, we identified 7 different decision points that users might possibly need to have explained to them, for example, starting to preheat the home to reach a target temperature set in a daily heating schedule, maintaining a temperature set point in a daily heating schedule, etc. We then interviewed system engineers who worked on the algorithms to find out how the system makes this decision, focusing in particular what input data is used to drive the system behavior in terms of the output temperature and the heat source decisions. For example, in preheating the home to reach a target temperature setpoint at the start of the next schedule period, the system was using the current internal home temperature, the current external temperature, learned properties around the rate of heating in the home, the heating schedule set up by the user in terms of desired temperature during certain times of the day, cost versus savings modes, the weather forecast over the next 24-hour period, and energy price tariff info.
[image:3.612.90.249.389.518.2]Once we had all of this information we began to craft Figure 1: P3's sketch for explaining system behavior when
user increased the temperature.
Figure 2: P7's sketch for progress indication (black dots) and an explanation how long it will take to reach a certain temperature.
Figure 3: Textual explanations show reasons for system behavior, in this case preheating. 1) short explanation 2) system data 3) simplified overview 4) switch to graphical explanation 5) hide explanation 6) correct system.
Next: IN period starts 18:15
Electricity – heat pump
16.5˚
Indoors Now
IN
IN
19˚
Preheating to
16.5˚
Now
indoors
So you'll be comfortable <in the mor ning>, your home is preheating.
It will take <X> hrs <Y> mins to reach <19˚> by <18:45>, based on:
• The indoor and outdoor temperatur es • How well your home holds its heat • Your Comfort & Savings settings
<Plus, your electricity is currently at a lower rate, so preheating now is better value for you.>
Preheating will continue until the start of the next IN period.
OK
Show graph Remove message Edit schedule Screen 1 – Preheating
1
1 Interface elements colour-match those on graphical explanation.
2
2 Copy in angled brackets <> supplied by system data.
3
3 Textual explanation mentions all factors on which system relies to make decisions affecting the user. This works as system feedback.
4
4 Tapping ‘show graph’ button opens associated graphical explanation, for richer customer understanding and more comprehensive system feedback.
5
5 Tmessage. Passiv/City to try apping ‘OK’ removes tracking this interaction for data examination. Message returns at next preheating period etc. 6
Tapping ‘Edit schedule’ takes
user to occupancy schedule. 6
6
Phone is forced landscape 7
7 Returns user to textual explanation.
8
8 User can toggle graph features on or off by checking or unchecking these boxes
9
9 Scale of temperature axis: 2˚ warmer
than max set IN temp, 2˚ below
predicted temperature outdoors (set by Met Office feed).
10
10
Scale of time axis: 12 hours past, 12 hours future. Current time is always centre, with graph scrolling past. 11
11 Elements in the ‘future’ are less saturated, with graph lines dashed.
Values of ‘Heat source cost efficiency’ graph don’t reflect absolute pricing.
Instead, this scale shows r elative
‘expensiveness’ for the customer, bearing in mind the cost of the fuel and the amount of heat the fuel sour ce generates.
12
12
1. Home preheating
Screen 1.1
[image:3.612.373.489.428.650.2] [image:3.612.89.251.549.667.2]explanations for all these decision points. Feedback during the previous study had indicated that graphical explanations were contentious and simple textual feedback also fit with the notion of calm technology. Hence, our guiding principle was that the default explanation would be a simplified textual explanation, and every time a new decision was made this was communicated (Figure 3). If the user disagrees with the system, appropriate actions, e.g. to edit the heating schedule, were supported by the explanations. More complex graphical explanations could be shown on request which visualized the main data underlying the system behavior and its decisions. To provide flexibility, a particular combination of data can be shown in response to a system decision, for example, in pre-heating (Figure 4) a wide variety of data figures into the indoor temperature. However, the user can select (or de-select) which data is presented, i.e. the user can simplify the graphical explanation (or indeed show more data, if desired).
We carried out some limited usability testing on these explanations which showed that there were no major problems in using them. These designs were presented to the project partners to use as a basis for the design of the control app for the hybrid heat pump trial. In addition, we also designed a heating cost calculator that showed the impact of raising or lowering temperature set points in the schedule on heating bills.
SMART HEATING USER INTERFACES AND TRUST
More recently, we have undertaken a study to explore the effect of these different types of explanations on users. Recall that our premise was that increased understanding and trust might lead to not correcting the system. We carried out a between-group experiment to assess understanding and trust with 60 participants with one of four explanation conditions (15 participants each): Control (no explanation), Text-only (like Figure 3), Graphical-only (like Figure 4), and Both (explanation consisting of both graphical and written elements). Each participant was
presented with 5 simulated home heating scenarios: Normal maintaining, Normal preheating, Normal away mode, Preheating due to Demand Response, and Delayed heating due to Demand Response.
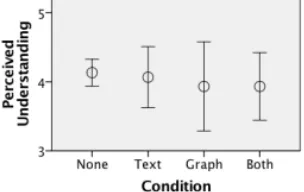
We captured participants’ perceived and demonstrated understanding (the latter coded from free text responses), trust ratings after each scenario, and qualitative feedback. The results showed that explanations, in particular text-based explanations, improved demonstrated understanding, yet there was no significant effect on perceived understanding (Figure 5) based on explanation type. However, perceived understanding had a strong correlation with trust (Figure 6). Giving different types of explanations did not have an effect on trust in the system, however, participants without explanations were more sensitive to predictability of system behavior while participants with
any of the explanations focused more on their perception of what the system was doing and whether they agreed with it. In order to improve trust, participants frequently asked for even more information and data to be provided especially about costs.
DISCUSSION AND FUTURE WORK
There are many options for providing explanations and controllability in a smart heating system. Here we discuss some of the findings and implications from our work so far. Our work has explored when to provide explanations for a smart heating system. We believe that this work could be
extended and generalized but that points for “constrained engagement” need to be investigated for each system.
We have also started to investigate what should be communicated in these explanations. We have focused on
the “input data” and “output data” instead of the details of
the algorithmic model as these aspects are more readily explained both in textual as in graphical form. However, we also noted that users expect to see reasons for making decisions and potential benefits to them. This area warrants further investigation, especially as this seems to be very dependent on the systems and its context of use. There have also been suggestions that “what-if” explanations could be
very useful but so far our work has not explored this with users, and neither have we had any calls for this
[image:4.612.65.291.59.187.2]Figure 5: Mean ratings of perceived understanding with 95% confidence intervals.
Figure 4: Graphical explanations show past and estimated future data, in this case preheating. 6) correct system 7) back to main screen 8) configure data to show in graph 9) scaled temperature 10) relative value of energy pricing 11)
future is less saturated to indicate “uncertainty” 12) time
with current time always in the middle.
Preheating Edit schedule Comfort & Savings Temp. outdoors Temp. indoors Occupancy period Primary heat source Heat source cost efficiency Preheating Electricity high demand period 17:00 11:00 08:00
05:00 14:00 20:00 23:00 02:00 05:00 System on,
warming home Heat pump on low power
System off Heat switched to gas boiler
Heat switched to heat pump
Comfort & Savings settings in effect
6 0 8 10 12 14 16 18 4 2 20 6 0 8 10 12 14 16 18 4 2 20 Pre-heating Preheating Pre-heating IN 06:45 – 09:45 19˚ ASLEEP 21:45 – 06:45 12˚ IN
18:15 – 21:45
19˚ ASLEEP
21:45 – 06.45
12˚ Temperature outdoors Temperature indoors Heat source cost efficiency More expensive Less expensive
Electricity – heat pump Gas – boiler
OUT 09:45 – 18:15 8˚
£ £
£
1
1 Interface elements colour-match those on graphical explanation.
2
2 Copy in angled brackets <> supplied by system data.
3
3 Textual explanation mentions all factors on which system relies to make decisions affecting the user. This works as system feedback.
4
4 Tapping ‘show graph’ button opens associated graphical explanation, for richer customer understanding and more comprehensive system feedback.
5
5 Tmessage. Passiv/City to try apping ‘OK’ removes tracking this interaction for data examination. Message returns at next preheating period etc. 6
Tapping ‘Edit schedule’ takes
user to occupancy schedule. 6
6
Phone is forced landscape 7
7 Returns user to textual explanation.
8
8 User can toggle graph featur es on or off by checking or unchecking these boxes
9
9 Scale of temperature axis: 2˚ warmer
than max set IN temp, 2˚ below
predicted temperature outdoors (set by Met Office feed).
10
10
Scale of time axis: 12 hours past, 12 hours future. Current time is always centre, with graph scrolling past. 11
11 Elements in the ‘future’ are less saturated, with graph lines dashed.
Values of ‘Heat source cost efficiency’ graph don’t reflect absolute pricing.
Instead, this scale shows relative
‘expensiveness’ for the customer, bearing in mind the cost of the fuel and the amount of heat the fuel sour ce generates.
12
12
1. Home preheating
Screen 1.1
[image:4.612.363.515.571.667.2]functionality from participants in our studies.
Our designs have explored how to provide explanations. All evidence seems to suggest that graphical explanations need to be employed cautiously: some people love them, some people hate them. However, textual explanations, even if high-level, seem to be valuable.
We have not yet investigated the effects on perceived controllability of our UI, mainly because this is very difficult to do in a lab study since changes in temperature in response to changes in settings are very hard to simulate. However, we believe that there is a link between intelligibility, controllability and user experience but that this relationship is complex and needs to be further explored.
In future work, we will be participating in a field study over the heating season in 2017/18 during which we will have the opportunity to gather feedback from users in a real world setting after the complete smart heating system has been installed. This will provide some answers about how the explanations are perceived, and whether this might have any effect on interacting with the smart heating app.
REFERENCES
1. Adrian Bussone, Simone Stumpf, and Dympna O'Sullivan. 2015. The Role of Explanations on Trust and Reliance in Clinical Decision Support Systems. In Proceedings of the 2015 International Conference on Healthcare Informatics (ICHI '15). IEEE Computer Society, Washington, DC, USA, 160-169.
2. Chuan-Che (Jeff) Huang, Sheng-Yuan Liang, Bing-Hsun Wu, and Mark W. Newman. 2017. Reef: Exploring the Design Opportunity of Comfort-Aware Eco-Coaching Thermostats. In Proceedings of the 2017 Conference on Designing Interactive Systems (DIS '17). ACM, New York, NY, USA, 191-202.
3. Shirley Gregor and Izak Benbasat. 1999. Explanations from intelligent systems: theoretical foundations and implications for practice. MIS Q. 23, 4 (December 1999), 497-530.
4. Rikke Hagensby Jensen, Jesper Kjeldskov, and Mikael B. Skov. 2016. HeatDial: Beyond User Scheduling in Eco-Interaction. In Proceedings of the 9th Nordic
Conference on Human-Computer
Interaction (NordiCHI '16). ACM, New York, NY, USA, Article 74, 10 pages. DOI:
https://doi.org/10.1145/2971485.2971525 5. René F. Kizilcec. 2016. How Much Information?:
Effects of Transparency on Trust in an Algorithmic Interface. In Proceedings of the 2016 CHI Conference on Human Factors in Computing Systems (CHI '16). ACM, New York, NY, USA, 2390-2395.
6. Todd Kulesza, Simone Stumpf, Margaret Burnett, and Irwin Kwan. 2012. Tell me more?: the effects of mental model soundness on personalizing an intelligent agent. In Proceedings of the SIGCHI Conference on Human Factors in Computing Systems (CHI '12). ACM, New York, NY, USA, 1-10.
7. Todd Kulesza, Margaret Burnett, Weng-Keen Wong, and Simone Stumpf. 2015. Principles of Explanatory Debugging to Personalize Interactive Machine Learning. In Proceedings of the 20th International Conference on Intelligent User Interfaces (IUI '15). ACM, New York, NY, USA, 126-137.
8. Brian Y. Lim, Anind K. Dey, and Daniel Avrahami. 2009. Why and why not explanations improve the intelligibility of context-aware intelligent systems. In Proceedings of the SIGCHI Conference on Human Factors in Computing Systems (CHI '09). ACM, New York, NY, USA, 2119-2128.
9. James Pierce and Eric Paulos. 2012. Beyond energy monitors: interaction, energy, and emerging energy systems. In Proceedings of the SIGCHI Conference on Human Factors in Computing Systems (CHI '12). ACM, New York, NY, USA, 665-674.
10. Simonas Skrebe and Simone Stumpf (2017) An exploratory study to design constrained engagement in smart heating systems. Proceedings of the British HCI Conference, Sunderland.
11. Maryam Tohidi, William Buxton, Ronald Baecker, and Abigail Sellen. 2006. User sketches: a quick,
inexpensive, and effective way to elicit more reflective user feedback. In Proceedings of the 4th Nordic conference on Human-computer interaction: changing roles (NordiCHI '06), Anders Mørch, Konrad Morgan, Tone Bratteteig, Gautam Ghosh, and Dag Svanaes (Eds.). ACM, New York, NY, USA, 105-114. 12. Mark Weiser and John Seely Brown. 1997. The
coming age of calm technolgy. In Beyond calculation, Peter J. Denning and Robert M. Metcalfe (Eds.). Copernicus, New York, NY, USA 75-85.
13. Rayoung Yang and Mark W. Newman. 2013. Learning from a learning thermostat: lessons for intelligent systems for the home. In Proceedings of the 2013 ACM international joint conference on Pervasive and ubiquitous computing (UbiComp '13). ACM, New York, NY, USA, 93-102.
Figure 6: Correlation between ratings of perceived understanding, and change in trust (left) and final trust ratings (right).
35 However, unlike demonstrated understanding, perceived understanding was strongly correlated with trust, both final trust (Spearman’s Rho = 0.609, p < 0.001) and change in trust (Spearman’s Rho = 0.528, p < 0.001). This is illustrated by the somewhat linear clustering of participants in the scatterplots and heatmaps below. Therefore, though it cannot be said that actual understanding increased trust, it is true that the more that people thought they understood the system, the more they trusted it.
Figures 16 and 17. Scatterplots showing the relationship between trust and perceived understanding. Left to right: change in trust, final trust.
Figures 18 and 19. Heatmaps showing the frequency of participants for each level of trust and each level of perceived understanding. Left to right: change in trust, final trust.