City, University of London Institutional Repository
Citation
: Villar, A. & Fitzgerald, R. (2017). Using mixed modes in survey data research:
Results from six experiments. In: M. Breen (Ed.), Values and Identities in Europe: Evidence from the European Social Survey. (pp. 273-310). Routledge. ISBN 9781138226661This is the submitted version of the paper.
This version of the publication may differ from the final published
version.
Permanent repository link:
http://openaccess.city.ac.uk/16770/Link to published version
:
Copyright and reuse:
City Research Online aims to make research
outputs of City, University of London available to a wider audience.
Copyright and Moral Rights remain with the author(s) and/or copyright
holders. URLs from City Research Online may be freely distributed and
linked to.
City Research Online: http://openaccess.city.ac.uk/ [email protected]
259
Chapter 16 Using mixed modes in survey research: Evidence from six
experiments in the ESS
Ana Villar and Rory Fitzgerald
Introduction
Technological advances and increasing access to telephone and the internet mean that it is now possible for people to complete surveys by phone or online rather than face-to-face with an interviewer present. As budgets tighten and the benefits of using other modes (such as speed and flexibility) become more apparent, there has been a debate about whether it is better to use
alternatives to face-to-face surveys either exclusively or in combination with in-person interviews. This chapter summarises findings from research conducted under the auspices of the European Social Survey (ESS) over the past 12 years to evaluate the potential effects of mixed-mode data collection on its own cross-national survey estimates.
The ESS is an academically driven cross-national survey that has been conducted every two years since 2001 across large parts of Europe. One of the main aims of the ESS is ‘to chart stability and change in social structure, conditions and attitudes in Europe’ by analysing, combining, and comparing data from different countries. In order to be able to ensure meaningful comparisons of survey estimates across countries, it was decided that essential survey conditions, such as mode of data collection, should be as similar as possible across participating countries (Jowell, 1998), and that the high standards of scientific rigor would be implemented in all of them (Jowell, Roberts,
Fitzgerald, & Eva, 2007).
Cross-national surveys like the ESS face challenges not usually encountered in national studies. To ensure data comparability across different countries, these surveys depend on a ‘principle of equivalence’ (Jowell, 1998). This principle relies on standardisation of all possible aspects of the survey process: sampling (Lynn, Japec, & Lyberg, 2006), question wording (Harkness, 2003;
Harkness, Villar, & Edwards, 2010), response options and coding schema (Jowell et al., 2007), and so on. For this reason, the most ambitious multinational projects tend to require all participating
countries to employ the same mode of data collection. In the case of the ESS, the exclusive mode for data collection in the main questionnaire is face-to-face interviewing.
Face-to-face interviewing has been recognised by many as the ‘gold standard’ among data collection methodologies. Research has shown face-to-face surveys obtain higher response rates (de Leeuw, 1992; Groves et al., 2004; Holbrook, Green, & Krosnick, 2003), largely because of the effectiveness of in-person contacts at persuading sampled individuals to take part. Face-to-face data collection can also improve data quality, partly because interviewers can help navigate the questionnaire, probe answers to ensure they are recorded correctly, and motivate respondents when they feel fatigued. In addition, coverage and familiarity with different modes of data collection varies widely across European countries, whether because of survey traditions or because of differential access to
However, at the time the ESS was established, there were concerns that face-to-face data collection would not be optimal in all countries. Researchers in a few countries worried that a) an interviewer infrastructure did not exist to carry out large-scale face-to-face surveys, b) costs would be higher than feasible, and/or c) participation would be lower or more biased than using a different mode of data collection, given the survey tradition in the country. These concerns were valid and important, but it was not clear from the evidence available how using different modes in different countries would affect survey estimates and data quality, especially in a cross-national context. Therefore, the Core Scientific Team (CST) of the ESS established a programme of methodological research to examine the impact of mixing data collection modes (within and between countries) on the overall quality of survey estimates. At the early stages of the research programme, the most likely alternative mode for the ESS was telephone interviewing, given that the length and complexity of the interview questioned the suitability of using postal self-completion surveys, and that large proportions of the population did not have internet access. Thus, the first studies focused on evaluating the suitability of telephone interviews in the ESS. As internet penetration increased across Europe over the life of the ESS mixed-mode research programme, however, attention to the web as an alternative mode has increased, and all studies since 2008 have included web data collection. This chapter summarises findings from the six studies carried out since 2003 under the ESS mixed-mode research programme to evaluate the effects of mixed-mode data collection on survey estimates.
The six studies
Six ESS studies on mixed-mode data collection have been conducted since 2003 (see Table 16. for an overview). Of these, three focused solely on assessing the effect of mode on measurement (studies 1, 2 and 3). The other three investigated the feasibility and practical challenges of implementing different mode designs in cross-national surveys, where all sources of survey error were potentially affected by the mode design (studies 4, 5, and 61). In this section, we present an overview of the main essential survey features for each study.
Study 1: Measurement differences across four modes. The first study focused on studying measurement differences in estimates by mode, comparing face-to-face interviews, telephone interviews, self-completion paper and pencil questionnaires and web-based self-completion
questionnaires. The study took place in May and June 2003 in Hungary, where a convenience sample of participants were approached on the street and invited to participate in a ‘hall test’. Those agreeing to take part were randomly assigned to one of the four modes of data collection. Participants were re-interviewed in a different randomly-assigned mode2, either 20 minutes later at the same venue or a few days later at home. Cooperation rates to the second interview for those completing at home were 73% for telephone and 48% for mailed questionnaires. All participants received the same 25
questions from the ESS and the Eurobarometer in both interviews, making it possible to examine differences in responses both between and within the same participants.
Study 2: Measurement differences: Finding the cause. The second study aimed to investigate the causes of measurement differences between telephone and face-to-face data collection observed in Study 1. The experiment was designed to isolate the effect of mode from the effect of question changes related to adaptation of the questionnaire for a different interview setting (i.e., a telephone interview). Three experimental groups were compared: 1) a group interviewed face-to-face using 44 ESS standard questions including showcards, 2) a group interviewed by telephone (fixed or mobile)
1 It is worth noting that all studies intended to evaluate feasibility and compare alternative modes to the
standard ESS face-to-face data collection (studies 4, 5, and 6) used fieldwork procedures as close as possible to those applied in the country for the corresponding ESS round.
2 The experimental design was not fully crossed: those interviewed by web in the first wave of data collection
Ta
ble
16.1
. Ove
rvie
w of
d
esign cha
ra
cter
ist
ics f
o
r e
ac
h st
[image:5.595.69.454.128.729.2]
Gallup Europe carried out the experiment using random samples from Hungary and Portugal starting in July 2005. Fieldwork was concentrated in Budapest and Lisbon, where suitable sampling frames were available that included telephone numbers and addresses, thereby holding error from sampling and coverage constant between modes. Respondents answered questions about their interview experience, and interviewers answered six questions to describe the respondents’ engagement and effort during the interview process. The response rate was 32% in both modes.
Study 3: Measurement differences: F2F vs web. This study intended to evaluate measurement differences between face-to-face and web data collection, using a within respondent re-interview design. The goal was to evaluate how open-ended questions, complex questions and seemingly mode-sensitive questions compared across the two modes. The study was carried out in two waves: the first wave was the main stage of Round 5 of the ESS in the United Kingdom
(September-November 2010), and the second was a follow-up web survey of a subsample of the same face-to-face respondents (October 2010-January 2011). The sampling design for the face-to-face stage was a clustered, stratified, 3-stage random probability design using a frame of addresses. At the end of the interview, UK ESS respondents were invited to participate later on in a web survey; the survey included a subset of 32 of the questions they had answered during the face-to-face interview. Of all respondents invited to the follow-up study3, 43% said they were willing to be contacted. Invitations were sent about three weeks after the face-to-face interview to 927 respondents, of whom 613
completed the web survey, for a completion rate of 66% and a cumulative response rate (Callegaro & DiSogra, 2008) of 29%. Comparisons between responses given to the face-to-face and web by the same respondents can provide insights about measurement differences across the two modes. There was, however, no face-to-face control group due to limited funding availability. In addition to the implications for mode differences in measurement, this study is relevant to the current ESS pilot to establish a cross-national probability based panel as part of the SERISS project (see www.seriss.eu).
Study 4: Feasibility of ESS telephone interviews. In 2006, a study was designed to examine a) the practical challenges and feasibility of using telephone as a mode of data collection in the ESS and b) the effect of inviting respondents to participate in telephone interviews of different lengths on their willingness to participate in the survey. It was the first study to implement the full ESS interview in an alternative mode. Sample members, selected using probability sampling methods, were randomly assigned to one of three treatment groups, which varied according to the length and design of the questionnaire: A) 60 minutes; B) 45 minutes; and C) 30 minutes (and a further 30-minute interview, offered at the end of the first 30 minutes). The target population in the telephone samples were households with fixed-line telephones; for this reason, all analyses comparing the telephone and face-to-face samples in Study 4 excluded respondents from the standard ESS who did not have a fixed-line at home. Response rates varied widely across different countries and interview lengths (see section 4.1 on outcome rates). The experiment was carried out in five countries: Cyprus, Germany, Hungary, Poland and Switzerland. The selection of countries was based on pragmatic considerations and the available budget; but within those constraints, countries with divergent traditions of survey practice and facing different challenges in their data collection efforts were chosen. Countries were
encouraged to use fieldwork procedures as similar as possible to the standard ESS in their countries, but some features varied due to budget constraints (e.g., incentives, pre-notification letters).
Study 5: Feasibility of mixed-mode designs: sequential vs concurrent. Study 5 also intended to investigate the feasibility of alternative mode designs, including for the first time web mode as a way to increase cost-efficiency. The study was conducted in The Netherlands in 2008, parallel to Round 4 of the standard ESS, and was the first ESS study to use within-country, across respondents mixed-mode data collection. A random sample of 2,500 addresses was selected, using the same postal sample frame and probability-based design as in the standard Dutch ESS. The sample of addresses
was matched with information about the name and telephone number of people living at the address for 70% of the sampled units using a commercial database. The sample for which a telephone number was available was then randomly allocated to one of the two mixed-mode designs: a ‘concurrent’ design, where respondents were contacted by telephone and offered three modes to choose from, and a ‘sequential’ design, where respondents first received a telephone request to complete the survey using the web (without mention of other modes if they had internet access). Those who had not completed the survey after a certain period were offered a telephone interview or, finally, a face-to-face interview. For addresses for which telephone contact was not available, the design was different: an interviewer visited the household and offered an in-person interview; those who refused were invited during the same visit to complete a web survey.
Study 6: Feasibility of mixed-mode designs across countries. In this study, countries were invited to select the ideal mixed-mode design given the country’s survey environment. The Estonian
experiment compared the standard ESS survey to a sample of 1,050 units selected from the same population register from which the main ESS sample was drawn. An invitation was mailed to each sample unit (named individual) asking them to participate in the ESS by completing a web survey. An interviewer visited those who did not complete the web survey after two reminders, to try to complete a face-to-face interview. Similarly, the UK tested a mixed-mode data collection design where invitations to a web survey were mailed to a random sample of UK addresses; if no response was obtained from the address after one reminder, an interviewer visited the selected address and tried to complete a face-to-face interview4. However, the UK lacks a sample frame of individuals, so additional procedures were implemented to try and randomly select a household member by enclosing instructions for a household member to carry out the selection. The UK experiment compared the main ESS survey of about 4,500 respondents to a sample of 2,000 households selected from the same address sample frame from which the main ESS sample was drawn.
The Swedish experiments compared the main ESS survey to two samples of 300 respondents selected from the same population register from which the main ESS sample was drawn. The proposal focused on the comparison of two mixed-mode designs: a) a sequential, response enhancing design where individuals who refused to make an appointment for an in-person interview would be re-contacted and offered the possibility to complete it over the telephone and b) a sequential, cost-effective design where sampled individuals were first offered to respond to a telephone survey, and those who refused were re-contacted by telephone and invited to make an appointment for an in-person interview.
Sampling and coverage in the ESS mixed-mode studies
When survey programmes consider new designs of data collection, this may have consequences for their sampling procedures. In this section, we consider the implications of different mode designs for sampling frames, sampling designs, and fieldwork procedures. The measurement studies in general did not involve large-scale probability-based sampling; therefore, this section focuses on the feasibility studies (studies 4 through 6).
Survey sampling involves defining a target population and deciding on an approach (the sampling design) to randomly select the final units of research from a list of units (the sample frame). As with the standard ESS, sample designs were allowed to vary cross-nationally (see Table 16. for an overview), depending on the availability and quality of sampling frames in each country (Lynn, Haeder, Gabler, & Laaksonen, 2007), but this ‘flexibility assumes probability selection methods: known probabilities of selection for all population elements’ (Kish, 1994, p. 173). In section 3.1, we discuss the sampling frames used in the three feasibility studies, and we evaluate challenges faced and
4 To reduce costs, only one-fourth of those who did not complete the web interview were contacted for a
solutions applied in the context of conducting these studies. In section 3.2, two self-administered approaches to within-household random selection of respondents are compared, addressing one of the biggest obstacles for surveying the general population when sampling frames of individuals are not available and an interviewer is not present.
Sampling frames and sampling designs
The use of different modes for data collection can affect the choice of sample frame and sample design. For simplicity, one could choose sample frames with contact information best suited for the mode of data collection: addresses for in-person and mail surveys, telephone numbers for telephone surveys, and email addresses for online surveys. However, such sampling frames are not always available or do not have adequate quality, especially when conducting surveys among the general population. Telephone lists often suffer from under-coverage problems—excluding certain parts of the population—as well as over-coverage problems when members of the population can be linked to more than one telephone number. Email lists are hardly available. Therefore, researchers often face the decision of choosing between a high quality frame that does not contain contact information for the desired mode of data collection and a lower quality frame with the contact details.
Choosing the sampling frame with the highest quality might mean changing mode from recruitment stages to the actual data collection. For example, in Study 6 the ESS used sampling frames containing addresses to recruit respondents for an online survey in Estonia and the UK. Given that these
Ta
ble 16.
2
. Ove
rvie
w of
de
sign cha
ra
cter
ist
ics f
o
r e
ac
h st
udy: s
ampl
ing
R eal ise d s am p le s iz e 1,987 r es pon den ts. Int er v iews: 402 w
eb 1,109 F2F , 1, 189 Te lep hon e 1,259 Pap er s el f-adm in is ter ed 515 F2F w it h sh ow ca rds 518 F2F w it hou t show ca rds 8 87 Tel ephon e 2,422 ES S 613 We b C ypr us
: 918 ES
S, 83 Te lep hone G er m any: 2,663 ES S ; 369 Tel eph one H ungar y
: 855 ES
S ; 25 2 Tel ephone Pola nd : 1,2 18 ES S; 339 Te lephone Sw it ze rl and : 1,776 ES S; 3 4 2 Tel ephone 1,778 ES S 198 We b 123 Tel ephon e 187 F2F Est on ia : 2,380 ES S ; 35 6 W
eb, 230 F2F
U
K
: 2,286 ES
S ; 389 We b, 64 F2F Sw ede n: 1,847 ES S ; 185 p hone, 187 F2F Sampl ing fra m e Str eet r ec ru it m en t D at aba se w it h te lepho nes a nd addr ess es ES S re sp onden ts R D D , popul at ion r egi st er + m at che d t el ep hone d at a Popula ti on r egi st er + m at ch ed tel ephon e da ta For e ach c o unt ry, s am e a s in ES S R ound 6 *ES S sa m pl e s ize s i n st u dy 4 r ep res ent r espond ent s wi th f ixed te lep hone li n es a t h om e Sampl e des ign C onveni enc e sa m p le Sim p le rand om sa m pl e A ll U K ES S R ound 5 res po nden
ts who w
er e int er v iewed bef o re 1 1 N ovem b er 20 10 w er e i nvi ted R andom sa m pl e ( v ar ied ) Syst em at ic s am p li ng of house ho lds , l ast bi rt hd ay m et hod for r es ponde nt s For e ach c o unt ry, s am e a s in ES S R ound 6 L ocat ion H ungar y B udape st /L isb on U ni ted K ingd om C ypr us, Ge rm any, H ungar
y, P
ol and, Sw it ze rl and The N et h er land s Sw ede
n, Es
ton ia, U ni ted K ingd om Y ear
2003 2005 2010 2006 2008 2012
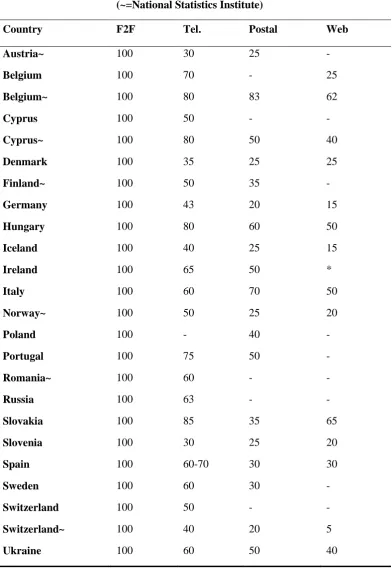
Study 4 - Feasibility of ESS telephone interviews. Participating fieldwork agencies were instructed to use the best possible probability sample design available containing telephone contact information that would support telephone interviewing (Roberts, Eva, Lynn, & Johnson, 2009). The sampling frames that countries were using for the standard ESS did not include telephone contact information, so alternative sampling frames were used for the telephone surveys. The main sampling challenge posed by using telephone as the survey mode stemmed from the fact that available sampling frames included only households with fixed-line phones, which resulted in exclusion from the sample of households with mobile telephones only and households without telephone access. Therefore, the frames led to undercoverage of the intended ESS population (residential adults aged 15+). The proportion of households without a fixed-line varies across Europe (surpassing 5% of the general population in most countries, and rising in many), which would lead to different coverage error levels across countries, potentially jeopardising comparability and introducing bias.
Study 5 – Feasibility of mixed-mode designs: sequential vs concurrent. In Study 5, the mode design involved telephone contact to invite respondents to participate using different modes of data collection (Eva et al., 2010). The goal was to reduce fieldwork costs by not having interviewers travel to the households. Ideally, target respondents would be selected from a sampling frame containing telephone contact information. However, before interviewers called households, a pre-notification letter was to be sent, as research has shown that this is an effective way to increase response rates (De Leeuw, Callegaro, Joop, Korendijk, & Lensvelt-Mulders, 2007). Therefore, address contact
information was also necessary. The only possible sampling frame with telephone and address data available were telephone directories, but using a telephone directory would have excluded members of the population who did not have fixed-line telephones and those with “unlisted” numbers. These groups comprised about 12% of the population in 1987, but the number has considerably increased since then, which may explain why only 70% of the addresses selected for Study 5 could be matched to a telephone number. Furthermore, unlisted households differ significantly from those found in telephone directories (Beukenhorst, 2012). Therefore, a sampling frame of addresses was chosen for Study 4. The research team selected 2,500 address from a list of postal addresses (Martin & Lynn, 2011). For the addresses where no telephone could be matched, contact with the household took place in person. This increased both complexity of fieldwork management and the costs, reducing the overall benefits of the design. The last-stage of the sampling procedure where the target respondent was identified matched the standard ESS sampling procedure in the Netherlands, so no additional challenges were met in relation to this procedure. However, this study shows the complex
relationship between different error sources, which multiplies exponentially when adding modes of data collection and countries.
Study 6 – Feasibility of mixed-mode designs across countries. Sampling in the ESS mixed-mode designs followed the same design procedures that were agreed for the main stage in Round 6 (Villar, Winstone, Prestage, & Lynn, 2014). In Estonia, there were no differences across mode designs in how the sampling design was implemented: a random sample of individuals was drawn from the same population register used for the main ESS, with explicit stratification by region and implicit
stratification by age and gender. Instead of an interviewer visiting the address available from the sampling frame, a letter was addressed to the named respondent with an invitation to take part in a web survey. The challenge was that a considerable proportion of the population had a different address from the one in the register. Addresses are easier to update when an interviewer visits the address than by just sending a letter, which suggests that a web survey alone could lead to higher nonresponse rates than a face-to-face survey amongst a rather specific group of the population due to noncontact. This raises the question of whether those for whom address information is incorrect differ systematically from those with correct information, creating a potential for nonresponse bias. In Sweden, the sampling frame, sampling design and first contact attempts were conducted identically in all mode designs, given that telephone contact is used in the standard Swedish ESS to make
replacement using a population register as sampling frame, which includes all individuals living in Sweden together with their contact information, including address and telephone number. Finally, in the UK, the sample design for the selection of addresses was identical across all mode designs: a stratified, clustered, random sample, drawn using the Postcode Address File (PAF). However, selection of the final respondent in households with more than one individual aged 15 or older differed. In the standard ESS, selection of the final respondent was done by the interviewer using a Kish grid (Kish, 1949), whereas in the mixed-mode sample this step was left to the target household themselves. Section 3.2 discusses in detail the implications of these approaches.
Within-household random selection of individuals
Some ESS countries have access to population registers that provide information about individuals and contact information, whereas others have to resort to using samples of addresses or area
probability sampling. When sampling frames that contain addresses are used, contact with the final respondent cannot take place until the selection of a person within the household has been carried out; sometimes, the sampled address contains more than one household and two selection procedures are necessary. Face-to-face data collection is especially useful to obtain a random sample in countries using sampling frames of addresses or areas, because one can train interviewers to implement these random selection methods. When interviewers are not involved, selection of the individual has to rely on the person in the household that receives the instructions. Research suggests that compliance from these individuals is less than perfect, because people are sometimes unable and other times unwilling to follow these instructions (Olson & Smyth, 2014; Olson, Stange, & Smyth, 2014). Therefore, in many countries, a change in mode of data collection can affect whether the final sample is actually a random sample of the population.
In Study 6 (Feasibility of mixed-mode designs across countries), recruitment of UK respondents started by sending an initial invitation to ‘the resident’. Two approaches were considered to complete the sampling frame and carry out within-household selection of the respondent: a) an interviewer-based within household selection procedure. Sampled addresses would be sent a letter with a description of the study and a free toll number to call if they were interested in participating in the online study. During the call, the interviewer would ask the household informant to describe the household composition, apply random selection procedures to identify the final sample unit, and ask the selected person to complete the web survey. b) A respondent-based selection procedure. Sampled addresses would be sent a letter with a description of the study, an explanation of why random selection is important and how to apply the procedure. In the end, the respondent-based approach was chosen, because we expected that very few household informants would actually call the toll free number to go through the selection procedure. Two respondent-based selection
procedures were tested: a) the last/next birthday method, where the eligible household member with the last (or next) birthday is invited to participate; this procedure has been described as ‘quasi-random’ (Gaziano, 2005), and b) the household roster method consisted on a few steps: first, a household informant followed the survey link provided in the letter; second, the informant was asked to list all household members 15 or older; third, a built-in algorithm carried out the random selection of one of the household members and this was communicated to the informant; last, if the selected member was someone other than the person completing the roster, the informant was asked to pass on the letter to that member. The household roster method is more intrusive than the birthday method, but it is truly random if instructions are followed correctly.
could be sent to them. Compliance with the birthday method was evaluated by checking whether the respondent had the birthday closest to the month of interview in the household, whereas compliance with the household roster method was evaluated by comparing the name provided at the end of the survey to the name or initials of the respondent selected from the household roster. Compliance tests proved to be challenging. In many instances, compliance could not be assessed because the necessary information had not been provided (e.g., month of birth for one of the household members, or the initials at the end of the survey) or because it could not be determined with certainty (e.g., two household members were born in the sample month, or two household members had the same initials). The birthday method led to noncompliance levels of 23% of the total sample. About a third of households only had one adult (therefore, no selection was necessary), in 17% cases it was not possible to determine compliance, and 27% cases were identified as compliant. Unfortunately, we could not appropriately evaluate compliance of the household roster method. Of those households with more than one adult, more than half did not provide either name or initials. Of the remaining respondents (n = 93), two thirds provided names that matched the selected respondent and one third provided a different name, but that may just signify that the name in the first instance was just a pseudonym or fake name.
We found no evidence of an association between the within-household selection method and response rates (39% with the birthday method, 37% with random selection; χ2 (2) = 3.37; p = 0.19).
Summary
Sampling in the existing cross-national face-to-face survey is already rather complex, with a mixture of samples of individuals, samples of households or addresses, and area probability sampling
(including random routes procedures) all being used. However, all these sampling frames are followed by visits to the address where, if necessary, an interviewer can complete the sampling process by applying procedures to randomly select a respondent from among all household members. Based on these ESS experimental studies, it seems that cross-national surveys switching to mixed-mode designs may need to either use new frames (and accept lower coverage in most cases), or use the existing frames and allow households to do their own selection. This could not only jeopardise quality or lead to reduced cost savings, but it may introduce even greater differences in sampling design across countries, potentially reducing comparability of the collected data.
Survey participation: response rates, nonresponse bias, and sample composition in
the ESS mid-mode studies
One of the expected advantages of adopting a mixed-mode data collection design rests on improving survey participation, either because more potential respondents end up taking part or because the final make-up of the realised sample of respondents is more similar to the target population than the respondents to the alternative single-mode design would have been. Different mechanisms for these differences in sample composition can be hypothesised (De Leeuw, 2005; Martin, 2011):
a) Sample units and target respondents might be easier to contact via some modes. In many European countries, letters and telephone calls are generally easier (or more tempting) to disregard nowadays than a personal visit to an address, due to the volume of contact attempts received through those channels of communication. Perhaps the same could be said of e-mail and pop on-liner survey requests. At the same time, in certain populations a personal visit may not be appropriate or well received.
b) Sample units may also be more likely to agree to participate depending on the mode of data collection. Some may prefer to complete the survey at their own time and pace or without an interviewer present and thus be more likely to agree to complete a
interviewer. Many may find it easier to refuse (ignore) a mailed or telephone request than an in-person request by an interviewer.
c) Some modes may be more accessible to certain populations than others. For instance, self-administered modes may not be appropriate for populations with low literacy levels (De Leeuw, 2005), and on-line surveys might not be accessible to the elderly or those on low incomes modes relying on telecommunications may not reach the entire target population in war zones.
Therefore, depending on the target population and the single mode that we are comparing the mixed-mode design to, survey participation may increase or improve when allowing respondents to complete the survey in an alternative mode. Given baseline levels of response rates, web and telephone surveys have the greatest potential for improved survey participation, and mail and face-to-face surveys have the least potential because they generally achieve high rates for that mode of completion, following well-established response maximisation strategies. In fact, there is no empirical evidence suggesting that mixed-mode designs can reduce nonresponse error with respect to face-to-face surveys (Dillman, Smyth, & Christian, 2009; Lynn, Uhrig, & Burton, 2010; Martin, 2011). Surveys with high response rates around the world tend to be conducted face-to-face, like the Labour Force Survey and the European Quality of Life Survey in many European countries, the National Health Interview Survey in the United States, and the British Crime Survey in the UK. Mandatory mixed-mode surveys can achieve response rates as high as face-to-face surveys (e.g., the American Community Survey in the United States or the Labour Force Survey in some European countries), but these are exceptional cases because, unlike most surveys, they are not voluntary. Therefore, we have no grounds to expect more people will agree to participate in the ESS if mixed-mode data collection is allowed. However, if response rates were not damaged substantially, measurement differences between modes were minimal, nonresponse bias did not increase and costs were reduced, mixed-mode data collection might be preferable on the grounds of cost-effectiveness. Therefore, it was still worth testing whether mixed-mode designs could be effectively implemented in the ESS to improve cost-efficiency. In addition, response rates to face-to-face surveys might see substantial droops in the future and this become prohibitively expensive in certain countries. This is what has made assessing the possible implications of introducing mixed-mode data collection so critically important. Four of the studies in the ESS mode programme of research (studies 2, 3, 4, and 6) evaluated the impact of mixed-modes on survey participation; we summarise their findings in this section.
Outcome rates
Survey participation can be measured using different outcome rates. Final response rates are a general way to assess and compare survey participation across studies; in addition, analysing different nonresponse components (e.g., refusals, noncontacts) provides insight into the mechanisms that explain the differences in survey participation across modes. We start this section discussing overall response rates and then focus on noncontact and refusal rates, comparing outcomes from the face-to-face standard main stage ESS to each alternative mode design. All outcome rates below assume that cases where eligibility could not be determined during fieldwork would have been eligible for participation5 in the survey (yielding rates similar to the American Association for Public Opinion Research Response Rate 1).
Response rates
5 Eligible sample units in the ESS are ‘all persons aged 15 and over (no upper age limit) resident within private
households in each country, regardless of their nationality, citizenship or language’ (for further details on how
eligibility of sample units is determined in the ESS see section 10.4 in the ESS Round 8 Survey Specification,
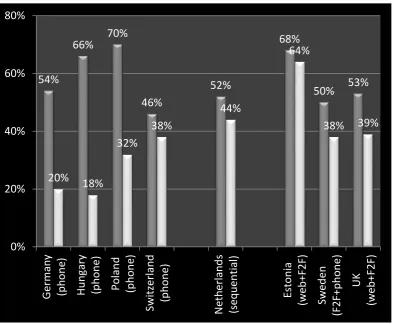
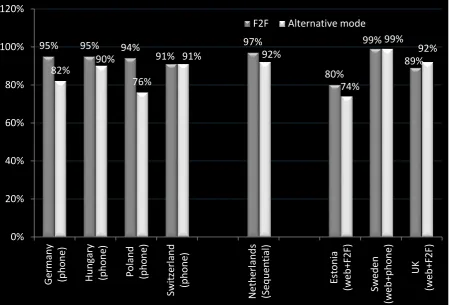
The percentage of all selected sample units that participated in the survey was lower in all mixed-mode designs compared to the main stage face-to-face ESS. Some of these differences were rather striking, like for most countries in Study 4 (Feasibility of ESS telephone interviews), where response rates were two to three times higher for the face-to-face survey than for the alternative telephone design (see Figure 16.). Even though these differences might in part be attributed to variation in the invitation protocol between the two mode designs (e.g., sample units assigned to the alternative mode received lower incentives or did not receive a pre-notification letter), it is unlikely that the large differences in response are entirely (or even mainly) due to those design differences.
The mixed-mode data collection designs of studies 5 (Feasibility of mixed-mode designs: sequential vs concurrent) and 6 (Feasibility of mixed-mode designs across countries) did better than the single alternative mode from Study 4 (Feasibility of ESS telephone interviews), but response rates were still lower than for the face-to-face standard ESS sample. In Study 5, the response rate in the standard ESS in The Netherlands was 52%, but was somewhat lower for the two alternative designs: 43% for the sequential design, 44% for the concurrent design (see Figure 16.), even though the recruitment process was carried out by interviewers, either by telephone or in person (Eva et al., 2010).
[image:14.595.74.469.352.676.2]In the UK, the web + face-to-face design implemented in Study 6 resulted in a response rate loss of 17 percentage points compared to the standard ESS (55%, see Figure 16.)6, in spite of the additional monetary incentive offered to web respondents conditional on completion (£15/£35 pounds, depending on the experimental condition).
Figure 16.1 Response Rates (RR1) for Studies 3, 4, and 6
6 Note that the mixed-mode experiment was conducted by a different fieldwork agency (NatCen) than the
standard ESS (IPSOS). NatCen had conducted the ESS before and since, but achieved a substantially lower response rate for the standard ESS in Round 7 than IPSOS achieved in Round 6.
The loss was much lower in Estonia, where the mixed-mode design achieved a response rate of 64%, only 4 percentage points lower than the standard ESS (68%, see Figure 16.). This is particularly striking as respondents completed the almost 1-hour long ESS survey, which suggests the length of the questionnaire on-line is not a barrier for web implementation, in Estonia at least. The response rate in the Swedish response-enhancing design (38%) was much lower than in the standard ESS design (50%). However, compared to the mixed-mode sample, additional resources (extra incentives and visits) were allocated to the standard ESS sample to try to achieve the highest possible response rate; therefore, the lower response rates may be partly due to this difference.
Overall, there were no apparent advantages from offering additional modes of data collection to respondents in terms of response rates. Response rates were low in all mixed-mode designs compared to the face-to-face design, although the Estonian experiment rates were similar to the face-to-face rate. However, the Estonian mixed-mode survey benefitted from a large internet penetration rate and a sampling frame with named individuals to whom a mailed invitation could be sent. It is doubtful whether these findings could be replicated in countries without these features.
Refusal rates
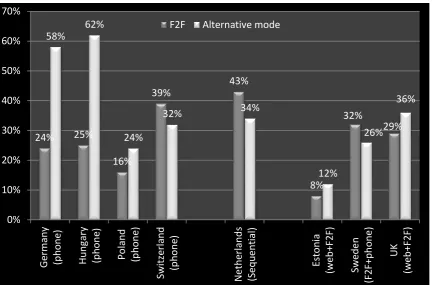
Results were mixed within and across studies when it came to refusal rates. Respondents were more likely to refuse to participate in the telephone survey than in the standard face-to-face ESS in Germany, Hungary, and to a lesser extent in Poland (Study 4, see Figure 16.). However, they were less likely to refuse telephone invitations compared to face-to-face invitations in Switzerland (Study 4) and Sweden (Study 6), both countries where telephone surveys are generally more prevalent than in other ESS countries. Similarly, the web + face-to-face designs led to higher refusal rates in Estonia and UK (Study 6) but not in the Netherlands (Study 5), where refusal rates for the face-to-face sample were quite high (43%) compared to only (34%) in the sequential mixed-mode approach. This
suggests that, in some countries, offering additional modes of data collection can persuade sampled individuals who would otherwise have actually refused to take part.
Figure 16.2. Refusal Rates for Studies 4, 5, and 6
Noncontact rates
In most countries and studies, differences in contact rates across modes were a lot smaller than refusal rates, with the exception of Germany and Poland (Study 4), where reaching sample units was
considerably more difficult when contact was made via telephone than in the standard ESS (see Figure 16.). Contact rates were also slightly lower for the alternative mode design in Hungary (Study 4), the Netherlands (Study 5) and Estonia (Study 6), but no differences were observed in Switzerland (Study 4) or Sweden (Study 6). Therefore, among the countries that participated in these studies, increased refusal to participate played a larger role in the lower response rates than lack of contact with respondents. 24% 25% 16% 39% 43% 8% 32% 29% 58% 62% 24% 32% 34% 12% 26% 36% 0% 10% 20% 30% 40% 50% 60% 70% Ge rm an y (ph o n e) H u n gary (ph o n e) P o lan d (ph o n e) Swit ze rla n d (ph o n e) N et h erla n d s (Sequ ent ial ) Est o n ia (w eb+F2 F) Swe d en (F2 F+ p h o n e) UK (w eb+F2 F)
Figure 16.3. Household Contact Rates for Studies 4, 5, and 6
Sociodemographic composition of realised samples and nonresponse bias
Outcome rates can help a researcher to understand why certain sample units are not part of the final, realised sample. However, nonresponse bias analysis is necessary to assess the extent to which nonresponse affects survey estimates. To assess nonresponse bias, one would ideally compare respondents to nonrespondents with respect to the variables of interest. However, this information is typically unavailable. For the ESS studies, we used an alternative approach where we compared the sample of respondents obtained with each mode design to estimates from the population with respect to a few socio-demographic variables, providing an assessment of the extent of nonresponse bias for those variables7.
In Study 2 (Measurement differences: Finding the cause), the face-to-face and telephone samples were compared with respect to five variables: age, gender, education, having a paid job, and
occupation (Jäckle et al., 2006). Telephone respondents included significantly fewer males (33% vs. 40%), fewer manual workers (25% vs. 36%) and fewer individuals with lower education (48% vs. 55%) than face-to-face respondents did. No differences were found for the age or in the proportion of respondents having a paid job. Population estimates for Lisbon and Budapest were not available, but on the basis that most populations in the world have a nearly even divide in the proportion of males
7 This comparison is not a ‘pure’ measure of nonresponse bias, given that the sampling frame and sampling
design can also affect the final response composition, and that the socio-demographic variables were
measured using different modes and somewhat different wording. Based on the rigorous sampling procedures followed in the ESS, and on the simplicity of some of the demographic questions we use, we assume here that most of the differences between the realised sample and the population estimates are due to nonresponse effects.
95% 95% 94%
91% 97% 80% 99% 89% 82% 90% 76% 91% 92% 74% 99% 92% 0% 20% 40% 60% 80% 100% 120% Ge rm an y (ph o n e) H u n gary (ph o n e) P o lan d (ph o n e) Swit ze rla n d (ph o n e) N et h erla n d s (Sequ ent ial ) Est o n ia (w eb+F2 F) Swe d en (w eb+ph o n e) UK (w eb+F2 F)
and females, it could be argued that the gender proportion in the telephone sample is probably more biased than in the face-to-face sample.
In Study 4 (Feasibility of ESS telephone interviews), we compared face-to-face samples to telephone samples in six socio-demographic variables: gender, age, education, being in paid work, occupation, and area of residence (Roberts et al., 2009). Countries differed on how similar the realised sample in the telephone survey was to the realised sample in the standard ESS survey. Respondents to the German telephone survey were less likely to be in paid work than respondents to the German face-to-face survey (42% vs. 53%), but the opposite was found in Hungary (65% vs. 42%). Years in
education and paid work differed significantly in almost all countries. In Germany, Poland, and Hungary, the telephone sample showed higher educational attainment than the face-to-face survey. The Hungarian samples showed the largest number of differences, for five of the six variables. The Swiss samples only differed significantly in percentage of the sample that was in paid work, but the difference was striking: 34% in the telephone survey compared to 62% in the face-to-face survey. Of particular concern here are the cross-national differences in how mode impacts the sample
composition.
In Study 5 (Feasibility of mixed-mode designs: sequential vs concurrent), samples were compared with respect to age, gender, urbanisation, size of household, occupation and educational level (Eva et al., 2010). In addition, data were compared to population estimates from Statistics Netherlands (Centraal Bureauvoor deStatistiek, 2008) in the first four of those variables. There were few differences between the composition of the face-to-face realised sample and the mixed-mode
alternatives: the mixed-mode samples included fewer women with low educational level (20.4%) than the face-to-face sample (23.4%), and more women of middle educational level, 21.4% in the
sequential deign compared to 17.1% in the face-to-face sample. However, these differences were rather modest.
Differences were larger when comparing the ESS standard and experimental samples to the population estimates. All ESS samples under-represented males under 45, females over 75, single person households, and people living in urbanised areas. The face-to-face sample was closer to the population values with respect to age and gender, and the concurrent sample differed most from the population estimates for all variables.
Comparing the face-to-face sample to those respondents from the sequential design that completed the web survey (the ‘web sample’) can provide a simulation of what would happen if the ESS were implemented as a web survey. In terms of sample composition, the web sample included fewer respondents over 65, especially among females (4.6% compared to 12.3% in the face-to-face sample), fewer men with higher education, fewer respondents from highly urbanised locations, fewer 1-person households and fewer retired respondents. Therefore, the web sample exacerbated the nonresponse bias observed in the face-to-face sample as compared to the population estimates rather than reducing it.
Study 6 – Feasibility of mixed-mode designs across countries. Comparing the profiles of the responding samples in each mode design with external population data, we found broadly similar distributions between the 2011 Census data in Estonia and the UK and the ESS samples, both from the face-to-face and mixed-mode designs (Villar et al., 2014). However, the mixed-mode sample showed greater bias relative to Census statistics than the face-to-face sample. In the UK, all samples attracted fewer respondents from the youngest and oldest age groups and more people looking after the home or family compared to the UK census data, but the difference was larger in the mixed-mode sample. In Estonia, only the mixed-mode sample under-represented people in paid work and those born outside Estonia, whereas the CAPI-only face-to-face sample was not problematic.
In line with previous research, evidence from these four studies suggests that mixed-mode data collection designs are unlikely to increase response rates or reduce nonresponse bias in survey estimates compared to data collected face-to-face. In fact, overall they suggest that response rates would decrease and nonresponse bias would probably increase. Participation was lower for the mixed-mode designs mostly because of higher refusal rates rather than because of lower noncontact rates, which suggests that respondents can be contacted using different channels but may still be unwilling to take part in an hour-long survey over the telephone or on the web, or find it more
difficult to refuse an in-person request from a persuasive interviewer. When there were differences in the composition of the realised sample, the sociodemographic profile of the face-to-face survey design was usually closer to the population estimates than the mixed-mode design.
Measurement error in the ESS mixed-mode studies
Multiple studies have found that collecting data in different modes can lead to measurement differences (e.g., Christian, Dillman, & Smyth, 2006; de Leeuw, 1992); the same respondent
answering the same question may give different answers depending on whether the question is asked in person, over the telephone, on a web browser or on paper. In fact, in-person surveys sometimes switch to self-administered modes for sections asking sensitive questions (Couper, Tourangeau, & Smith, 1998; Tourangeau & Smith, 1996), on the grounds that reporting will be more accurate that way. However, it is less clear whether data collected from respondents who answer in different modes should be combined to compute survey estimates. If modes can attract respondents with different characteristics (e.g., a survey conducted via SMS may attract younger people compared to a face-to-face survey), any observed differences between those groups could be due to measurement differences related to mode, rather than to actual differences related to the variable of interest. This could in turn affect interpretation of survey findings. Similarly, if countries in a cross-national survey collect data using different modes, differences in survey estimates for each country could be related to actual differences in those estimates or to differences in how respondents answered to the specific mode of data collection. Therefore, the question of measurement differences across modes is of the utmost importance for cross-national research.
Multiple factors can help explain measurement differences across data collection modes (De Leeuw, 2005; Tourangeau, Rips, & Rasinski, 2000). From the start, the ESS mixed-mode research
programme paid special attention to measurement effects to better understand these mechanisms. Three of the ESS studies investigated the effect of mode on estimates by designing experiments that allowed disentangling these effects from the other sources of error like nonresponse, coverage or processing. Observed differences in estimates can thus be attributed to the effect of mode on
measurement. In the feasibility studies, observed effects can be due to differences in the composition of the realised sample or to differences in measurement. However, applying different approaches, one can try to account for selection effects and gain insight by comparing survey estimates across modes in those studies. In addition, measurement effects may also be assessed by observing respondent behaviour across groups of items. For example, item nonresponse, acquiescence (the tendency to agree with survey statements), and nondifferentiation of response options have often been used to assess measurement effects (e.g., Schuman & Presser, 1981). In this section, we will evaluate the effects of mode on univariate estimates, on multivariate estimates, on response behaviours and on data quality. Survey errors are item- and statistic- specific (Groves, 1989): mode effects might be found in univariate estimates of one variable (such as averages and percentages) and yet leave estimates of other variables or multivariate estimates including that variable unaffected. For a survey programme like the ESS, an important concern was the effect that switching mode designs would have across different questions, estimates, and multivariate analyses that data users may want to carry out. Furthermore, it is important to evaluate how mode effects could affect the interpretation of changes observed across time.
Effect of mode on univariate estimates: measurement studies
In two of the studies (1 and 3), respondents answered the same set of questions in two different modes. In both studies, the percentage of respondents who gave the same answer on both occasions was relatively low. In study 1, the percentage of identical answers ranged from 52% for the income question to 76% for self-reported belonging to a discriminated group. In Study 3, the average matching percentage across all attitudinal questions was 52%, ranging from 28% in a question about the effect of immigrants on cultural life of a country, to 70% matching for questions about perception of different types of crime. Behavioural questions led to higher levels of matching, ranging from 38% to 98%. Attitudinal questions (which are prevalent in the ESS) showed lower average consistency than behavioural questions, in line with previous research. Nonetheless, some of the differences between attitudinal and behavioural questions could be related to other formal differences between the questions like the number of response options. For example, 4 out of the 11 attitudinal questions had 11-point answer scales. It would be reasonable to expect that the larger the number of response options, the easier it will be for respondents to provide a different answer on two occasions, partly because the meaning of the two scale points may become closer. Questions with more response options indeed exhibited lower consistency across the two modes, and this was true both for attitudinal and behavioural questions (Jäckle et al., 2006).
Study 2 (Measurement differences: Finding the cause) investigated the mechanism behind
measurement differences between telephone and face-to-face data collection. Comparing response distributions of 33 items across the three experimental groups (telephone, face-to-face with
showcards, and face-to-face without showcards), 17 of the 33 items were affected by mode of interviewing after controlling for differences in sample composition due to age, gender, educational qualification and occupation. In 12 cases, telephone estimates were different to face-to-face
estimates, but no differences were observed between the two face-to-face versions (with vs. without showcards), implying that mode differences were not driven by the questionnaire adaptation for telephone mode related to the sensory channel through which the response options were conveyed, but to other mechanisms related to mode (Jäckle et al., 2006). In all but one case (household income), the observed mode effects were comparatively small (no greater than one standard error) and would be unlikely to affect the conclusions of analysts using mixed-mode data.
Effect of mode design on univariate estimates: feasibility studies
For each feasibility study, large numbers of items were compared across mode designs. The goal was to estimate the proportion of ESS questions that would be affected if mixed-mode designs were allowed. The proportion of significant differences varied across studies8, but in all cases and mode designs it was higher than what would be expected by chance alone. Out of the 43 wellbeing variables analysed in study 4, 31 (72%) showed statistically significant differences across the two samples, and a further 4 were marginally significant. This finding was replicated when each country was analysed separately, although fewer of the differences were significant given the smaller sample sizes. In the feasibility study conducted in the Netherlands (study 5), we compared estimates for 230 items as measured using the standard ESS face-to-face approach to the mixed-mode sequential design
8 In each study, an appropriate regression model was fitted for each item, with the survey item as the
dependent variable and a dummy variable ‘survey design’ as the independent variable, where ‘survey design’ was coded ‘1’ for cases from the mixed-mode sample, and ‘0’ for cases from the face-to-face survey. The regression model differed depending on the measurement level of the item: for questions with 6-point-scales, 11-point questions or ratio-scale measurement, we used ordinary least squares regression; for questions with 4- or 5-point scales and other ordinal scales, we used ordinal logit regression; for dichotomous items, we used logistic regression; and for nominal items, multinomial regression. Data were weighted, using weights inversely proportional to selection probability, and the ‘svy setup’ command in STATA was used to compute
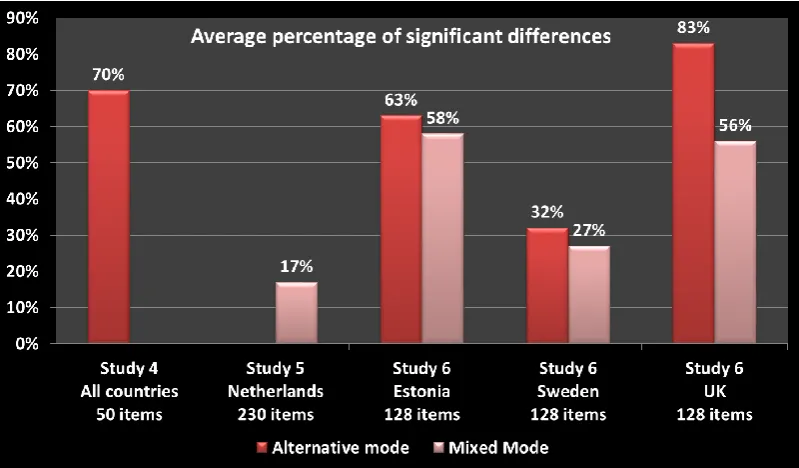
and the mixed-mode concurrent design. The concurrent mixed-mode sample featured differing distributions in 25 items (11%), whereas in the sequential mixed-mode sample 38 items (17%) had distributions significantly different from the face-to-face sample. Finally, in study 6 we compared distributions of 128 questions across mode designs. Mode effects were present in numerous questions for all countries and across all mode comparisons. Effects were larger when comparing web and face-to-face in Estonia (63%) and the UK (83%) than when comparing telephone to face-face-to-face data in Sweden (32%, see Figure 16.). This may be partly due to the smaller Swedish sample, but differences between face-to-face and the alternative mode (telephone) were smaller overall in Sweden than in the other countries.
[image:21.595.73.473.328.562.2]Significant differences were more common when comparing respondents to two single different modes (e.g., web vs face-to-face) than when comparing mixed-mode designs to face-to-face (see Figure 16.). Differences were also largest for estimates of personal wellbeing, followed by questions from the core ESS questionnaire about political attitudes, political participation and attitudes towards immigrants. These are some of the most frequently used items on the ESS according to ESS user statistics (http://www.europeansocialsurvey.org /about/user_statistics.html) and bibliographic studies (Malnar, 2015).
Figure 16.4. Percentage of variables showing significant differences across modes
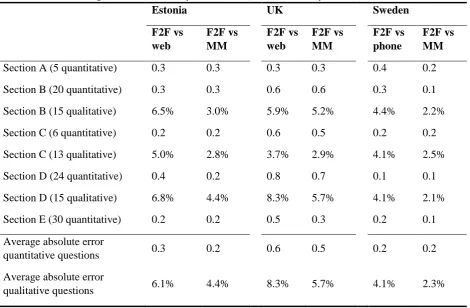
To estimate the size of the differences, the average absolute difference between mode designs was computed for different sections of the questionnaire and different types of questions in study 6 (see c)9. Differences between the face-to-face data and the alternative mode designs were moderate but non-ignorable, ranging from 2.1 to 8.3 percentage points for categorical variables. The smallest difference was found when comparing estimates on questions about wellbeing in Sweden, in striking contrast to the large differences in these questions between web and face-to-face in the UK and
9 For questions with 6-point, 11-point, or ratio answer scales, the difference between the means was
Estonia (see row 7 in Table 16.). Coincidentally, these comparisons also reflected the smallest and largest differences for the quantitative questions.
Table 16.3. Average absolute error by section, mode, and country
Estonia UK Sweden
F2F vs
web
F2F vs MM
F2F vs web
F2F vs MM
F2F vs phone
F2F vs MM
Section A (5 quantitative) 0.3 0.3 0.3 0.3 0.4 0.2
Section B (20 quantitative) 0.3 0.3 0.6 0.6 0.3 0.1
Section B (15 qualitative) 6.5% 3.0% 5.9% 5.2% 4.4% 2.2%
Section C (6 quantitative) 0.2 0.2 0.6 0.5 0.2 0.2
Section C (13 qualitative) 5.0% 2.8% 3.7% 2.9% 4.1% 2.5%
Section D (24 quantitative) 0.4 0.2 0.8 0.7 0.1 0.1
Section D (15 qualitative) 6.8% 4.4% 8.3% 5.7% 4.1% 2.1%
Section E (30 quantitative) 0.2 0.2 0.5 0.3 0.2 0.1
Average absolute error
quantitative questions 0.3 0.2 0.6 0.5 0.2 0.2
Average absolute error
qualitative questions 6.1% 4.4% 8.3% 5.7% 4.1% 2.3%
Effect of mode on multivariate estimates
Effect of mode design on multivariate estimates: feasibility studies
A number of statistical models involving political attitudes were tested in Study 5 (Martin & Lynn, 2011). In all the models tested, some model parameters differed across mode designs: when looking at political interest, just two out of sixteen examined variables showed a significant interaction effect with data collection design. However, when political interest is used as a predictor variable, there were significant differences in several models. The study suggested caution when comparing models from surveys carried out with different data collection designs (Martin & Lynn, 2011).
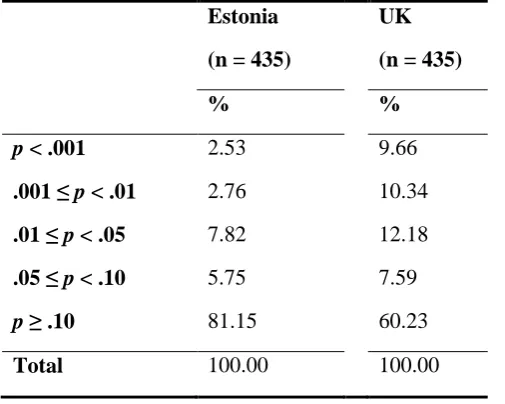
Table 16.4. Significance of the difference in correlations across mode designs
Estonia (n = 435)
UK (n = 435)
% %
p < .001 2.53 9.66
.001 ≤ p < .01 2.76 10.34
.01 ≤ p < .05 7.82 12.18
.05 ≤ p < .10 5.75 7.59
p ≥ .10 81.15 60.23
Total 100.00 100.00
Finally, using studies 5 and 6, data quality for each mode design was compared using sets of questions measuring various concepts (Revilla, 2010, 2013). Overall, there were small differences across the three mode designs in terms of reliability and validity, and those differences did not show any one mode having consistently higher quality. The largest difference was found in quality of the political trust concept, where the face-to-face survey showed higher validity than the mixed-mode designs.
Effect of mode on response behaviours: item nonresponse, acquiescence, non-differentiation, and other response behaviours
In this section, we review findings from the measurement studies about the impact of mode on how respondents answer questions. A variety of response behaviours have been used as measures of data quality: item nonresponse, response styles such as acquiescence, and tendencies to select the same response option regardless of the real answer (e.g., extreme response style, nondifferentiation).
Effect of mode on response behaviours: measurement studies
Item nonresponse. In Study 1 (Measurement differences across four modes), significant differences in item non-response were found for half of the 38 questions analysed. Item non-response rates were highest for self-completion (paper) mode in 12 questions. For the remaining 7 questions, item non-response was significantly higher among telephone respondents compared to other modes. In Study 2 (Measurement differences: Finding the cause), item nonresponse rates were similar across the three groups; however, respondents interviewed face-to-face without showcards had higher overall item nonresponse rates, and significantly higher item nonresponse to the income question, with almost double the proportion of refusals than the telephone group. In Study 3, item nonresponse was again low in both modes, but selecting don’t know, refusal, or no answer to the 35 analysed questions was more likely on the web than to-face, even though the web survey was much shorter than the face-to-face interview.
Non-differentiation, extreme response style, acquiescence, and order effects. In Study 1,
In Study 2 (Measurement differences: Finding the cause), telephone respondents were just as likely as face-to-face respondents to acquiesce, repeat the same response option across questions, and select the first or last options. This suggests that showcards had little effect on data quality. Similarly, there was no evidence of increased non-differentiation or increased acquiescence among telephone respondents compared to the face-to-face respondents who were not given showcards. However, when comparing face-to-face interviews with showcards to telephone interviews, non-differentiation is significantly higher in the latter; potentially, not having the interviewer be physically present and not having showcards has a cumulative effect leading to higher non-differentiation (Jäckle et al., 2006).
Effect of mode on response behaviours: feasibility studies
Item nonresponse. Across all feasibility studies, item nonresponse was generally low in all modes, as it was in the standard ESS conducted face-to-face. Study 4 (Feasibility of ESS telephone interviews) found that item nonresponse was significantly higher in the standard face-to-face survey than in the telephone survey, although this difference was small. In Study 5 (Feasibility of mixed-mode designs: sequential vs concurrent), item nonresponse was very low in all groups and all modes, but slightly higher in face-to-face (4.3 ‘don’t knows’ and 4.7 refusals per interview on average) than telephone (2.8 ‘don’t knows’ and 2.9 refusals per interview on average) and web (0.1 ‘don’t knows’ and 0.2 refusals per interview on average). In Study 6 (Feasibility of mixed-mode designs across countries), there was higher item nonresponse in the mixed-mode design than in the standard ESS but showed opposite directions in the UK (higher for web respondents) and Estonia (higher for face-to-face respondents). The differences across countries in efficiency of the different mode designs underline how mixing modes in different ways could be problematic for cross-national comparisons.
Furthermore, changes over time within a country could also cause difficulties.
Non-differentiation, acquiescence, response option positional preferences. In Study 6 (Feasibility of mixed-mode designs across countries), the proportion of respondents who selected the same response option in sets of items that shared the same answer scale was, in general, similar or lower in the overall mixed-mode design than in the standard ESS. When looking at respondents by mode, there was reassuringly no evidence of higher straight-lining among web respondents.
Mode, interview length and interview experience
In Study 2, interviews conducted by telephone were significantly (although slightly) shorter than those conducted in person (15.3 vs 17.5 minutes). In Study 4, actual duration was about 8 minutes shorter by telephone than face-to-face than when it was over the telephone for all countries but Poland, where interestingly it was 4 minutes longer.
Regardless of telephone surveys being seemingly shorter than face-to-face surveys, previous research (e.g., de Leeuw, 1992; Holbrook et al., 2003) and common sense suggested that an invitation to carry out the hour-long ESS survey would yield lower response rates than a face-to-face request for several reasons (see Groves, 1990 for a review of the possible mechanisms behind this difference).
for any of the three versions of the telephone survey in all countries. Even when considering only the 30-minute interview, cooperation rates were better in the face-to-face design than the telephone design in all countries except Switzerland.
In Study 2, 69% of respondents when asked whether they would be willing to continue the interview for longer, telephone respondents were more likely to be willing (69%) than face-to-face respondents (60%). It is not clear whether that willingness would turn into higher or lower response rates if the interview indeed continued, especially when less than half of the respondents to the 30-minute interview in Study 4 completed the second part of the survey.
A number of questions were asked in Study 2 to evaluate respondents perception of the survey experience. Face-to-face respondents were more likely than telephone respondents to report that they had felt uneasy about answering certain topics. However, respondents who felt uneasy were also more likely to report having answered truthfully. Based on answers recorded by the interviewer, telephone respondents were less likely to ask for clarification, less likely to be reluctant to answer, more likely to answer questions to the best of their ability and more likely to have understood the questions. It is unclear how accurate these interviewer perceptions were, especially when telephone interviewers had considerably fewer cues to base their assessments on.
Summary
This section highlights that mode does indeed have some impact on how respondents answer questions. It is not always clear which mode is best in terms of quality, but the differences between modes have the potential to damage comparability. Mode-related differences in a country’s estimates across time could confound comparisons within and across countries. The ESS, as well as other cross-national projects, has built a time series using face-to-face data collection, and this single-mode design is likely to continue in some countries where other mode designs would not be optimal (or even possible). This has implications for the usage of ESS data, which are publicly and freely available. Advanced data users familiar with the ESS may quickly note and try and account for these changes, but few reliable methods are available to allow for mode-difference correction (Vandenplas, Loosveldt, Beullens, & Vannieuwenhuyze, 2014). Data users less acquainted with the ESS
procedures and history may miss the switch in mode design altogether, and thus proceed analysing the data as if no mode effects were present.
The possibility of shortening the ESS questionnaire to facilitate completion in other modes has been discussed during the mixed-mode methodology programme. Offering a 45-minute questionnaire rather than 60 minutes could be beneficial for the telephone mode whilst administering two 30-minute sections would be damaging to the response rate. However, contrary to expectation, the 60-minute web survey did not appear to be a problem in Estonia in Study 6. The large web participation levels in Estonia and moderate participation levels in the UK suggest that long surveys can be conducted using self-administered modes. Nonetheless, the one-hour standard ESS face-to-face survey gets the highest cooperation compared to any single mode and to most mixed-mode designs.
Costs in the ESS mixed-mode studies