ISSN: 2502-4752, DOI: 10.11591/ijeecs.v10.i3.pp890-896 890
Thermal Effect of Wind Generation on Conventional Generator
in a Microgrid
Azmi Hashim1, Kwok L Lo2
1Electrical Section, Universiti Kuala Lumpur BMI, Malaysia
2Department of Electronic and Electrical, University of Strathclyde, United Kingdom
Article Info ABSTRACT
Article history: Received Jan 10, 2018 Revised Mar 2, 2018 Accepted Mar 21, 2018
In order to reduce CO2 emissions, which is one of the key strategy in combatting global warming, development of wind energy technology as source of renewable energy has become more important globally. However, the variability of the wind speeds leads to the intermittent nature of wind power generation. The conventional generators in the system must be able to compensate this fluctuation to maintain system stability and meet the load demand in the grid. This in turn may increase the temperature of the conventional generators beyond what normally occurs without wind generation in the grid. The aim of the paper is to inestigate the effect of thermal heating of the generators due to the variable output of wind generation in different time of the year in a microgrid by proposing proper modelling in the simulation. The simulations are done in 24 hours period in four different time of the years corresponding to different seasons of the year.
Keywords: Heating Microgrid Wind turbine
Copyright © 2018 Institute of Advanced Engineering and Science. All rights reserved.
Corresponding Author: Azmi Hashim,
Electrical Section,
Universiti Kuala Lumpur BMI,
Jalan Sungai Pusu 53100 Kuala Lumpur, Malaysia. Email: [email protected]
1. INTRODUCTION
As one of the alternative of the renewable energy technology, wind turbine is now not only the most economic, but also benefit us socially and environmentally. The global generation of wind energy increased up to 435 GW in 2017, which is nearly 10% of overall world power generation [1]. In EU, wind energy has produced more capacity than coal power and accounts for nearly one fifth of installed power generation capacity in 2016 [2]. The result of global community pushing towards better environment through better ways of producing energy has produced many technological breakthrough that not only increase more renewable energy production, but also lower its generation cost.
However, there are still challenge that need to be met to fully utilised wind energy potential. Chief amongst them is the fact that wind energy varies according to the speed of the wind. The variability of the grid connected wind power generation can be absorbed by the conventional power generators, but as the penetration of the wind capacity increased, rigorous studies and research must be done to anticipate and find solutions to the problem that might occurs [3].
The fluctuation of the wind generation could increase the temperature of the existing thermal generators beyond normal operating temperature [4]. As the wind generation varies throughout the time, the conventional generators need to act to compensate to meet the energy demand. This action will increase the temperature of these machines. The effect increased with the increased penetration of wind energy in the grid.
from four different times of the year are used. The results from the simulation are then analysed and discussed in order to investigate the thermal effect of the wind energy fluctuations to the conventional generator. A microgrid where renewable energy is connected are more vulnerable to the intermittent nature of wind generation as the burden of compensating it will be largely fall upon the conventional generators in the system.
2. WIND ENERGY
2.1. Wind Speed
One major characteristics of wind in any parts of the world is the changing patterns of its speed in different time of the year, or month, or season or day [5]. The speed is also varies according to different parts of the world geographically [6]. Although seasonal variations is more predictable than long term, year or decades variations, ther is also variations within a day or diurnal variations [7]. Shorter variations in minutes or even seconds, turbulences, also must be considered in studying the design and performance of a wind farm. Therefore in order to be able to predict or estimate wind energy production, it is important that this phenomenon be analysed and understood.
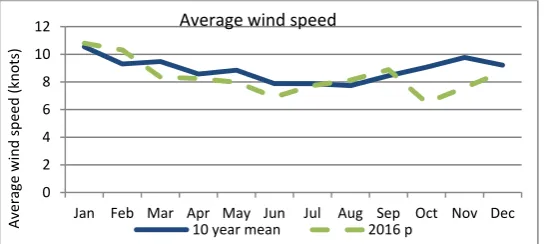
[image:2.595.170.444.357.479.2]As the wind speed changes according to the nature, the wind energy generation follows according to the speed change, instead of reacting to the energy demand as do the conventional generators. Figure 1 shows the 10 years average speed of wind in UK from 2002-2011[8] . In this example, the wind speed during the summer is noticeably slower than it is during the cold winter season. Although monthly pattern generally follows the trend of energy demand in UK where higher demands of energy are in the winter months, the wind speed patterns do not mirror the daily electrical demand [9].
Figure 1. Ten years average UK wind speed from 2002-2011 and 2016
Although year to year variations are hard to predict and not well understood, the seasonal yearly variation can be presented in terms of probability distribution [10]. Wind speed characteristics during a period of time is shown to be following certain probability distribution called Weibull probability distribution [11]. It is govern by the following equation:
, , , 0
0, 0 (1)
where v is the wind speed, k is the shape parameter that gives form of the distribution; usually lies between 2 and 3, and λ is the scale parameter which indicates the width and peak location of the distribution. Rather than observing the changes of the wind speed by its mean value, the Weibull distribution let us to examine its whole characteristics [5]. As shown later in table 1, the values of k and λ varies throughout the year, ranging from 2.08 to 2.53 for k and 11.52 knots to 16.25 for λ.
2.2. Wind Energy Generation
The power output of a given wind turbine can be expressed by the following equation:
1
2CP , (2)
where Po is the power harvested from the wind, Cp is the power coefficient of the turbine, λw is the tip speed ratio, β is the blade pitch angle, R is the wind turbine radius,V is the wind speed and ρ is the air density. The
0 2 4 6 8 10 12
Jan Feb Mar Apr May Jun Jul Aug Sep Oct Nov Dec
Average
wind
speed
(knot
s)
Average wind speed
Indonesian J Elec Eng & Comp Sci, Vol. 10, No. 3, June 2018 : 890 – 896
power coefficient is a function of λw and β [12]. Cp is the proportion of amount of wind energy can that extracted, which has upper limit of 59% theoretically. Currently, modern wind turbines have values between 45% to 50% [13]. As the power produced is directly proportional to the cube of the wind speed, any change in the speed will greatly affected the power output of any wind generator [14].
3. RESEARCH METHOD
3.1. Thermal Effect Calculation
In any generators, heating effect must always be taken into consideration as it will not only determine the operation of the generators but also the lifespan of the machine.
The heating effect of a generator comes from the excitation current If and also stator current I. According to [15][16], the thermal energy W is given by the following equations:
W T B T N E T N I X 2T N N EIX cos π
2 δ φ 3
where Tk is the proportionality constant relating W and Be2 , Be is the resultant flux density, Is is the stator current, Na and Nf are number of turns in the windings, Xd is the synchronous reactance, E is the no-load voltage, δ is the rotor angle and φ is the power factor.
The equation can be re-arranged to give:
W q A (4)
where [A]T = [a1 a2 a3], [q]T = [q1 q2 q3] and a T N , a T N , a N N T
q E , q I X , q 2EIX cos π
2 δ φ
As the heat produced by the generator increase its temperature, it is dissipated through the surrounding. If the rise of temperature between operating condition T and no load temperature Ts is T-Ts, and α is the transfer index for temperature and heating, therefore the following equation can be used to find the rate of increasing temperature.
H (5)
H is the thermal inertia constant. The typical value of Ts is 40°C. As the temperature (dy/dt) does not change in steady-state condition, then
when 0, ; when ∞,
Substituting T0 and T∞ into (5), then
(6)
The equation is used in the simulation to calculate the temperature of the machine where α = 1/300 MW/°C, H/α = 600 s, H = 2 MW.s/°C, Xd ≈ Xad = 1.305 pu, [A] = [9.1α, 33.2α, 17.4α] [15].
3.2 Cooling System Calculation
All conventional thermal generators need to dissipate the heat generated by its machine core. This is the function of its cooling system. Main methods of cooling are once through systems, wet recirculating or closed-loop systems and dry cooling.
The heat absorbed by the cooling water flowing through the length dx of the generators is given by the following expression [4]:
, (7)
where S1 is the perimeter of transversal section of waterway, W is the cooling water mass rate, Cw is the specific heat of cooling water at constant pressure and dTw is the difference of water temperature of length dx. Also:
0.023 . . (8)
where αc is the convection coefficient of water, Kw is thermal conductivity of water; DH is the equivalent hyd raulic diameter of waterway; Re is Reynolds number, Pr is Prandtl number. Both respectively are given by:
, (9)
At steady state,
, , (10)
As both sides of the equation integrated over Tw and x, we get:
(11)
When x = Lc, Tw = Tout, so:
(12)
In the simulation, data from [4] are used where W = 25.5kg/s, Cw = 4.1813x10³kg.K/J, Kw = 0.6 W/m/K, μ = 8.01 x 10⁻⁴ Pa-s, T
in = 45°C, Lc = 12m.
3.2. Simulation
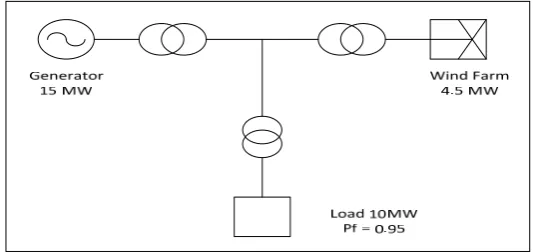
[image:4.595.170.437.571.697.2]The simulation was done using Matlab and Simulink software. The microgrid consists of a 15MW conventional synchronous generator and 4.5MW windfarm connected in parallel to a load through transmission line. The load is residential of 10MW, 0.95 pf. The generator acts as the base generator. The wind farm model is a simplified model that follows linear relationship with the wind. It will trip from the grid when the wind speed go beyond maximum permissible wind value, and reconnect when it go below it. The diagram of the system is shown in Figure 2.
Figure 2. Microgrid sytem in the simulation
Indonesian J Elec Eng & Comp Sci, Vol. 10, No. 3, June 2018 : 890 – 896
[image:5.595.180.425.156.274.2]speed at 10 seconds interval according to Weibull distribution function. The simulations were run continuously for twenty four hours with constant load. The power generated by the windfarm and conventional synchronous generator were observed and the temperature of the machine and its water cooling were calculated.
Figure 3. 24 hours hourly wind speed data for Plymouth
Table 1. Values of k AND λ for different seasons at Plymouth Weather Station
Season k λ
Winter (DJF) 2.1 16.25
Spring (MAM) 2.4 13.83
Summer (JJA) 2.53 11.52
Autumn (SON) 2.08 13.73
4. RESULTS AND ANALYSIS
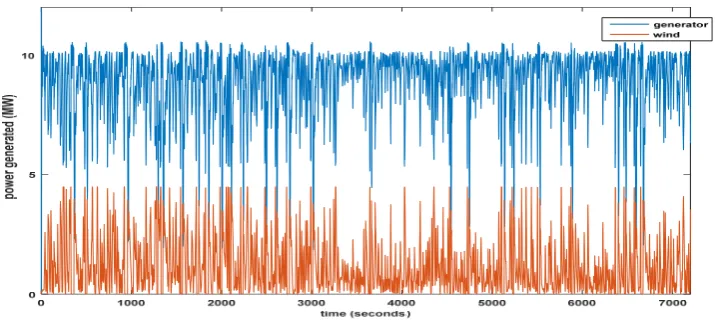
As the wind power generation varies according to the variability of the wind speed, the synchronous generator adjust its power output to meet the demand. The graph in Figure 4 shows both generators output during the first two hours of the simulation during the winter day.
Figure 4. Wind generation output and conventional generator output at 00:00 to 02:00
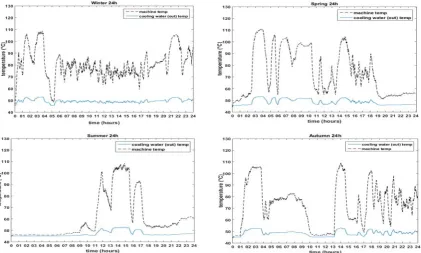
The results of the machine temperature rise and its coolant are shown in Figure 5. The graph shows the fluctuation of the temperature of the machine in the period of 24 hours at different times of the year. As the wind speed and wind generation in the system fluctuate, the synchronous generator need to compensate the total generation to meet the demand. The machine temperature increased (and decreased) as a result of this.
This results are then compared to the machine temperature when there is no wind generation in connection. Although the generator has to meet all the demand by itself, hence works closer to its full
0 10 20 30 40 50
0:00 4:00 8:00 12:00 16:00 20:00
wind
speed
(km/h)
25‐Jan‐16 07‐Apr‐16
[image:5.595.124.482.472.632.2]capacity, there is no significant temperature rise in the core of the machine in comparison with all the other, which remains stable at around 50°C throughout the simulation.
Figure 5. Machine and cooling water temperature at different time of the year
According to the calculation, the mean generator temperature for the day in winter, spring, summer and autumn is 80.5°C, 74.1°C, 60.7°C and 73.4°C. The higher temperature in the winter is due to more changes and fluctuation of wind speed during the winter day. It can be seen from the graph that the increase of the machine temperature can increase even though it is generating less power than usual. For example, the average temperature of the conventional generator during winter day is more than during the summer day, although more power can be generated by the wind farm during winter.
5. CONCLUSION
The paper discuss the effect of wind power fluctuation to the heating of conventional generator in a microgrid. The temperature increase in the machine and the cooling water can be analysed after simulation of the microgrid is carried out using the method discussed.
The result of the simulation shows that there will be increase in the machine temperature as the wind generation fluctuate according to the nature of the wind speed. The rate of temperature increase also differs according to different values of k and λ of the wind speed, which differs according to different time of the year in four season weather.
Further studies need to be done in a bigger grid system to investigate this effect at different level of wind energy penetration. Also, a variable load corresponding to variable energy demand can also be incorporated in the future simulation to analyse the combine effect of the changes of the wind power generation and the load demand.
REFERENCES
[1] GWEC, “Global Wind Report 2016,” p. 76, 2017.
[2] Wind Euro, “Wind in power 2016 European Statistics,” EWEA Eropean Stat., no. February, pp. 1–12, 2016. [3] Y. Zhang, H. Zhang, D. Yao, and Q. Li, “Research on the Wind Power Penetration Limit in Power System,” vol.
11, no. 8, 2013.
[4] P. Shi, “Thermal Effect of Intermittent Generation on Conventional Generator,” System, no. 1, 2009.
Indonesian J Elec Eng & Comp Sci, Vol. 10, No. 3, June 2018 : 890 – 896
Hawksbay ,” TELKOMNIKA Indonesian Journal of Electrical Engineering, 2013; 11 (7): .
[7] N. Earl, S. Dorling, R. Hewston, and R. Von Glasow, “2010-1980 Variability in U.K. surface wind climate,” J. Clim., vol. 26, no. 4, pp. 1172–1191, 2013.
[8] UK Department of Energy and Climate Change, “Average wind speed and deviations from the long term mean (ET 7.2),” Energy Trends Sect. 7 Weather, no. June, p. 2017, 2017.
[9] G. Sinden, “Characteristics of the UK wind resource: Long-term patterns and relationship to electricity demand,” Energy Policy, vol. 35, no. 1, pp. 112–127, 2007.
[10] T. Burton, D. Sharpe, N. Jenkins, and E. A. Bossanyi, “Wind Energy Handbook.pdf.” 2001.
[11] Y. Zhou and S. J. Smith, “Spatial and temporal patterns of global onshore wind speed distribution,” Environ. Res. Lett., vol. 8, no. 3, p. 34029, 2013.
[12] A. Kalmikov and K. Dykes, Wind Power Fundamentals. Elsevier Inc., 2010.
[13] J. Shi and E. Erdem, Estimation of Wind Energy Potential and Prediction of Wind Power. Elsevier Inc., 2017. [14] H. M. El_ Zoghby and S. M. Sharaf, “Dynamic Response of a Grid Connected Wind Farm with Different Types of
Generators,” International Journal of Power Electronics and Drive System (IJPEDS), 2011; 2(1): 85-98.
[15] S. S. Choi and X. M. Jia, “Under excitation limiter and its role in preventing excessive synchronous generator stator end-core heating,” IEEE Trans. Power Syst., vol. 15, no. 1, pp. 95–101, 2000.
[16] W. R. Lachs and D. Sutanto, “Rotor heating as an indicator of system voltage instability,” IEEE Trans. Power Syst., vol. 10, no. 1, pp. 175–181, 1995.
[17] “Plymouth, United Kingdom | Weather Underground.” [Online]. Available: https://www.wunderground.com/weather/gb/plymouth/50.36999893,-4.13999987. [Accessed: 18-Aug-2017].
[18] S. E. George, “United Kingdom Windspeed - Measurement, Climatology, Predictability and Link to Tropical Atlantic Variability,” University College London, 2006.
BIOGRAPHIES OF AUTHORS
Azmi Hashim – Electrical Section, University Kuala Lumpur – BMI, Malaysia
A. Hashim received his Bachelor of Electrical Engineering from the University of Sheffield, UK and his M.Sc in Electrical from Universiti Teknologi Malaysia, Malaysia. He is now doing his research study at University of Strathclyde. His research interest include power system analysis and distributed power system.
Kwok L. Lo - Department of Electronic & Electrical Engineering, University of Strathclyde, Glasgow, UK