Q
U A R T E R LY
E
C O N O M I C
C
O M M E N TA R Y
Spring 2008
A
LANB
ARRETTI
DEK
EARNEYM
ARTINO’B
RIENThe forecasts in this Commentary are based on data available by end-February 2008
Special Article
The Decline of the Computer Hardware Sector: How Ireland Adjusted
by
Frank Barry and Chris Van Egeraat
Copies of this paper may be obtained from The Economic and Social Research Institute (Limited Company No. 18269). Registered Office:
Whitaker Square, Sir John Rogerson’s Quay, Dublin 2.
www.esri.ie
Price €75 per copy or €300 per year, (including Medium-Term Review, 2005-2012)
Alan Barrett is a Senior Research Officer, Ide Kearney is a Research Associate and both are Editors of the Commentary, Martin O’Brien is a Research Assistant at The Economic and Social Research Institute (ESRI). Frank Barry is Professor of International Business and Development at the School of Business, Trinity College, Dublin. Chris Van Egeraat is a Research Fellow, Department of Geography, NUI Maynooth and National Institute for Regional and Spatial Analysis.
The Commentary and Article contained within have been accepted for publication by the
Institute, which is not responsible for either the content or the views expressed. Draft completed 7 March 2008.
Call For Papers
As part of the remit of the Quarterly Economic Commentary, articles on various aspects of the Irish economy and Irish economic policy are regularly published along with the forecasts and commentary. Authors are invited to submit papers for consideration to either of the QEC’s co-editors, Alan Barrett and Ide Kearney at: ESRI, Whitaker Square, Sir John Rogerson’s Quay, Dublin 2 (e-mail [email protected] or I.Kearney@planet. nl). The following guidelines should be followed:
All articles should be up-to-date and policy-oriented. The content should involve the application of economic theory, data analysis or the application of lessons from the international literature. Review articles are also welcome where lessons for policy are explicitly addressed. Articles should normally comprise 4-10,000 words, excluding tables. All articles will be anonymously refereed by members of the editorial board or by an external referee chosen by the editors. The editors may also, where appropriate, seek the comments of policy experts outside of the academic community.
The QEC aims for a quick turnaround from submission to acceptance, with decisions usually made within two months. All accepted papers are published electronically as well as being included in the printed version, thereby ensuring a wide circulation well beyond subscribers to the QEC.
QEC (Articles) Editorial Board
Alan Barrett, ESRI, co-editor Ide Kearney, ESRI, co-editor
Alan Ahearne, NUI, Galway Tim Callan, ESRI
Liam Gallagher, Dublin City University
Patrick Honohan, Trinity College Dublin
Colm McCarthy, University College Dublin
Tom O’Connell, Central Bank
Eoin Reeves, University of Limerick
Ed Shinnick, University College Cork
Olive Sweetman, NUI, Maynooth
CONTENTS
Page
ECONOMIC COMMENTARY
Alan Barrett, Ide Kearney and Martin O’Brien
SUMMARY 1
Forecast National Accounts 2
The International Economy 5
The Domestic Economy 12
General Assessment 34
SPECIAL ARTICLE
The Decline of the Computer Hardware Sector: How Ireland
Adjusted 38
S
UMMARY
T
ABLE
2006 2007 2008 2009
OUTPUT
(Real Annual Growth %)
Private Consumer Expenditure 5.7 6.5 3.0 3.3
Public Net Current Expenditure 5.3 5.0 4.0 3.5
Investment 3.1 1.5 -7.4 0.0
Exports 4.4 6.6 5.4 5.7
Imports 4.4 6.0 4.0 5.3
Gross Domestic Product (GDP) 5.7 4.9 1.8 3.1
Gross National Product (GNP) 6.5 4.6 1.6 3.0
GNP per capita (constant prices) 3.8 2.0 0.3 1.9
PRICES
(Annual Growth %)
Harmonised Index of Consumer Prices (HICP) 2.7 2.9 2.9 2.5
Consumer Price Index (CPI) 4.0 4.9 3.4 2.2
Wage Growth 4.9 5.5 4.0 3.5
LABOUR MARKET
Employment Levels (ILO basis (000s)) 2,039 2,100 2,099 2,123
Unemployment Levels (ILO basis (000s)) 93 102 135 141
Unemployment Rate (as % of Labour Force) 4.4 4.6 6.0 6.2
PUBLIC FINANCE
Exchequer Balance (€m) 2,264 -1,619 -5,339 -7,524
General Government Balance (€m) 5,107 904 -2,319 -4,110
General Government Balance (% of GDP) 2.9 0.5 -1.2 -2.0
General Government Debt (% of GDP) 25.1 25.3 27.2 29.6
EXTERNAL TRADE
Balance of Payments Current Account (€m) -7,271 -8,834 -8,337 -8,669
Current Account (% of GNP) -4.9 -5.6 -5.1 -5.0
EXCHANGE AND INTEREST RATES (end of year)
US$/€ Exchange Rate 1.32 1.43 1.51 1.50
STG£/€ Exchange Rate 0.67 0.70 0.76 0.76
S
UMMARY
I
t has been evident for some time that 2008 was likely to be a year of slow economic growth. The leading indicators for house building that emerged last year suggested that this sector would contract in 2008. The absence of an SSIA effect also pointed to lower consumption growth in 2008. In the more recent weeks and months, most of the international developments are such that they will have the effect of compounding the difficulties that the economy is facing this year. Among these developments are the appreciation of the euro, the slowing in economic growth in the United States and the on-going difficulties in international financial markets.For 2008, we now expect GNP to grow by 1.6 per cent in volume terms and for GDP to grow by 1.8 per cent. Much of the slowdown in growth is related to an anticipated contraction in investment of 7.4 per cent in 2008. This is due, in turn, to a contraction in housing investment of about 30 per cent. Consumption is expected to grow by 3 per cent in 2008, well down on the figure estimated for 2007 of 6.5 per cent.
As a result of the slower pace of economic growth, there is expected to be no net employment growth in 2008. The rate of unemployment is forecast to increase to 6 per cent. The public finances are expected to move further into deficit. We now anticipate a General Government deficit of 1.2 per cent of GDP, above the Government’s Budget Day forecast of 0.9 per cent of GDP.
For 2009, we expect a modest recovery. Against a background of an improving international climate and with the easing in the contraction in house building, we expect GNP to grow by 3 per cent and for GDP to grow by 3.1 per cent. The contraction in investment in 2008 will no longer be present. Consumption is forecast to grow by 3.3 per cent and export growth is anticipated to increase to 5.7 per cent.
This recovery will lead to a resumption of employment growth. We expect to see an extra net 24,000 jobs created in 2009. However, the rate of unemployment will continue to increase in 2009 and will reach 6.2 per cent. For both 2008 and 2009, our forecasts are based on a rapid slowdown in inward migration. The deterioration in the public finances is expected to continue in 2009, in spite of the recovery, with the General Government deficit forecast to reach 2 per cent of GDP.
On inflation, we expect to see an easing in the rate of CPI inflation in 2008 and 2009 due largely to a more benign interest rate environment. CPI inflation is forecast to average 3.4 per cent in 2008 and 2.2 per cent in 2009 while HICP
inflation is forecast to average 2.9 per cent in 2008 and 2.5 per cent in 2009. The easing in HICP inflation between 2008 and 2009 is partly related to an anticipated easing in wage pressures as a result of a weakening in the labour market.
In the General Assessment, we draw attention to two issues. First, we note again the deterioration in the public finances and suggest that the Government will find it difficult to contain this deterioration. Second, we highlight the importance of growth in services exports for recent economic growth and for our forecasts.
NATIONAL ACCOUNTS 2007 (Estimate)
A: Expenditure on Gross National Product
2006 2007 Change in 2007
Estimate €m %
€m €m Value Volume Value Price Volume
Private Consumer Expenditure 82,483 90,919 8,436 5,361 10.2 3.5 6.5
Public Net Current Expenditure 24,939 27,808 2,868 1,247 11.5 6.2 5.0
Gross Fixed Capital Formation 46,027 47,012 985 709 2.1 0.6 1.5
Exports of Goods and Services (X) 139,766 148,633 8,867 9,218 6.3 -0.2 6.6
Physical Changes in Stocks 1,476 664 -812 -812
Final Demand 294,691 315,035 20,344 15,854 6.9 1.4 5.4
less:
Imports of Goods and Services (M) 120,997 129,793 8,796 7,298 7.3 1.2 6.0
less:
Statistical Discrepancy -1,011 -1,011 0 -44
GDP at Market Prices 174,705 186,253 11,548 8,599 6.6 1.6 4.9
less:
Net Factor Payments (F) -25,575 -27,075 -1,500 -1,773 5.9 -1.0 6.9
GNP at Market Prices 149,130 159,179 10,049 6,796 6.7 2.1 4.6
B: Gross National Product by Origin
2006 2007 Change in 2007 Estimate
€m €m €m %
Agriculture, Forestry, Fishing 3,195 3,259 64 2.0
Non-Agricultural: Wages, etc. 72,426 78,923 6,497 9.0
Other: 59,649 62,530 2,881 4.8
Adjustments: Stock Appreciation -329 -200
Statistical
Discrepancy -1,011 -1,011
Net Domestic Product 133,931 143,502 9,571 7.1
less:
Net Factor Payments -25,575 -27,075 -1,500 5.9
National Income 108,356 116,427 8,072 7.4
Depreciation 18,436 19,903 1,467 8.0
GNP at Factor Cost 126,792 136,331 9,539 7.5
Taxes less Subsidies 22,338 22,848 510 2.3
GNP at Market Prices 149,130 159,179 10,049 6.7
C: Balance of Payments on Current Account
2006 2007 Change in 2007 Estimate
€m €m €m
Exports (X) less Imports (M) 18,769 18,840 71
Net Factor Payments (F) -25,575 -27,075 -1,500
Net Transfers -465 -600 -135
Balance on Current Account -7,271 -8,835 -1,564
FORECAST NATIONAL ACCOUNTS 2008
A: Expenditure on Gross National Product
2007 2008 Change in 2008
Estimate Forecast €m %
€m €m Value Volume Value Price Volume
Private Consumer Expenditure 90,919 95,754 4,835 2,728 5.3 2.3 3.0
Public Net Current Expenditure 27,808 30,449 2,642 1,112 9.5 5.3 4.0
Gross Fixed Capital Formation 47,012 44,728 -2,284 -3,491 -4.9 2.8 -7.4
Exports of Goods and Services (X) 148,633 157,876 9,244 8,033 6.2 0.8 5.4
Physical Changes in Stocks 664 531 -133 0
Final Demand 315,035 329,338 14,303 8,470 4.5 1.8 2.7
less:
Imports of Goods and Services (M) 129,793 137,273 7,480 5,156 5.8 1.7 4.0
less:
Statistical Discrepancy -1,011 -1,011 0 -26
GDP at Market Prices 186,253 193,076 6,823 3,340 3.7 1.8 1.8
less:
Net Factor Payments (F) -27,075 -28,341 -1,266 -710 4.7 2.0 2.6
GNP at Market Prices 159,179 164,735 5,557 2,609 3.5 1.8 1.6
B: Gross National Product by Origin
2007 2008 Change in 2008
Estimate Forecast
€m €m €m %
Agriculture, Forestry, Fishing 3,259 3,324 65 2.0
Non-Agricultural: Wages, etc. 78,923 82,073 3,149 4.0
Other: 62,530 64,296 1,765 2.8
Adjustments: Stock Appreciation -200 -200
Statistical
Discrepancy -1,011 -1,011
Net Domestic Product 143,502 148,482 4,980 3.5
less:
Net Factor Payments -27,075 -28,341 -1,266 4.7
National Income 116,427 120,141 3,714 3.2
Depreciation 19,903 20,832 929 4.7
GNP at Factor Cost 136,331 140,973 4,642 3.4
Taxes less Subsidies 22,848 23,762 914 4.0
GNP at Market Prices 159,179 164,735 5,557 3.5
C: Balance of Payments on Current Account
2007 2008 Change in 2008 Estimate Forecast
€m €m €m
Exports (X) less Imports (M) 18,840 20,603 1,763
Net Factor Payments (F) -27,075 -28,341 -1,266
Net Transfers -600 -600 0
Balance on Current Account -8,835 -8,338 497
as % of GNP -5.6 -5.1 0.5
FORECAST NATIONAL ACCOUNTS 2009
A: Expenditure on Gross National Product
2008 2009 Change in 2009
Forecast Forecast €m %
€m €m Value Volume Value Price Volume
Private Consumer Expenditure 95,754 100,596 4,842 3,112 5.1 1.8 3.3
Public Net Current Expenditure 30,449 33,037 2,588 1,066 8.5 4.8 3.5
Gross Fixed Capital Formation 44,728 46,086 1,358 4 3.0 1.0 0.0
Exports of Goods and Services (X) 157,876 168,549 10,672 9,049 6.8 1.0 5.7
Physical Changes in Stocks 531 425 -106 0
Final Demand 329,338 348,693 19,355 13,325 5.9 1.8 4.0
less:
Imports of Goods and Services (M) 137,273 146,635 9,361 7,281 6.8 1.4 5.3
less:
Statistical Discrepancy -1,011 -1,011 0 -33
GDP at Market Prices 193,076 203,069 9,993 6,077 5.2 2.0 3.1
less:
Net Factor Payments (F) -28,341 -29,983 -1,643 -1,141 5.8 1.7 4.0
GNP at Market Prices 164,735 173,086 8,351 4,913 5.1 2.0 3.0
B: Gross National Product by Origin
2008 2009 Change in 2009 Forecast Forecast
€m €m €m %
Agriculture, Forestry, Fishing 3,324 3,391 66 2.0
Non-Agricultural: Wages, etc. 82,073 85,964 3,891 4.7
Other: 64,296 67,820 3,524 5.5
Adjustments: Stock Appreciation -200 -200
Statistical ..
Discrepancy -1,011 -1,011
Net Domestic Product 148,482 155,963 7481 5.0 less:
Net Factor Payments -28,341 -29,983 -1,643 5.8
National Income 120,141 125,980 5,839 4.9
Depreciation 20,832 22,013 1,181 5.7
GNP at Factor Cost 140,973 147,993 7,020 5.0
Taxes less Subsidies 23,762 25,093 1,331 5.6
GNP at Market Prices 164,735 173,086 8,351 5.1
C: Balance of Payments on Current Account
2008 2009 Change in 2009 Forecast Forecast
€m €m €m
Exports (X) less Imports (M) 20,603 21,914 1,311
Net Factor Payments (F) -28,341 -29,983 -1,643
Net Transfers -600 -600 0
Balance on Current Account -8,338 -8,669 -332
as % of GNP -5.1 -5.0 0.1
T
HE
I
NTERNATIONAL
E
CONOMY
1T
he main developments in the international economy can be summarised as follows:• Growth prospects in the major economies have worsened for 2008 as the impacts of the credit crisis have become more apparent, but the downturn is expected to be short lived.
• Growth in the Euro Area is expected to moderate in 2008 to 1.8 per cent and improve to 2 per cent in 2009. Inflationary pressures remain high but are likely to moderate this year. We assume the ECB main refinancing rate will be 3.75 per cent by year end.
• Tighter credit conditions in the UK are likely to depress consumer spending and investment this year, causing real GDP growth to slow to 1.8 per cent, but a weaker sterling is expected to improve exports and overall growth in 2009.
• The US economy is forecast to grow by 1.5 per cent as consumer spending weakens and housing investment falls as credit conditions worsen. Further interest rate cuts and the planned fiscal stimulus are expected to contribute to the US avoiding a prolonged recession, with growth of 1.9 per cent expected in 2009.
• Prices for oil and food, which have increased sharply in recent months are expected to moderate, leading to an easing of inflationary pressures globally.
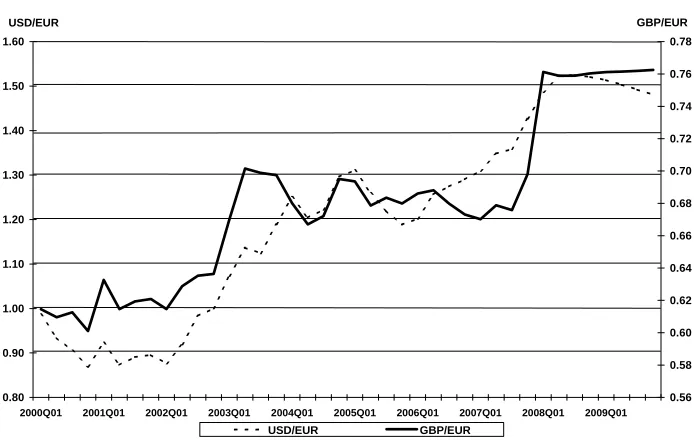
• The euro is expected to strengthen against the US dollar and sterling in 2008, but remain stable in 2009.
T
he strong pace of economic growth in the Euro Area in 2006 appears to have continued into 2007, with real GDP growth for last year now estimated at 2.7 per cent. It seems increasingly unlikely that the Euro Area will fully avoid the wider consequences of the turmoil on international financial markets, and in particular the anticipated slowdown in the US economy in 2008. We expect growth to fall to 1.8 per cent this year. Exports and investment supported growth in 2007 but it is expected that falling unemployment and an increase in wages will help stimulate domestic consumption growth, making it the driver of real GDP growth in 2008. A potential offsetting effect is the tightening credit conditions faced by European households and businesses. The latest Euro Area Bank Lending Survey (ECB, January 2008) suggests that banks significantly tightened their credit standards in the final quarter of 2007 and were expecting similar tightening in the first quarter of 2008. The continuing appreciation of theEuro Area
1 We are grateful to Adele Bergin for assistance in compiling the International forecasts.
euro against the US dollar and sterling is expected to contribute to export growth easing over our forecast horizon.
For 2009 we expect real GDP growth to rise to 2 per cent. This is accompanied by a further fall in unemployment to 6.8 per cent and an improvement in real wage growth as consumer price inflation moderates. Inflation as measured by the Harmonised Consumer Price Index was estimated at 3.2 per cent in January, well above the ECB’s target of close to but below 2 per cent, primarily as a result of higher commodity prices. It is expected that these inflationary pressures will ease as commodity price growth moderates in the second half of 2008. The strengthening of the euro and the general slowdown in economic growth should also help to stem inflation. However, the ECB President Jean Claude Trichet has consistently warned that the current high level of inflation must not become anchored in inflation expectations and feed through to wage demands. If these so-called “second round effects” were to materialise, it is possible that the ECB would not loosen monetary policy. For our forecasts we have made a technical assumption of a 25 basis points cut in the ECB main refinancing rate from 4 per cent (Figure 1) to 3.75 per cent in September 2008. Our assumption is dependent on wage increases in the major Euro Area economies, particularly Germany, remaining below the currently high rate of inflation and that commodity prices stabilise this year. It must be noted that in the current climate it is important to monitor developments in the inter-bank lending rates, such as Euribor, given their potential impact on credit availability.
Turning to the prospects for the larger Euro Area economies, German real GDP growth is estimated at 2.6 per cent for 2007. The prospects for the German economy this year and next mirror those for the Euro Area as a whole. Growth is expected to fall to 1.6 per cent in 2008 as a weaker export performance this year acts as a drag on overall activity. Offsetting this is the continuing increase in domestic demand, with personal consumption expected to pick up marginally as unemployment falls to 7.8 per cent and earnings grow by 2.5 per cent. Inflation, which is currently running at the highest rate in 14 years, is expected to moderate as oil and food prices stabilise. In 2009 real GDP growth is forecast to return to trend of about 2 per cent.
The French economy is estimated to have grown by 1.9 per cent in 2007. This performance is likely to continue in 2008, as both domestic and external demand growth is expected to fall. We anticipate real GDP growth of 1.7 per cent in 2008. Marginal improvements in employment are expected this year, but personal consumption growth is expected to remain subdued as higher prices offset increases in wages. With the government maintaining a more prudent fiscal stance, the budget deficit is expected to remain stable over the forecast horizon. The forecast for real GDP growth in 2009 is 1.9 per cent, primarily as a result of a slight increase in private investment growth.
Figure 1: Interest Rates*
-2.0 -1.0 0.0 1.0 2.0 3.0 4.0 5.0 6.0
2002M01 2003M01 2004M01 2005M01 2006M01 2007M01 2008M01
%
ECB Main Refinancing Rate Irish Mortgage Rate - nominal Irish Mortgage Rate - real
*Mortgage rate used is the Irish Representative Building Societies Mortgage Rate.
Source: Central Statistics Office.
R
eal GDP is estimated to have grown by 3.1 per cent in the UK in 2007.Much of that growth was concentrated in the first half of the year, with a significant slowdown in activity recorded in the last three months of 2007. Growth in 2007 was mostly driven by domestic demand. However, as the year came to an end, the ongoing correction in the housing market and the wider effects of the credit crunch began to limit investment and consumer spending growth. Survey evidence from the Bank of England (BoE) suggests that, although the spread between inter-bank lending rates and the main BoE policy rate has fallen, banks have tightened credit conditions for their customers. This is likely to further depress consumer spending and business investment in 2008. As a result overall economic growth is forecast to slow to 1.8 per cent this year with unemployment rising to 5.8 per cent.
United
Kingdom
In 2009 real GDP growth is expected to rise to 2.2 per cent. The improvement next year is partly due to an increase in exports as the depreciation in sterling makes UK goods and services more competitive. A weaker sterling exchange rate (Figure 2) contributes to import prices being higher for much of 2008, which is expected to lead to higher inflation. In its
latest Inflation Report (February, 2008) the BoE acknowledged that inflation
will rise sharply in the near term alongside a significant slowing in economic growth. However, commodity prices are expected to stabilise towards the end of 2008, so that it is likely that monetary policy will be further eased. Unemployment is expected to increase marginally in 2009 to 5.9 per cent.
I
n 2007 the US economy grew by an estimated 2.2 per cent. Personalconsumption growth and a robust increase in non-residential construction were the main drivers of growth last year. The correction in the housing market deepened, as residential construction output and housing transactions fell sharply. The wider effects of the credit market turmoil as a result of the sub-prime crisis are expected to weigh heavily on growth in 2008. We anticipate real GDP growth will fall to 1.5 per cent in 2008, with the likelihood of the US being technically in recession during the year, i.e. two
United States
successive quarters with a fall in real output. Unemployment is expected to rise to 5.5 per cent in 2008 as tighter credit conditions and rising inflation constrain domestic demand.
Figure 2: Exchange Rates
0.80 0.90 1.00 1.10 1.20 1.30 1.40 1.50 1.60
2000Q01 2001Q01 2002Q01 2003Q01 2004Q01 2005Q01 2006Q01 2007Q01 2008Q01 2009Q01
USD/EUR
0.56 0.58 0.60 0.62 0.64 0.66 0.68 0.70 0.72 0.74 0.76 0.78 GBP/EUR
USD/EUR GBP/EUR
Source: Central Bank & Financial Services Authority of Ireland (historic) and National Institute of Economic and Social Research (NIESR)(forecast).
A number of mitigating factors are expected to prevent the US from remaining in recession beyond the end of this year. First, the $168 billion fiscal stimulus proposed by the Bush administration and recently approved by Congress should contribute to stimulating demand, particularly business investment in 2009. Second, the Federal Reserve has publicly maintained its view that risks to economic growth remain firmly on the downside and it is willing to loosen monetary policy significantly in the coming months. This is despite the current rise in consumer price inflation driven by elevated commodity prices. Third, the expected depreciation of the US dollar in 2008 should help support export growth this year and next, which will contribute to the US current account deficit narrowing to a forecast -4 per cent of GDP in 2009. We expect real GDP growth to increase to 1.9 per cent in 2009. However, the impact of the recovery will take time to materialise as earnings growth is anticipated to be low at 2 per cent and unemployment is expected to increase to 6.3 per cent.
Table 1: Short-term International Outlook
Real GDP Growth Consumer Price
Inflation*
Average Earnings Growth
Unemployment Rate Current Account Balance
% of Labour Force % of GDP
Country 2007 2008 2009 2007 2008 2009 2007 2008 2009 2007 2008 2009 2007 2008 2009
UK 3.1 1.8 2.2 2.3 2.7 2.0 3.7 4.5 3.8 5.4 5.8 5.9 -4.8 -4.1 -3.2
Germany 2.6 1.6 2.0 2.3 2.1 1.5 1.6 2.5 2.0 8.4 7.8 7.3 6.1 4.5 4.4
France 1.9 1.7 1.9 1.6 2.9 2.3 3.0 3.4 2.7 8.3 8.0 8.1 -0.8 -1.8 -2.2
Italy 1.8 1.3 1.3 2.0 2.3 2.0 2.0 2.7 2.4 6.0 6.1 6.1 -2.9 -2.7 -2.4
Euro Area 2.7 1.8 2.0 2.1 2.5 2.0 7.4 7.0 6.8 -0.1 -0.3 -0.5
USA 2.2 1.5 1.9 2.9 3.7 2.1 4.5 4.0 2.0 4.6 5.5 6.3 -5.5 -4.9 -4.0
Japan 1.9 1.6 1.7 0.0 0.0 0.2 -0.2 2.0 2.2 3.8 3.8 4.0 4.7 4.5 4.7
China 11.3 10.3 10.0 4.8 5.2 5.6 11.2 9.7 9.4
Ireland 4.9 1.8 3.1 2.9 2.9 2.5 5.5 4.0 3.5 4.6 6.0 6.2 -4.7 -4.3 -4.3
Source: NIESR.
* HICP for Euro Area countries and the UK, CPI otherwise.
T
he Japanese economy is estimated to have grown by 1.9 per cent in 2007. Much of this growth is accounted for by a strong export performance. A significant slowdown in construction activity in the second half of 2007 is likely to continue into 2008. Combined with continued stagnation in personal consumption growth, this suggests domestic demand is unlikely to support economic growth to any great extent over our forecast horizon. Despite unemployment falling to 3.8 per cent in 2007, a level it is expected to maintain in 2008, earnings actually fell by 0.2 per cent last year. While earnings growth is expected to pick up in 2008 and 2009, by 2 per cent and 2.2 per cent respectively, the worsening international scenario is likely to curtail export growth and thus real GDP growth. We expect the Japanese economy to expand by 1.6 per cent in 2008 and 1.7 per cent in 2009. Against this backdrop, consumer prices are expected to grow only marginally in 2008 and 2009, and consequently the Bank of Japan will be reluctant to increase its main policy interest rate above the current level of 0.5 per cent.Asia
China continues to benefit from double-digit rates of real GDP growth, with estimates for 2007 showing the economy grew by 11.3 per cent last year. Exports remained an important component in overall economic growth, with the trade surplus increasing by 48 per cent in 2007. However, domestic demand has also increased significantly. Indications that export growth may have begun to slow as 2007 came to an end do not suggest any dramatic reduction in Chinese economic growth over our forecast horizon. Real GDP is forecast to increase by 10.3 per cent in 2008 and 10 per cent in 2009. Inflation remains a concern for Chinese policymakers, and despite the People’s Bank of China continued tightening of monetary policy, price pressures remain a key indicator of an overheating economy. The continued, albeit less restrictive, pegging of the Chinese renminbi to the US dollar effectively implies China is importing US inflation. Allowing a more rapid appreciation of the renminbi against the US dollar would contribute more positively to the central bank’s desire to curb inflationary pressures.
T
he prospects for growth in Ireland’s main trading partners in 2008 have significantly worsened since our previous Commentary. Combined with these developments the euro has appreciated strongly against both the US dollar and sterling. Meanwhile, the sharp increases in commodity prices are causing inflationary pressures to emerge across the globe. Both food and oil prices have seen sharp increases in recent months. Most commentators expect commodity prices to stabilise in 2008.International
Context for
Ireland
The effects of the credit crunch on the broader international economy are beginning to become apparent. Some commentators had believed that the Euro Area and emerging economies would escape much of the negative impact of slower US growth in 2008. While it is the case that the global economy is less reliant on the US than before, the so-called “decoupling hypothesis”2 was unlikely to hold to any great extent. This is particularly the
case for a country such as Ireland, which has extremely close trade and investment linkages with the US.
2 Decoupling refers to the ability of the Asian and European economies to withstand a
Our forecast is that the current downturn in the global economy will be short lived. Given the pro-active stance that the Federal Reserve and the Bank of England have taken on cutting interest rates, and the likelihood of further interest rate cuts in both jurisdictions, it is likely that growth in the US and the UK will improve in 2009. The fiscal stimulus budgeted for in the US should also contribute to growth prospects there improving next year, and improving Ireland’s export growth potential along with it. The ECB may also begin loosening monetary policy, which should stimulate growth in 2009 and help curb the strengthening of the euro. It remains important, however, that fiscal and monetary policy avoid encouraging currently high rates of inflation globally to become entrenched in inflation expectations. If this happens and a period of stagflation takes hold, the adjustment period out of the current downturn could take longer.
T
HE
D
OMESTIC
E
CONOMY
T
he downward revision of prospects for 2008 that characterised recentCommentaries continues. Expectations of significant contractions in house building in 2008 have been compounded by a downward trend in consumer confidence. This is related in part to growing concerns regarding the health of the US economy and, by extension, to growing concerns about the world economy. For 2008, we now expect GNP growth of 1.6 per cent and GDP growth of 1.8 per cent. Investment is expected to contract by 7.4 per cent, thereby placing a large drag on growth. As a result of the low growth, no employment growth is expected in 2008 and the rate of unemployment is expect to rise to 6 per cent.
General
For 2009, we expect an improvement in the growth performance. Partly as a result of an anticipated improvement in the international environment and a levelling off in house building, we expect GNP growth to be 3 per cent in 2008 with GDP growth of 3.1 per cent. While employment growth will resume (with a net increase of 23,000 expected), the rate of unemployment will move slightly upwards again to 6.2 per cent. Part of our expectation for 2009 is based on the anticipation that services exports will continue to perform well and thereby facilitate on-going growth in the services sector.
C
onsumption grew strongly in 2007 and we estimate that the growth rate for the year will have been 6.5 per cent. This is based partly on the most recent Quarterly National Accounts (QNA) and also on the most recent Retail Sales Index (RSI). According to the QNA, consumption was growing at a rate of 6 per cent in the year ended 2007 Q3 (Figure 3). The RSI grew by 6.5 per cent in volume terms in 2007. Observed growth in the overall RSI may sometimes be distorted by the motor trade but this is not the case for 2007. Excluding the motor trade, the RSI growth was 6.4 per cent.Consumption
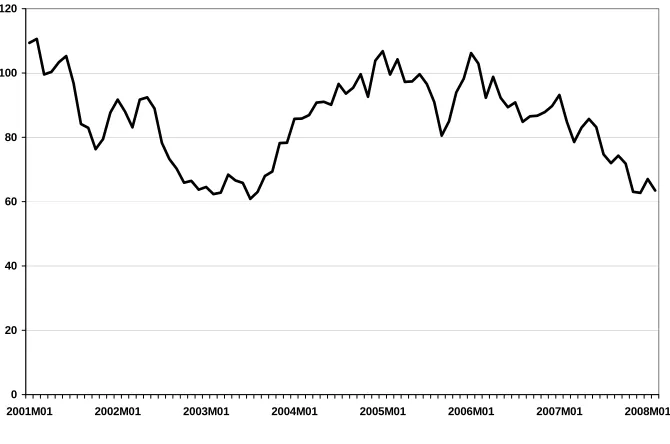
Looking ahead to 2008, it is clear that consumption growth will be significantly lower and for several reasons. First, now that the SSIA effect has largely moved through the economy, this once-off boost to consumption in 2007 will not be present in 2008. Second, the latest reading of the IIB/ESRI
themselves tend to impact negatively on consumption growth. Of these, the stagnation in employment is the most important.
Figure 3: Growth in Consumption and Retail Sales
0 1 2 3 4 5 6 7 8
2002Q1 2003Q1 2004Q1 2005Q1 2006Q1 2007Q1
%
Personal Consumption Retail Sales
Source: Quarterly National Accounts and Retail Sales Index, CSO.
Based on these considerations, we expect consumption in 2008 to grow by 3 per cent in volume terms and by 5.3 per cent in value terms. To get a sense of where this downturn is coming from, it is useful to draw on our projections for incomes, presented in greater detail below. For 2007, we estimate that gross personal income grew by 9.3 per cent in nominal terms. The corresponding figure for 2008 is forecast to be just 5.1 per cent again in nominal terms, with the difference between the two being largely explained by the different rates of employment growth. For 2009, we expect a modest rebound in consumption growth and forecast a growth rate of 3.3 per cent in real terms as employment growth resumes and consumer confidence improves.
Figure 4: IIB/ESRI Consumer Sentiment Index
0 20 40 60 80 100 120
2001M01 2002M01 2003M01 2004M01 2005M01 2006M01 2007M01 2008M01
[image:17.595.173.508.529.751.2]A
ccording to thein the year ended in that quarter. This represented a deceleration from the corresponding figure of 7.1 per cent in the previous quarter. Given this trajectory, we estimate that investment grew by 1.5 per cent in 2007, down on the 2006 figure of 3.1 per cent. It can be seen from Table 2, however, that this aggregate figure for investment growth in 2007 hides vastly different trends across housing, other building, and machinery and equipment.
QNA for 2007 Q3, investment had grown by 3.5 per cent
The contraction in housing investment has been discussed extensively in pre
In 2008, house completions remain a crucial variable for the forecast of ov
With growth in other building forecast to remain buoyant at 12 per cent, bu
ooking ahead to 2009, although the bulk of the adjustment in housing ou
Investment
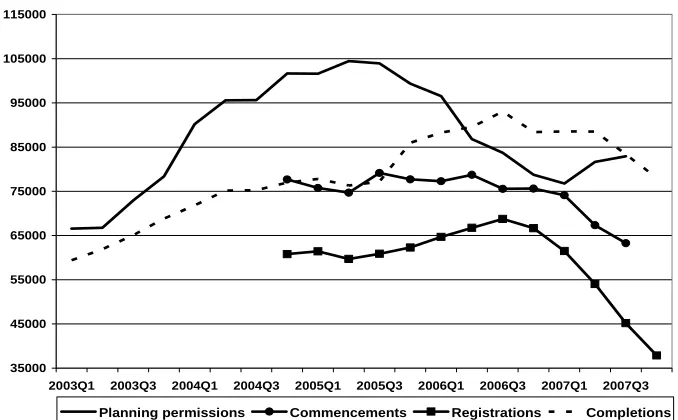
vious Commentaries because of its large impact on both the investment growth figure and on the growth figures for GNP and GDP. It now appears that housing investment contracted by 9.3 per cent in volume terms in 2007, beginning a process of adjustment whereby housing output will return to long-run sustainable levels. House completions are estimated to have been 78,028 in 2007, a fall of around 10,000 on the 2006 figure and of around 15,000 on the peak of 93,000 recorded in the year ended Q3 2006. In contrast, other building is estimated to have grown by 12 per cent in volume terms in 2007 due to the National Development Plan and buoyancy in the commercial building sector. Investment in machinery and equipment is also estimated to have grown strongly, at a rate of 13 per cent.
erall economic growth. House registrations were recorded at 37,878 for the year ended December 2007, down from 45,175 for the year ending in the previous quarter and also down from 66,649 in the year ended December 2006. With data on commencements showing a similar move, we now expect 50,000 house completions in 2008. This will translate into a percentage volume fall of 29.3 per cent.3
ilding and construction in total is forecast to register a volume contraction of 12.3 per cent in 2008. In spite of forecast growth of 8 per cent in investment in machinery and equipment, total investment is forecast to fall by 7.4 per cent in volume terms this year.
L
tput is expected to have occurred in 2008, our forecasts include a further, more modest decline in housing output in 2009. For 2009, we expect 45,000 house completions, 5,000 below our expectation for 2008. We also expect slower growth in other building in 2009 (at 2 per cent) relative to 2008 (at 12 per cent). This is based on an expectation that the slowdown in 2008 will have an impact on the commencement of retail and commercial developments in 2008 and hence on completions in 2009. With investment in machinery and equipment forecast to grow at a rate of 6 per cent, total investment is expected to register zero growth in 2009.
3 With regard to house prices, we believe that prices in the early part of 2008 will be recorded
Table 2: Gross Fixed Capital Formation
2006 % Change in 2007 2007 % Change in 2008 2008 % Change in 2009 2009
€m Volume Value €m Volume Value €m Volume Value €m
Housing 23,221 -9.3 -10.8 20,722 -29.3 -28.8 14,750 -7.1 -3.7 14,203
Other Building 13,216 12.0 18.2 15,616 12.0 17.0 18,278 2.0 5.6 19,296
Building and
Construction 36,438 -1.6 -0.3 36,339 -12.3 -9.1 33,028 -2.3 1.4 33,498
Machinery and
Equipment 9,589 13.0 11.3 10,673 8.0 9.6 11,700 6.0 7.6 12,588
Total 46,027 1.5 2.1 47,012 -7.4 -4.9 44,728 0.0 3.0 46,086
Figure 5: Housing Statistics
35000 45000 55000 65000 75000 85000 95000 105000 115000
2003Q1 2003Q3 2004Q1 2004Q3 2005Q1 2005Q3 2006Q1 2006Q3 2007Q1 2007Q3
Planning permissions Commencements Registrations Completions
Source: Department of the Environment, Heritage and Local Government.
T
he second set of monthly Exchequer returns for 2008 showed that the overall tax-take in the first two months of 2008 was 8.3 per cent below the figure for the first two months of 2007. While care should be taken not to read too much into this figure, the fall in stamp duties collected in January and February 2008 relative to January and February 2007 (44 per cent) is yet another indicator of the rapid slowdown in the property sector in the economy. Furthermore, falls in VAT and CGT tax take relative to the same period in 2007 are also in line with the apparent slowing in the economy.Government
Spending
and the
Public
Finances
Our growth forecasts for 2008 are now slipping well below the Department of Finance’s Budget Day forecasts of GNP growth of 2.8 per cent and GDP growth of 3 per cent. In this context, the question arises of what the public finance outturn is likely to be in 2008 relative to official Budget Day forecasts.
Before addressing this question, it is important that we state explicitly how we arrive at our forecasts for the public finances. For 2008, we use official Budget Day forecasts of current and capital expenditure. However, our forecast of tax revenue differs from the official Budget Day figures because we use our own tax forecasting model. For 2009, we again use official figures for capital spending but provide our own forecast of current expenditure. We do so because the level of current spending for 2009 is decided upon in late 2008 and so any figure that appears in official documents before then is more of a technical assumption than a forecast. Plans for capital spending are generally less subject to change and so we take the official figures. For 2009, our tax revenue for forecasts are based on our own tax forecasting model.
Government balance. The reason for this is that we use a higher tax elasticity with respect to economic growth relative to that used by the Department of Finance, as discussed in the previous Commentary.
These figures imply that the turnaround in the public finances since 2006 is now larger than previously estimated. A General Government surplus of 2.9 per cent of GDP was recorded in that year. If the forecast of a General Government deficit of 1.2 per cent of GDP is realised this year, the turnaround will be over 4 percentage points. As discussed in the previous
Commentary, this in itself is not a concern if it represents a short-term response to an economic downturn. However, our forecasts for the public finances in 2009 point to the challenge of bringing the public finances back to a more sustainable trajectory.
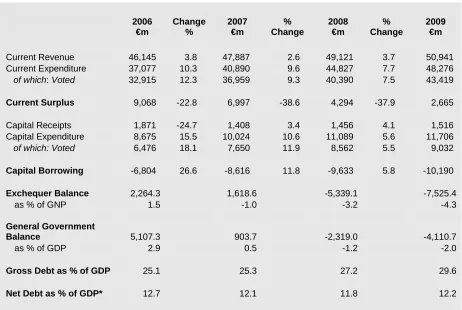
[image:21.595.68.530.382.692.2]For 2009, we have adopted a technical assumption that voted current expenditure will grow at a rate of 7.5 per cent, below the 2008 figure of 9.3 per cent and the 2007 figure of 12.3 per cent. With current revenues forecast to grow by only 3.7 per cent, the General Government deficit is forecast to widen further to 2 per cent of GDP in 2009. On the basis of these figures, the gross national debt as a percentage of GDP would rise from 25.1 per cent in 2006 to just under 30 per cent in 2009. While this would still be a low debt to GDP ratio by both historic and international standards, it is the prospect of it increasing at such a pace that is a concern.
Table 3: Public Finances
2006 €m
Change %
2007 €m
% Change
2008 €m
% Change
2009 €m
Current Revenue 46,145 3.8 47,887 2.6 49,121 3.7 50,941
Current Expenditure 37,077 10.3 40,890 9.6 44,827 7.7 48,276
of which: Voted 32,915 12.3 36,959 9.3 40,390 7.5 43,419
Current Surplus 9,068 -22.8 6,997 -38.6 4,294 -37.9 2,665
Capital Receipts 1,871 -24.7 1,408 3.4 1,456 4.1 1,516
Capital Expenditure 8,675 15.5 10,024 10.6 11,089 5.6 11,706
of which: Voted 6,476 18.1 7,650 11.9 8,562 5.5 9,032
Capital Borrowing -6,804 26.6 -8,616 11.8 -9,633 5.8 -10,190
Exchequer Balance 2,264.3 1,618.6 -5,339.1 -7,525.4
as % of GNP 1.5 -1.0 -3.2 -4.3
General Government
Balance 5,107.3 903.7 -2,319.0 -4,110.7
as % of GDP 2.9 0.5 -1.2 -2.0
Gross Debt as % of GDP 25.1 25.3 27.2 29.6
Net Debt as % of GDP* 12.7 12.1 11.8 12.2
*Net of pensions fund and Social Insurance Fund.
If we were to use the figure for voted current expenditure growth for 2009 presented by the Department of Finance in Budget 2008, the projected
General Government deficit for 2009 is lower than our forecasts. The figure presented by the Department is 5.2 per cent (our figure is 7.5 per cent);4 our
calculations suggest that the General Government deficit would be 1.6 per cent of GDP were current spending growth to be at that lower rate. Hence, even if we use the lower figure for growth in current public spending in 2009, the public finances will deteriorate in 2009 relative to 2008. We return to this issue in the General Assessment below.
T
he latest available data suggest that 2007 saw an improved performance in exports compared to that of the previous year. According to the Quarterly National Accounts for 2007 Q3, growth in the volume of exports of goods and services was 6.5 per cent on an annual basis. This compared with the 4.4 per cent growth recorded for 2006, and the growth appeared to be accelerating as 2007 progressed. While the growth to 2007 Q3 was dominated by the rapid expansion in services exports, which grew at 13.1 per cent in volume terms, merchandise export growth improved dramatically, increasing to 2.4 per cent in 2007 Q3 compared to 0.8 per cent for 2006. We estimate export volume growth of 6.6 per cent for 2007 as a whole, with the equivalent value measure being 6.3 per cent.Exports
Following a disappointing year in 2006, merchandise export growth in 2007 is estimated to have increased markedly, with our estimate of volume growth for the year being 3.4 per cent. The growth in the volume of merchandise exports was particularly strong in 2007 Q2 and Q3. By contrast growth in the value of merchandise exports seems to have stagnated, reflecting the ongoing fall in export prices. According to the Balance of Payments, which only provides data in current prices, growth in the value of merchandise exports has remained low, with no growth in value recorded for the year ending 2007 Q3, while data from the latest External Trade Statistics
estimate that the value of merchandise exports actually fell in December. Merchandise export prices are expected to continue falling over our forecast horizon as the Wholesale Price Index for manufacturing, a leading indicator of export prices, has maintained its downward trend. Consequently, our forecast for the growth in the value of merchandise exports remains below that of volume growth in 2008 and 2009, at 2 per cent and 2.5 per cent respectively in both years.
Overall export growth continues to be driven by the growth in services exports, which now account for over 40 per cent of total exports. Our forecasts suggest that 47 per cent of total exports in 2009 will be services. For the year ending 2007 Q3 services exports grew by 15.9 per cent in value terms. Balance of Payments data suggest that much of that growth was concentrated in financial services and business services, which grew by 19.7 per cent and 29.5 per cent respectively. We estimate that for 2007 as a whole services exports grew by 14.5 per cent in value terms, with non-tourism services exports growing by 15 per cent and tourism exports growing by 9 per cent. Services export growth is expected to moderate in 2008, although still contributing more than merchandise to total export growth. We estimate that
4 We use this higher figure for growth in voted current expenditure in 2009 because we think
Table 4: Exports of Goods and Services
2006 % Change in 2007 2007 % Change in 2008 2008 % Change in 2009 2009
€m Volume Value €m Volume Value €m Volume Value €m
Merchandise 83,355 3.4 0.8 84,022 2.5 2.0 85,702 2.5 2.0 87,416
Tourism 4,258 5.3 9.0 4,641 5.6 8.0 5,013 6.1 8.0 5,414
Other Services 50,793 12.0 15.0 58,412 9.8 12.0 65,421 10.3 12.8 73,763
Exports of Goods
and Services 138,406 6.6 6.3 147,075 5.4 6.2 156,136 5.7 6.7 166,592
FISIM Adjustment 1,360 1,558 1,740 1,956
Adjusted Exports 139,766 6.6 6.3 148,633 5.4 6.2 157,876 5.7 6.8 168,549
almost 80 per cent of the value growth in exports this year will be accounted for by services. Our forecast for non-tourism services growth in 2008 is 12 per cent in value terms and 9.8 per cent in volume terms. Growth in the value of tourism exports is expected to decline to 8 per cent this year. For 2009 we anticipate growth in the value of non-tourism exports to improve slightly, rising to 12.8 per cent (10.3 per cent in volume terms). Tourism export growth in 2009 is expected to remain steady at 8 per cent in value terms; however, given the moderation in consumer price growth expected next year the equivalent volume measure increases to 6.1 per cent.
[image:24.595.165.501.388.603.2]Our estimates for overall export growth in 2007 have been revised upwards since our previous Commentary as the latest available data suggest a strong export performance in 2007 Q2 and Q3. However, the international environment has become increasingly difficult, with the Euro appreciating and economic growth in our main export markets slowing. Indicators suggest that a slowdown in export growth can be expected in 2008. Our forecast for the total volume growth in exports for 2008 is 5.4 per cent (6.2 per cent in value terms). Our expectation is that much of the current downturn in the international economy will be concentrated in 2008. As such we expect a slight increase in total export growth in 2009, to 5.7 per cent in volume terms and 6.8 per cent in value terms. The responsiveness of labour costs to the worsening employment situation domestically is key to our forecasts for 2009, as it implies an end to the deterioration in Ireland’s overall competitiveness.
Figure 6: Exports and Imports Volume Growth Rates (Annual Averages)
-10.0 -5.0 0.0 5.0 10.0 15.0 20.0 25.0
2001Q1 2002Q1 2003Q1 2004Q1 2005Q1 2006Q1 2007Q1
%
Exports Imports
Source: Quarterly National Accounts, CSO.
D
ata from the latest QNA suggest that the volume of imports of goods andservices grew by 5.8 per cent in the year ending 2007 Q3. This is an acceleration on the growth experienced during 2006 of 4.4 per cent. We estimate that for 2007 as a whole imports grew by 6 per cent in volume terms
and 7.3 per cent in value terms. According to the latest Balance of Payments
data, the value of tourism imports grew by 15.1 per cent in the year ending 2007 Q3. Our estimates for 2007 imply a 13 per cent growth rate for the value of tourism imports, alongside an 8 per cent increase in the value of non-tourism services exports. Merchandise import growth for 2007 is estimated at 6 per cent in value terms and 5 per cent in volume terms.
Table 5: Imports of Goods and Services
2006 % Change in 2007 2007 % Change in 2008 2008 % Change in 2009 2009
€m Volume Value €m Volume Value €m Volume Value €m
Merchandise 57,967 5.0 6.0 61,445 3.9 5.5 64,824 3.9 5.5 68,390
Tourism 5,446 10.8 13.0 6,154 3.4 6.0 6,523 5.4 8.0 7,045
Other Services 57,025 6.7 8.0 61,587 4.1 6.0 65,282 6.6 8.0 70,505
Imports of Goods
and Services 120,438 6.0 7.3 129,186 4.0 5.8 136,630 5.3 6.8 145,940
FISIM Adjustment 559 607 643 695
Adjusted Imports 120,997 6.0 7.3 129,793 4.0 5.8 137,273 5.3 6.8 146,635
Merchandise import volume growth was estimated at 1.6 per cent in 2006 by the CSO. In the year ended 2007 Q3 that growth had increased to 4.8 per cent. Looking across the various commodity groups, the External Trade Statistics estimate that some of the highest growth in the value of merchandise imports was found for food and beverages products, with growth for the year ending November 2007 of 10.4 per cent and 12.2 per cent respectively. Interestingly, the growth in the value of petroleum products only increased by 1.3 per cent over the same period, despite the growth in the price of oil on international markets.
The growth in the volume of services imports in 2006 is estimated at 7 per cent by the CSO. In 2007 Q3 that growth had moderated to 6.7 per cent, although it had increased substantially on Q2 growth of just 3.7 per cent on an annual average basis. As mentioned above, the Balance of Payments data suggests strong growth in tourism imports as 2007 progressed, with non-tourism services being the main driver of services import growth. An increase in the growth of the value of trade-related business services of 11.6 per cent in the year ended 2007 Q3 also helped offset the continuing decline in computer services and financial services imports.
For 2008 volume growth in imports of goods and services is forecast to slow to 4 per cent (5.8 per cent value), a further downward revision on our previous forecasts. This reflects the particularly sharp fall in the growth of personal consumption this year, which particularly impacts on services imports. Growth in non-tourism services imports is anticipated to fall to 4.1 per cent (6 per cent value) while tourism import growth is anticipated to decline rapidly to 3.4 per cent (6 per cent value).
The moderation in the growth of industry (excluding construction) in 2008 and 2009 contributes to the volume of merchandise import growth easing to 3.9 per cent in both years. In 2009 we anticipate growth in non-tourism services imports to return to 2007 levels, with tourism imports growth also increasing to 5.4 per cent (8 per cent value) as growth in personal consumption recovers somewhat. Overall, we expect volume growth in the imports of goods and services to be 5.3 per cent in 2009, with value growth of 6.3 per cent.
O
ur forecasts for merchandise imports and exports for 2008 and 2009 imply a further narrowing of the merchandise trade balance this year and next, by 7.5 per cent and 8.9 per cent respectively. This follows an estimated narrowing of 11.1 per cent in 2007. Both volume and price developments contribute to this trend. The deterioration in the merchandise terms of trade is also expected to continue, as our forecasts suggest merchandise export prices will continue to fall alongside rising import prices. Meanwhile, the opposite pattern is emerging in relation to services trade. Not only is Ireland exporting more services in volume terms than in previous years, but the unit price of our services exports is growing faster than the unit price of our services imports implying continued improvement in our services terms of trade. We estimate that these factors contributed to the services trade deficit falling by 36.8 per cent in 2007, and that it will continue that trend in 2008 and 2009. Indeed our forecasts suggest that Ireland will have a surplus in services trade next year. The strong performance from services is expected to compensate entirely for the contraction in the merchandise trade balance in 2008 and 2009, leading to the first improvement in the trade balance sinceBalance of
2002. We now expect the trade balance to rise from an estimated 11.2 per cent of GNP in 2007 to 11.8 per cent of GNP in 2008 and 11.9 per cent of GNP in 2009.
Table 6: Balance of Payments*
2006 Change 2007 Change 2008 Change 2009 €m % €m % €m % €m
Merchandise Trade
Balance 25,388 -11.1 22,577 -7.5 20,878 -8.9 19,026
Service Trade Balance - 7,420 -36.8 -4,688 -70.7 -1,372 -218.6 1,626
Trade Balance in Goods and Services on Balance of Payments
Basis 17,968 -0.4 17,889 9.0 19,506 5.9 20,653
% of GNP 12.0 11.2 11.8 11.9
Total Debit Flows 84,651 26.7 107,269 16.2 124,618 16.8 145,572
Total Credit Flows 59,870 35.5 81,146 20.0 97,375 20.0 116,850
Net Factor Flows -24,781 5.4 -26,124 4.3 -27,244 5.4 -28,722
Net Current Transfers -465 -600 -600 -600
Balance on Current
Account -7,278 -8,835 -8,338 - 8,669
Capital Transfers 223 300 300 300
Effective Current Balance -7,055 -8,535 -8,038 -8,369
% of GNP -4.7 -5.4 -4.9 -4.8
*This table includes adjustments to Balance of Payments basis.
In relation to net factor flows, the latest Balance of Payments data estimate that the net factor income deficit widened by 3 per cent in the year ended 2007 Q3. Credit flows increased by 31.7 per cent over the same period. Of these credit flows, portfolio and other investment income had the largest increase of 35.6 per cent. Direct investment income saw growth of 10.6 per cent, an improvement on early 2007 figures but well below the 30 per cent growth seen for the year 2006. Debit factor flows tend to be much more volatile, growing by 22.7 per cent in the year ending 2007 Q3.
For 2007 we estimate that the net factor income deficit grew by 5.4 per cent. Our forecasts for 2008 and 2009 see net factor income grow by 4.3 per cent and 5.4 per cent respectively. There is a significant amount of uncertainty around these forecasts given the scale and volatility of the underlying flows. Together with our forecasts for the trade balance, this implies an effective current account balance equivalent to -5.4 per cent of GNP estimated for 2007, improving in 2008 to -4.9 per cent of GNP and in 2009 to -4.8 per cent of GNP.
B
ased on our forecasts for the expenditure components, our forecast for GNP growth in 2008 is 1.6 per cent. As regards growth in GNP per capita, our forecasts suggest growth of 0.3 per cent. Clearly these figures are very low relative to recent experience and, if taken in isolation from our forecasts for 2009, might have appeared to signal an end to Ireland’s recent history of economic growth being above that of our European neighbours.Measures of
Growth
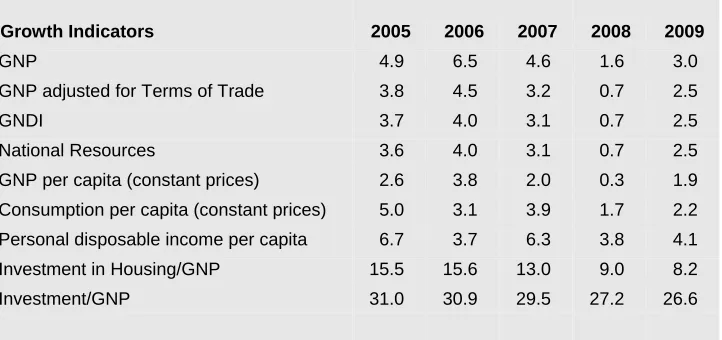
However, the figures for 2009 show that a recovery is expected. We forecast GNP growth of 3 per cent and growth in GNP per capita of 1.9 per cent. With slower inward migration forecast for 2009 relative to 2008, the proportionate difference between growth in GNP and GNP per capita is lower. Although a recovery is anticipated in 2009, we do not foresee a return to the growth rates that were experienced for much of this decade. However, this steadier pace of economic growth is likely to be more sustainable. This point on sustainability is well illustrated by the figures in Table 7 on the proportion of housing investment in GNP. From its peak of 15.6 per cent in 2006, we expect to see this falling to 8.2 per cent in 2009.
Table 7: Measures of Growth
Growth Indicators 2005 2006 2007 2008 2009
GNP 4.9 6.5 4.6 1.6 3.0
GNP adjusted for Terms of Trade 3.8 4.5 3.2 0.7 2.5
GNDI 3.7 4.0 3.1 0.7 2.5
National Resources 3.6 4.0 3.1 0.7 2.5
GNP per capita (constant prices) 2.6 3.8 2.0 0.3 1.9
Consumption per capita (constant prices) 5.0 3.1 3.9 1.7 2.2
Personal disposable income per capita 6.7 3.7 6.3 3.8 4.1
Investment in Housing/GNP 15.5 15.6 13.0 9.0 8.2
Investment/GNP 31.0 30.9 29.5 27.2 26.6
A
ccording to the Quarterly National Accounts for 2007 Q3, industry(including construction) grew by 5.7 per cent in the year ending in that quarter. As building and construction itself posted a growth rate of just 0.6 per cent in that period, the performance for industry (excluding construction) was even more impressive with growth of 7.5 per cent. This strong performance of industry is also seen in the figures from the Industrial Production Index (IPI) and it appears that the performance was maintained into the final quarter. The index for all industries grew by 7.1 per cent in 2007, with manufacturing industries growing by 7.4 per cent. Based on these figures, we estimate that industry (excluding construction) will have grown by 6 per cent in volume terms in 2007, although value growth will be lower due to price falls for manufactured goods. We estimate that construction itself will have experienced a contraction in 2007 (of 1.6 per cent in volume terms) and so industry in total is estimated to have registered growth of 3.9 per cent in volume terms last year.
Sectoral
Output
nature. We would need much detailed information to be more definitive on this point but it is an issue that should be explored more fully in the future.
Figure 7: Annual Growth Rate in the Industrial Production Index for Manufacturing
0 2 4 6 8 10 12 14 16 18
2000 2001 2002 2003 2004 2005 2006 2007
%
IPI (Manufacturing) Annual Growth Rates
Source: Industrial Production Index, CSO.
For 2008, we see the non-construction side of industry growing by 3 per cent in volume terms. While this represents a solid performance, we do not see that the particularly strong performance of 2007 will be maintained partly because of the more challenging international context. For 2009, we also expect to see growth in this sector of 3 per cent. While the international context should improve, we think that the competitiveness losses suffered in recent years will make it difficult for manufacturing to take full advantage of the improved context.
This solid performance will be offset to a degree by the on-going difficulties that we foresee for construction in 2008 and 2009. Building and construction is expected to contract by 12.3 per cent this year and by a further 2.3 per cent in 2009. Overall, we expect industry to contract by almost 1 per cent in 2008 and to grow by 1.8 per cent in 2009.
Growth in services in the year ended 2007 Q3 was 6.1 per cent in volume terms, according to the Quarterly National Accounts. The corresponding growth rates for the various sub-sectors were as follows: distribution, transport and communications, 6.5 per cent; public administration and defence, 2.2 per cent; other services (including rent), 6.3 per cent. For 2007 overall, we expect that services growth will have been 5.9 per cent, largely due to strong growth in the non-public elements.
This strong performance by services should be seen in the context of increasing growth in non-tourism services exports, as discussed in the Exports
section above. Non-tourism services exports are estimated to have grown by 12 per cent in 2007. This follows growth of 10.7 per cent in 2006, 10.8 per cent in 2005 and 11.6 per cent in 2004. One interesting dimension of this performance is that it occurred in the context of Ireland’s loss of competitiveness. This suggests that the services side of Ireland’s exports may have been less sensitive to price-related competitiveness losses relative to
26
Table 8: GDP by Sector
2006 Change 2007 Change 2008 Change 2009
€m Volume Value €m Volume Value €m Volume Value €m
Agriculture 3,918 -10.0 2.0 3,996 1.0 2.0 4,075 1.0 2.0 4,157
Industry: 53,043 3.9 2.4 54,329 -0.9 -1.1 53,738 1.8 1.9 54,734
Other Industry 37,906 6.0 3.5 39,233 3.0 2.0 40,018 3.0 2.0 40,818
Building & Construction 15,137 -1.6 -0.3 15,096 -12.3 -9.1 13,720 -2.3 1.4 13,916
Services: 96,417 5.9 10.0 106,092 3.4 6.1 112,511 4.3 6.7 120,097
Public Administration &
Defence 5,485 2.5 7.0 5,869 1.0 4.5 6,133 1.0 3.0 6,317
Distribution, Transport
and Communications 23,075 5.0 6.6 24,592 2.0 3.8 25,521 2.0 3.8 26,487
Other Services
(including rent) 67,857 6.4 11.5 75,631 4.1 6.9 80,857 5.4 8.0 87,293
GDP at Factor Cost –
merchandise exports or that services may have experienced higher productivity growth. Either way, the trend allows us to be somewhat optimistic about the potential of services exports in 2008 and 2009 and, by extension, about services output generally.
For 2008, we expect output from the services sector to grow by 3.4 per cent in volume terms. This growth is driven by services other than public services and distribution, communications and transport. For 2009, we expect overall growth of 4.3 per cent in services, again led by other services, for which growth of 5.4 per cent is expected.
For agriculture, positive price developments should see the value of output growth exceeding that of volume growth in both 2008 and 2009. However, growth rates are expected to be modest at 1 per cent in volume terms and 2 per cent in value terms in both years.
T
he Quarterly National Household Survey for Q4 2007 showed that employment (when seasonally adjusted) grew by 67,800 in the year ending November 2007, an amount equal to 3.3 per cent. As employment had grown by close to 90,000 in each of 2006 and 2007, it seems clear that the rate of growth in employment is now easing. As regards the sectoral breakdown of employment change, the biggest increase in both absolute numbers and in proportionate terms was in wholesale and retail. Employment in this sector grew by almost 24,000 or by 8.2 per cent. The next biggest increase, again in both absolute and proportionate terms, was for financial and other business services, where employment grew by 21,000 (or by 7.6 per cent). Construction posted a decrease of 5,500 jobs (or almost 2 per cent), a trend that was unsurprising given broader developments in that sector.Employment
The apparent weakening in the labour market is also evident from the FÁS/ESRI Employment and Vacancies Report. As shown in Figure 8, in January the Net Employment Expectations indicator showed a reading of -11 per cent. This can be interpreted as suggesting that the percentage of employers expecting a decline in employment in their firms is 11 percentage points higher than those expecting an increase. More tellingly, the index has been on a downward trajectory since April of last year and is now recording levels that are equal to the low points of August 2003 and November 2004. At both of those points, the index showed a fairly rapid turnaround but we are less confident that this will occur now.
Turning to our forecasts, with economic growth for 2008 now forecast to be well below 2 per cent, the stark implication for employment is that we envisage no growth this year. When combined with anticipated growth in the labour force, this implies that the unemployment rate will rise to 6 per cent. We expect that net inward migration will decline rapidly in 2008 relative to 2007 (down to 20,000 from close to 70,000.5
For 2009, the pick-up in economic growth is expected to translate into an increase of 23,000 jobs (or 1.1 per cent). As this is a relatively modest rate of employment growth, the rate of unemployment is expected to move up
5 This is already evident in the slowdown in PPS numbers issued in recent months.
slightly again in 2009, to 6.2 per cent. This rate is based on the expectation that net inward migration will fall again in 2009, down to 10,000.
Figure 8: The FÁS/ESRI Net Employment Expectations Index (and its 3 Month Moving Average)
-15.0 -10.0 -5.0 0.0 5.0 10.0
Jan 03 Jan 04 Jan 05 Jan 06 Jan 07 Jan 08
%
Index 3 month moving average
Source: FÁS/ESRI Employment and Vacancies Report, January 2008.
As noted in previous Commentaries, the headline figures on employment growth hide a much more dynamic picture at a sectoral level. Although zero net employment growth is forecast for 2008, this consists of an extra 19,000 jobs in services and 19,000 less in industry, including construction. For 2009, the net figure of 23,000 is made up of 29,000 added jobs in services and 6,000 fewer jobs in industry, including construction. Underpinning our forecasts is a somewhat optimistic view of how those individuals losing jobs will be able to react, for example, through exiting the labour force, returning to home countries in the case of immigrants, or finding jobs in the areas of employment growth. Should this view prove to be overly optimistic, then our current forecast for the unemployment rate would rise.
Table 9: Employment and Unemployment
Annual Averages 000s
2006 2007 2008 2009
Agriculture 117 115 115 114
Industry 560 569 550 544
Services 1,362 1,416 1,435 1,464
Total at Work 2,039 2,100 2,100 2,123
Unemployed 93 102 135 141
Labour Force 2,132 2,202 2,234 2,264
Unemployment Rate % 4.4 4.6 6.0 6.2
Net Migration 71.8 67.3 20.0 10.0
of which: Inward Migration 107.8 109.5 65.0 62.0
Change in Participation Rate* 1.1 0.8 0.5 -0.2
[image:32.595.159.526.518.743.2]