The integration of advanced active and passive
structural noise control methods
M. Moshrefi-Torbati
a,*, A.J. Keane
b, S.J. Elliott
c, M.J. Brennan
d, E. Rogers
ea
Research Institute for Industry (RIfI), School of Engineering Sciences, University of Southampton, UK b
Department of Computational Engineering, SES, University of Southampton, UK c
Department of Adaptive Systems, Institute of Sound and Vibration Research (ISVR), University of Southampton, UK d
Department of Engineering Dynamics, ISVR, University of Southampton, UK e
Department of Control Systems Theory and Design, School of Electronics and Computer Science, University of Southampton, UK
Received 31 May 2005; received in revised form 23 November 2005 Available online 14 February 2006
Abstract
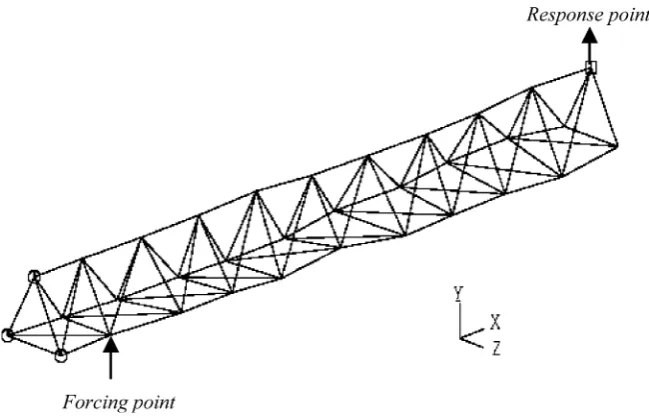
This paper reports on an investigation into the feasibility of using active and passive means of vibration control in aero-space structures. In particular, attention is focused on controlling vibration transmission through light weight satellite structures at medium frequencies. The initial structure under test here is a 4.5-meter long satellite boom consisting of 10 identical bays with equilateral triangular cross sections. This structure is typical of those that might be used in space telescopes, space stations or synthetic aperture radar systems. Such a structure is typically used to support sensitive instru-ments in precise aligninstru-ments spaced tens of metres apart. While a great deal of work has been done on this problem at low frequencies, relatively little has been achieved to date at medium frequencies (here taken to be between 150 Hz and 250 Hz). Nonetheless, this is of importance to new space missions. Using the techniques described here, an overall reduc-tion in vibrareduc-tion transmission of 31.0 dB is achieved in an essentially undamped structure using passive means alone. The amounts of attenuation achievable for active control with one, two and three actuators are found to be 15.1 dB, 26.1 dB and 33.5 dB, respectively. With the combined passive control (using 10% geometric deviations) and active control (using three actuators) an overall reduction of 49.5 dB is achievable in practice.
2005 Elsevier Ltd. All rights reserved.
Keywords: Structural vibration; Passive control; Active control; Optimization; Genetic Algorithm
1. Introduction
Space missions that involve satellites with highly sensitive instrumentation packages perhaps raise the most challenging vibration control issues. Often these packages must be supported on structures where the vibration levels have been reduced to micro-levels. Needless to say that these instruments, that may form one of the
0020-7683/$ - see front matter 2005 Elsevier Ltd. All rights reserved. doi:10.1016/j.ijsolstr.2005.11.009
* Corresponding author. Tel.: +44 0 23 8059 5000; fax: +44 0 23 8059 3131.
E-mail addresses: [email protected] (M. Moshrefi-Torbati), [email protected] (A.J. Keane), [email protected] (S.J. Elliott),[email protected](M.J. Brennan),[email protected](E. Rogers).
individual sensors of a multi-sensor interferometric telescope or synthetic aperture radar (Melody and Briggs, 1993), must function correctly. To add to the complexity of the problem, they are sitting on structural booms tens of meters apart, with the relative motions between their ends restricted to microns over wide ranges of excitation frequency (Sirlin and Laskin, 1990). Despite a number of proposed design approaches in this field, it is still not clear how best to proceed to meet these demanding requirements (Melody and Neat, 1996).
The use of anti-vibration mountings or viscoelastic coating of the structural elements have consequent weight and cost penalties and their effectiveness diminishes with the vibration levels. To reduced the need for damping treatments and to more importantly contain vibrational energy near the points of excitation, vibration isolators are also used between most pieces of equipment and their supporting structure. However, such isolators cannot deliver the desired behavior in all situations, particularly for sensitive equipment. The upshot of this problem is the need for some kind of widely applicable, generic structural filter design capability that can be used to build desirable characteristics into a structure, retaining its ability to carry static loads while blocking higher frequency motions. This paper reports the results of a research program that has been undertaken into the development of a medium frequency vibration control approach for such systems.
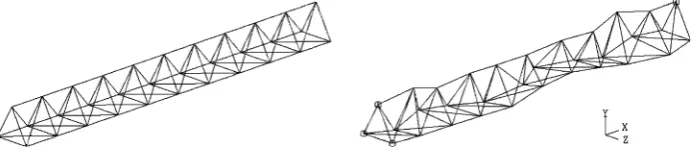
In this study two approaches to vibration control are considered: first, the use of geometric redesign to pro-duce vibration isolation characteristics within the base structure. Since the structures being considered are all truss like beams, this involves changing the geometries of the bays making up the beams, see for example Fig. 1. The second approach considered is via the use of embedded, actively controlled piezo-electric actuators. Such actuators can be used to impart forces into the structure that cancel out vibrations that would otherwise be transmitted. In this study both approaches are considered separately and also in combined designs. Both computational and experimental studies are carried out.
In the first part of the paper the superior mid-frequency vibration isolation of a geometrically optimized lightweight structure is demonstrated. The initial structure under test here is a 4.5-meter long satellite boom consisting of 10 identical bays with equilateral triangular cross sections. An unusual geometric variant of this, with inherent isolation characteristics is designed by the use of Genetic Algorithm (GA) methods. This work is based on results from a Fortran code byShankar and Keane (1995), which is derived from receptance analysis and fully validated against detailed FE models of the structure (Moshrefi-Torbati et al., 2003; Keane, 2002). In the receptance method, the aim is to obtain the equations relating the coupling forces at either end of a beam to the displacements at the ends. Solution of an assembly of such equations yields the velocities and coupling forces at the joints of a complex arrangement of beams and from these quantities the substructure energy flows can be directly calculated.
[image:2.544.98.445.595.672.2]The second part of the paper gives the experimental results for active vibration control of the structure. Piezoelectric actuators are incorporated into the boom structure and feed forward active control is used to suppress vibration at the end three joints (Moshrefi-Torbati et al., in press). Exhaustive searches are first car-ried out to find the optimum positions for one and two actuator designs. Then a GA is employed to find high quality positions for three actuators on the structure that will achieve the greatest reductions in vibration transmission. Having found these actuator positions, experiments are carried out to verify the quality of the theoretical predictions. Lastly, a GA search is used to simultaneously search for a geometry and combi-nation of actuator locations that would achieve good vibration isolation. A design with deviations of only 10% is found with three actuators that gives isolation considerably in excess of that possible by carrying out the optimization in two separate stages and with 20% geometry changes. It is worth noting here that when apply-ing both active and passive techniques, a designer must be aware of the existapply-ing trade-offs. For example,
having higher levels of attenuations has the risk of failure of an active component, resulting in poorer performances.
2. The structure
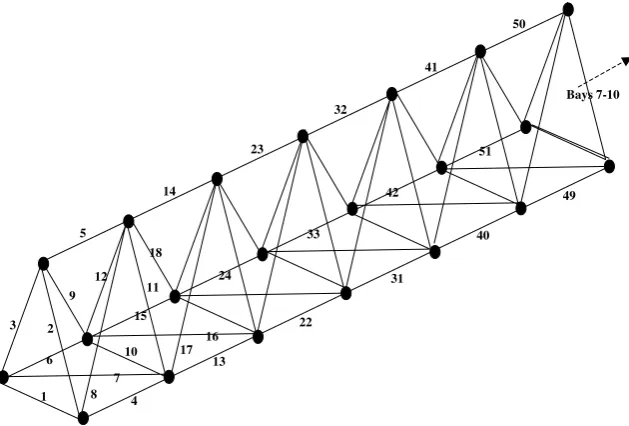
Figs. 2a and 2billustrate the geometry of the boom structure and the numbering systems used for the joints and beam elements, respectively. All 93 Euler–Bernoulli beams in the structure have the same properties per unit length. They have an axial rigidity EA of 2.184 MN, a bending rigidity EI of 5.503 N m2and mass per unit length of 0.085 kg/m. The beams are all either 0.450 m or 0.636 m long and are joined together by 33 Alu-minum spheres of 25 mm diameter. The model was excited by a point transverse force on a far left-hand joint which represents input forces from the satellite body. Based on initial trial experiments, a value of 0.005 was used for the structural viscous damping ratio in all computations. During optimization, the main goal is to minimize the mean vibrational energy level in the right-hand three joints between 150 Hz and 250 Hz. This
0.45m 3 2 1 6 4 31 13 16 10 7 9 30 5 8 11 14 17 19 22 25 28 20 23 26 29 32 33 x y
[image:3.544.111.441.246.419.2]z 4.5m
Fig. 2a. Numbering system for the joints of the satellite boom structure model.
[image:3.544.116.431.456.669.2]Bays 7-10 51 42 33 24 49 40 31 22 50 41 32 23 18 17 16 14 15 13 12 11 10 9 8 7 5 6 4 2 3 1
spans a frequency range where conventional approaches to satellite boom vibration control are currently not very effective (Johnson et al., 1987; Denoyer and Johnson, 2001; Lee-Glauser et al., 1996).
3. The base-line experiment
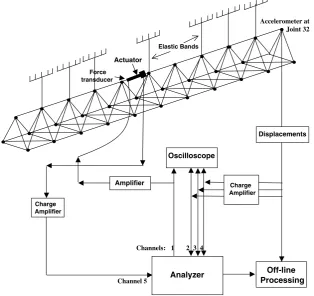
The experimental setup for the boom structure is shown inFig. 3where the structure is suspended from the ceiling by equal length strings. This approximates free–free boundary conditions, which were chosen here as they are much easier to achieve in practice. A force transducer (B&K 8200) was used in conjunction with a sha-ker (LDS V201) that was screwed to the structure. Joint 4 with coordinates (0.45, 0.0, 0.0) meters was chosen as the input force location, seeFig. 2. A random input force spanning 150–250 Hz, generated by the analyzer was supplied to the shaker via an amplifier (type TPA100-D). The translational responses of the structure in thex,y andzdirections at the end three joints (i.e., 31, 32 and 33) were measured by using a Bruel & Kjaer triaxial accelerometer (type 4326 A) via charge amplifiers (B&K 2635). As the accelerometer weighs around 13 g, dur-ing any joint measurement, the other two end joints had masses of equal weight attached to them. The measured accelerations were integrated to obtain the corresponding velocities and fed back to the analyzer.
4. Results
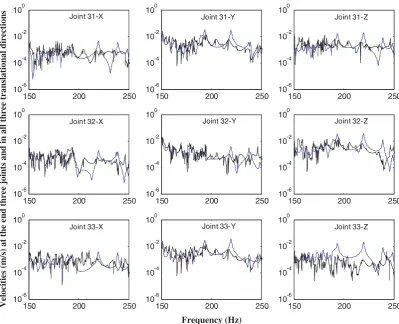
Fig. 4shows the experimental forced response of the structure at joints 31, 32 and 33 and in all three trans-lational directions for the frequency bandwidth of 150–250 Hz, compared with the predicted results obtained using the receptance methods (Shankar and Keane, 1995). The graphs in Fig. 4show reasonable agreement between the two curves. This implies that the theoretical model is capable of predicting the vibrational behav-ior of the satellite boom structure, particularly in band averaged form, and can be used to search for optimum geometries and actuator locations in order to reduce its vibration transmission levels.
Oscilloscope
Charge
Charge Amplifier
Amplifier
Off-line Processing
Channel 5 Analyzer
Amplifier
Channels: 1 2 3 4 Actuator
Elastic Bands
Accelerometer at Joint 32
Force transducer
[image:4.544.112.427.71.367.2]Displacements
5. Passive optimization
Having demonstrated the reliability of the receptance method, the code was then interfaced with an opti-mization package that has been developed byKeane (1994a). The aim here is to produce a new boom geom-etry with an improved frequency response curve. More specifically, the aim is to reduce the frequency averaged response of the boom in the range 150–250 Hz by the use of optimization, i.e.,
J ¼ X
250 Hz
f¼150 Hz
X33
j¼31
ðv2jxþv2jyþv2jzÞ j¼joint number f ¼frequency
In practice, such a requirement would reflect known sensitivities of the payload or known excitation frequen-cies. To meet other design requirements the optimization is constrained to keep the three end beams un-changed in length and position with respect to the left-hand end points. Further, all of the joints within the structure have been kept within fixed distances from their original positions. This ensures that no beam is too long or too short and also restricts the overall envelope of the structure. The free variables in the problem are thus set as thex,y andzcoordinates of the 27 mid-span joints, i.e., 81 variables in all.
To achieve the above objectives, a GA optimizer was selected from the optimization package (Keane, 1994a) to produce the improved design. For this particular run of the GA, 30 generations and a population size 300 were chosen. This means that during the first generation, the optimizer generates 300 random new
150 200 250
10-6 10-4 10-2 100
150 200 250
10-6 10-4 10-2 100
150 200 250
10-6 10-4 10-2 100
150 200 250
10-6 10-4 10-2 100
150 200 250
10-6 10-4 10-2 100
150 200 250
10-6 10-4 10-2 100
150 200 250
10-6 10-4 10-2 100
150 200 250
10-6 10-4 10-2 100
150 200 250
10-6 10-4 10-2 100
Joint 31-X Joint 31-Y Joint 31-Z
Joint 32-X Joint 32-Y Joint 32-Z
Joint 33-X Joint 33-Y Joint 33-Z
Velocities (m/s) at the end three joints and in all three translational directions
[image:5.544.75.475.65.389.2]Frequency (Hz)
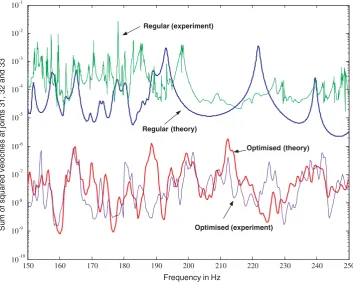
geometries. In the creation of a new geometry, the coordinates of all joints in the structure were varied within ±9 cm maximum deviation from their original positions. After analyzing the frequency response of each of these new boom designs, the GA outputs the design with the best performance and then continues on to the second generation. The designs carried over to the second generation and the creation of subsequent new designs is governed by the specific natural selection algorithm employed by the GA (Goldberg, 1989). The geometry producing the best frequency response curve from the 300 geometries created after the 30th gen-eration is illustrated inFig. 5a. It is evident from the figure that the locations of all the ‘interior’ joints have been significantly changed. In order to confirm that the optimizer has indeed produced a geometry with an improved frequency response it is compared with the original regular boom structure inFig. 5b. To present a value for the reduction in the vibration transmission, the frequency-averaged performance (the attenuation of the mean of the squares of the velocities) in decibels is defined by
a¼10 log10Jnom Jopt
[image:6.544.107.432.64.273.2]where the numerator and the denominator refer to the objective functions of the regular and optimized struc-tures, respectively. The theoretical attenuation for the above optimized structure within the frequency range of 150–250 Hz was found to be 31.0 dB. To verify these results, a 1:1 scale of the optimized design was manu-factured and the forced response tests were repeated, seeFig. 5b. The experimental value for the attenuation was found to be 25.9 dB which is 5.1 dB lower than the expected value. It should be noted that although an optimizer is used here to produce the improved design, it is not suggested that it isoptimalin any sense. In fact, without carrying out an exhaustive search it would not be possible to guarantee such an outcome. Given the number of real valued variables involved and the cost of analysis (particularly when optimal structure and actuator positions are sought as in the following sections), this would not be feasible within realistic time scales.1
Fig. 5a. Geometry of the best design after 30 generations.
1
6. The optimizer
Optimization of the type posed here is characterized by having many variables which are related non-linearly to an objective function that has many peaks and troughs, appropriate optimization strategies must be deployed. The search for methods that can cope with such problems has led to the subject of evolutionary computation. The three main evolutionary methods that are currently in use are: (i) simulated annealing (Kipkpatrick et al., 1983), where the control strategy is based on an understanding of the kinetics of solidifying crystals; (ii) Genetic Algorithms GA (Goldberg, 1989), where the methods of Darwinian evolution are applied to the selection of ‘‘fitter’’ design; (iii) evolutionary programming (Fogel, 1993), which is a more heuristic approach to the problem but which has an increasing number of adherents.Keane (1994b) has applied all of these methods to structural problems and has found that, for the current case, the GA works best.
The GA used here is fairly typical of those discussed in the book byGoldberg (1989)but encompasses a number of ideas that are particularly suited to engineering design problems (Yin and Germay, 1993; Keane, 1993, 1995; Keane and Nair, 2005). Such methods work by maintaining a pool or population of competing designs which are combined to findimprovedsolutions. In their basic form, each member of the population is presented by a binary string that encodes the variables characterizing the design. The search progresses by manipulating the strings in the pool to provide new generations of designs, with on average better prop-erties than their predecessors. The processes that are used to seek these improved designs are set up to mimic those of natural selection, hence the method’s name.
The most commonly used operations in GA are currently: (1)selection according to fitness, i.e., the most promising designs are given a bigger share of the next generation; (2)crossover, where portions of two good designs, chosen at random, are used to form a new design, i.e., two parents ‘‘breed’’ an ‘‘offspring’’; (3) inver-sion, whereby the genetic encoding of a design is modified so that subsequent crossover operations affect dif-ferent aspects of the design; (4)mutation, where small but random changes are arbitrarily introduced into a design. In addition, the number of generations and their size must be chosen, along with a method for dealing
150 160 170 180 190 200 210 220 230 240 250
10-10
10-9
10-8
10-7
10-6
10-5
10-4
10-3
10-2
10-1
Frequency in Hz
Sum of squared velocities at joints 31, 32 and 33
Regular (theory) Regular (experiment)
Optimised (theory)
[image:7.544.98.452.68.350.2]Optimised (experiment)
with constraints (usually by application of a penalty function). The algorithm used here works with 12 bit bin-ary encoding. It uses an elitist survival strategy which ensures that the best of each generation always enters the next generation and has optional niche forming to prevent a few moderately successful designs dominating and so preventing wide ranging searches. Two penalty functions are available to deal with constraints.
The main parameters used to control the method may be summarized as follows:Ngen, the number of gen-erations allowed (default 20);Npop, the population size or number of trials used per generation which is there-fore inversely related to the number of generations given a fixed number of trials in total (default 250);P[best], the proportion of the population that survive to the next generation (default 0.8);P[cross], the proportion of the surviving population that are allowed to breed (default 0.8);P[invert], the proportion of this population that have their genetic material re-ordered (default 0.5);P[mutation], the proportion of the new generation’s genetic material that is randomly changed (default 0.01); a proportionality flag, which selects whether the new generation is biased in favor of the most successful members of the previous generation or alternatively if all P[best] survivors are propagated equally (default TRUE); the penalty function choice.
When using the GA to explore large design spaces with many variables, it has also been found that the method must be prevented from being dominated by a few moderately good designs which prevent further innovation. A number of methods have been proposed to deal with this problem and the one used here is based on McQueen’s Adaptive KMEAN algorithm (Anderberg, 1973) which has been applied with some suc-cess to multi-peak problems (Yin and Germay, 1993). This algorithm subdivides the population into clusters that have similar properties. The members of each cluster are then penalized according to how many members the cluster has and how far it lies from the cluster centre. It also, optionally, restricts the crossover process that forms the heart of the GA, so that large successful clusters mix solely with themselves. This aids convergence of the method, since radical new ideas are prevented from contaminating such sub-pools.
The version of the algorithm used here is controlled by the following: Dmin, minimum non-dimensional Euclidean distance between cluster centres, with clusters closer than this being collapsed (default 0.05);Dmax, maximum non-dimensional Euclidean radius of a cluster, beyond which clusters subdivide (default 0.2);Nclust, the initial number of clusters (default 25);Nbreed, the minimum number of members in a cluster before exclu-sive in-breeding within the cluster takes place (default 5) anda, the penalising index for cluster members which determines how severely members sharing an over crowded niche will suffer, with small numbers giving greater penalty (default 0.5), i.e., the objective functions of members of a cluster ofmsolutions are scaled by
Mminða;1Þ 1 E Dmax
a
þ E
Dmax
a
whereEis the Euclidean distance of the member from its cluster centre (which is always less thanDmax; more-over, whenE=Dmaxno penalty is applied). In addition, the implementation of the GA used here allows the solution of individual members of the population to be run in parallel if a multiple processor computer or clus-ter of compuclus-ters is available.
7. Active vibration control (AVC)
In order to reduce the vibration of the boom at its three right end joints, active vibration control (AVC) was next applied. Here the AVC is taken to be a feed-forward implementation with each frequency considered sep-arately and therefore the problem of non-causality is avoided (this is most suited to tonal vibrations and their harmonics). Feed-forward control requires a coherent reference of the vibration source that is not subject to feedback from the control actuators. In these experiments, the source of vibration disturbance is a force applied to one of the joints near the base of the structure, while the reference signal is independently available from the source.
in this work, seeMoshrefi-Torbati et al. (in press). The actuators used in the experiments are of preloaded open loop Piezoelectric Translator (PZT) types that are high resolution linear actuators suitable for static and dynamic applications.
7.1. Selection of optimal actuator positions on the regular boom
Due to dynamic mechanical coupling between the primary forces and the secondary actuators and their effects at the beam end, the success of AVC heavily depends on the actuator positions in the structure. In this study, the average energy level taken over the frequency bandwidth 150–250 Hz with resolution of 5 Hz (i.e., at 21 equally spaced frequency points) is used as the parameter to be minimized. The performance improve-ment of the AVC subsequently corresponds to maximizing the average attenuation of this parameter.2The control effort (which is an indication of the electrical power required by the actuators and has the arbitrary unitsN2) is evaluated for the 1 N transverse primary input force. Therefore, any increase in the primary force would result in an increase in the control effort proportional to the square of this primary force. It should be noted that the theoretical model used to predict the response of the actively controlled structure has taken into account the passive effects (mass and stiffness) of the actuators.
7.1.1. Single secondary force
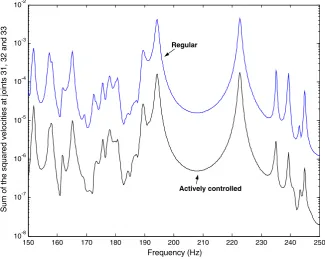
In order to obtain the best position for a single actuator, an exhaustive search across the 93 beams was car-ried out (with a single actuator there is no need to use an optimizer). This showed that the best position for the secondary force is on beam 41 (seeFig. 2b). The receptance code is used to calculate the response of the struc-ture due to this optimum actuator position and the results are compared with the case of no control, as dem-onstrated in Figs. 6a and 6b. The predicted degree of attenuation obtained by this actuator on beam 41 is 15.1 dB. The input force signal to the shaker and the actuators was a stepped-sine wave covering the frequency range of 150–250 Hz. The experimental attenuation value is found to be 16.6 dB which is slightly higher than the predicted value.
It is also noted that the experimental results show many more resonant peaks than the theoretical plots. This arises because of the limitations of the actuators used, which are not entirely rigid and which introduce mechanical noise into the process. Nonetheless, the damping models chosen are clearly consistent as evidenced by the resonant peaks widths seen in the figures. Moreover, despite this noise, the search method used still allows low noise design to be produced because the average responses agree between prediction and experi-ment.Table 1lists the five best positions that have been computationally obtained for one actuator together with five randomly positioned actuators.
These results suggest that the best positions for one actuator always occur on one of the non-diagonal con-necting elements. Moreover, the optimum position is on the middle bay closer to the primary force (i.e., the 5th bay inFig. 2). This implies that within the bandwidth considered, the most effective control with one actu-ator is obtained by blocking the wave propagation path along the boom structure.
It can be seen from the table that the secondary forces are very large compared with the primary unit force. This may be explained by the fact that the secondary forces are acting along the structure (i.e., into a high impedance) whereas the primary force acts transverse to the structure (i.e., into a low impedance). The five randomly selected actuator positions are listed in the table mainly as counter examples in order to clearly show that the selected beam number of 41 is the optimal position.
7.1.2. Two secondary forces
To find the optimum position for two secondary forces, a further exhaustive search was employed which gave beams number 8 and 45 as the best positions. The amount of attenuation obtained by these two actuators acting together is 26.1 dB which is significantly higher than one actuator.Table 2lists the five best computed
2
150 160 170 180 190 200 210 220 230 240 250 10-8
10-7 10-6 10-5 10-4 10-3 10-2
Sum of the squared velocities at joints 31, 32 and 33
Frequency (Hz) Regular
[image:10.544.106.432.69.328.2]Actively controlled
Fig. 6a. Theoretical passive and active objective functions with the single actuator positioned on beam 41.
10-8 10-7 10-6 10-5 10-4 10-3 10-2
Sum of the squared velocities at joints 31, 32 and 33
150 160 170 180 190 200 210 220 230 240 250
Frequency (Hz)
Regular
Actively controlled
[image:10.544.107.430.401.658.2]positions for two actuators. Similar to the one actuator case, the table also demonstrates the optimal value of the actuator position, i.e., when random locations are used a much reduced attenuation is achieved.
The table shows that the best achievable attenuations range from 23.0 dB to 26.1 dB and the total control effort required to achieve these attenuations vary from 10.42·105to 17.24·105N2. No experiments are car-ried out for this case and instead experiments are repeated only for the case of three actuators.
7.1.3. Three secondary forces
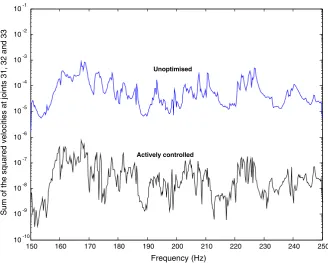
As a result of an extensive GA search, the best positions for the three actuators were found to be on beams 23, 60 and 71. This gives an average predicted reduction of 33.5 dB. The overall objective functions that are obtained from the experimental responses are shown inFigs. 7a and 7b. The experimental attenuation is found to be 31.7 dB which is slightly less than the predicted value. The agreement between the two sets of data of course depends on the potential sources of error in both experiments and theory.
A main source of error in experiments is the low signal to noise ratio of the actuators. Increasing the input gain could have pushed the actuators’ outputs into their non-linear regions and so their outputs were neces-sarily small. Two possible sources of error in the theoretical model are the approximation of joints and ele-ments (e.g., nuts, screws, force transducers) on the rods where the actuators are placed and the assumption of actuators being completely rigid.
8. Optimal actuator positions on the passively optimized boom
[image:11.544.39.507.87.210.2]Next, optimal positions for three actuators were sought on the geometry of the already passively optimized structure. After an extensive GA search, the positions on elements 16, 27 and 48 were found to produce the best performance, giving an overall reduction of around 48.7 dB. Comparisons of the experimental data with
Table 1
The five best and five random positions for a single actuator
Actuator positions Attenuation (dB) Control effort (N2)
Top best actuator locations 41 15.1 3.01·105
50 13.8 4.64·105
40 12.9 3.38·105
49 12.6 4.31·105
31 10.8 4.06·105
Random actuator locations 11 3.0 4.05·105
16 5.3 3.76·105
39 3.7 3.93·105
62 7.6 4.57·105
79 3.7 4.26·105
Table 2
The five best and five random locations for two actuators
Actuator positions Attenuation (dB) Control effort (N2)
Top best actuator locations 8, 45 26.1 10.68·105
8, 53 24.8 10.66·105
20, 45 24.6 17.24·105
11, 45 23.4 10.97·105
44, 8 23.0 10.42·105
Random actuator locations 53, 12 12.7 6.45·105
51, 93 4.1 3.30·105
59, 44 16.4 7.48·105
47, 92 7.2 6.76·105
[image:11.544.41.512.264.387.2]Unoptimised
Actively controlled
150 160 170 180 190 200 210 220 230 240 250
Frequency (Hz)
10-10 10-9 10-8 10-7 10-6 10-5 10-4 10-3 10-2 10-1
[image:12.544.108.435.67.327.2]Sum of the squared velocities at joints 31, 32 and 33
Fig. 7a. Theoretical passive and active objective functions with three actuators positioned on beams 23, 60 and 71.
150 160 170 180 190 200 210 220 230 240 250
10-10 10-9 10-8 10-7 10-6 10-5 10-4 10-3 10-2 10-1
Frequency (Hz)
Unoptimised
Actively controlled
Sum of the squared velocities at joints 31, 32 and 33
[image:12.544.106.435.396.659.2]the theoretical predictions inFig. 8 show reasonable agreement indicating that the expected attenuation is broadly achieved. The measured experimental attenuation level is found to be at a lower level of 40.4 dB.
9. Simultaneous active and passive optimization
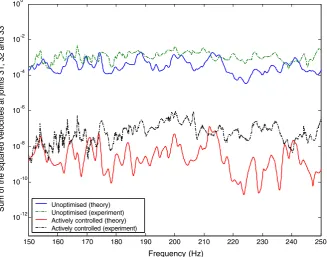
Lastly, a GA search is used to simultaneously search for a geometry and combination of actuator locations that would achieve good performance with less radical geometric perturbations than considered thus far. A three actuator design with deviations of only ±4.5 cm is found here to give isolations considerably in excess of that possible by carrying out the optimization in two, separate stages. The theoretical attenuation is 49.5 dB and the corresponding value is found to be 42.8 dB. The experimental and theoretical objective functions are plotted inFig. 9. It is worth noting here that unfortunately such a design has rather poorer performance when the control system is turned off than a purely passive design. This is a trade-off the designer must consider bearing in mind the likely mission profiles and the degree of resilience usually desired in the vibration suppres-sion system.
10. Overall performance curve
To demonstrate and compare the effects of passive and active control using various configurations, a gen-eral performance graph is produced inFig. 10. This graph serves to summarize all the information on both passive and active configurations and acts as a guide to the designer. By referring to the graph, a designer should be able to decide on the level of passive control (i.e., percentage deviation from regular geometry), active control (i.e., number of actuators) or combination of the two in order to achieve a desired degree of noise reduction. This graph is produced here for the two stage optimization procedure and further improve-ments are possible if combined geometric and active optimization is carried out.
10-12 10-10 10-8 10-6 10-4 10-2 100
Unoptimised (theory) Unoptimised (experiment) Actively controlled (theory) Actively controlled (experiment)
150 160 170 180 190 200 210 220 230 240 250
Frequency (Hz)
[image:13.544.113.441.70.327.2]Sum of the squared velocities at joints 31, 32 and 33
From the figure it can be concluded that:
1. Similar amounts of attenuation can be achieved either using one actuator or applying 20% deviation to the joints.
2. The amount of additional attenuation that is achieved on the regular structure (i.e., with 0% deviation) falls off as first two and then three actuators are added.
3. With no actuators, increasing the structural deviation increases the attenuation until 20% deviation is reached, after which further gains are difficult to achieve.
4. The fall-off in added attenuation with increased structural deviation occurs earlier when three actuators are used.
Unoptimised (theory) Unoptimised (experiment) Actively controlled (theory) Actively controlled (experiment)
150 160 170 180 190 200 210 220 230 240 250
Frequency (Hz) 10-12
10-10 10-8 10-6 10-4 10-2 100
[image:14.544.106.435.67.327.2]Sum of the squared velocities at joints 31, 32 and 33
Fig. 9. Theoretical and experimental passive and simulated active objective functions for three actuators placed on elements 6, 7 and 8.
0 10 20 30 40 50 60
0 5 10 15 20 25
Percentage deviation (%)
Attenuation (±10dB)
No Actuator 1 Actuators 2 Actuators 3 Actuators
[image:14.544.163.380.365.523.2]Finally, it should be noted that the location of an actuator within a beam is an important quantity that is not discussed here. Further work should examine whether a judicious choice of location along each beam would further enhance the capabilities of each actuator.
11. Conclusions
This paper has demonstrated that geometric modifications to space structures can be used to achieve impressive vibration isolation capabilities. Such reductions are compatible with active control systems and the complex geometries required can be readily manufactured and assembled using typical numerically con-trolled machining facilities. Whether or not the passive capability is designed independently of the active sys-tem would depend on issues of syssys-tem redundancy and mission profile. The key impact of this work is the identification of appropriate design strategies for producing satellite structures with very low vibration signa-tures. It is shown here that different combinations of geometric modification and numbers of active elements can be used to select the degree of noise isolation desired, during the design process. Thus designers may trade the complexity of the active system against the complexity of the geometry when designing new structures.
Acknowledgement
This work was supported by the EPSRC under grant reference GR/M33624 and by Astrium Space.
References
Anderberg, M.R., 1973. Cluster Analysis for Applications. Academic Press, Inc., New York, NY.
Anthony, D.K., Elliott, S.J., Keane, A.J., 2000. Robustness of optimal design solutions to reduce vibration transmission in a lightweight 2-D structure, Part I: Geometric design. Journal of Sound and Vibration 229 (3), 505–528.
Denoyer, K.K., Johnson, C., 2001. Recent achievements in vibration isolation systems for space launch and on-orbit applications. Presented at the 52nd International Astronautical Congress Toulouse, France.
Fogel, D.B., 1993. Applying evolutionary programming to selected travelling salesman problems. Cybernetics and Systems 24 (1), 27–36. Goldberg, D.E., 1989. Genetic Algorithm in Search, Optimization and Machine Learning. Addison-Wesley, Cambridge, MA. Johnson, C., Ikegami, D.W., Austin, R. (Boeing Aerospace Co., Seattle, WA), Eric, M. (CSA Engineering, Inc., Palo Alto, CA), 1987. The
design and analysis of passive damping for aerospace systems. AIAA Journal, pp. 891.
Keane, A.J., 1993. Structural design for enhanced noise performance using Genetic Algorithm and other optimization techniques. In: Albrecht, R.F., Reeves, C.R., Steele, N.C. (Eds.), Proceedings of the International Conference on Artificial Neural Nets and Genetic Algorithms. Springer-Verlag, Innsbruck, pp. 536–543.
Keane, A.J., 1994a. OPTIONS Design Exploration System User Guide and Reference Manual. Available from:<http://www.soton.ac.uk/ ~ajk/options/welcome.html>.
Keane, A.J., 1994b. Experiences with optimizers in structural design. In: Parmee, I.C. (Ed.), Proceedings of the Conference on Adaptive Computing in Engineering Design and Control 94, Plymouth, UK, pp. 14–27.
Keane, A.J., 1995. Genetic algorithm optimization of multi-peak problems: studies in convergence and robustness. Artificial Intelligence in Engineering 9 (2), 75–83.
Keane, A.J., 2002. The place of evolutionary search tools in problem solving environments for aerospace design. In: Giannakoglou, K., Tsahalis, D., Periaux, J., Papailiou, K., Fogarty, T. (Eds.), Evolutionary Methods for Design, Optimisation and Control with Applications to Industrial Problems—Proc. EUROGEN 2001, Athens, CIMNE, ISBN:84-89925-97-6, Barcelona, pp. 3–10. Keane, A.J., Nair, P.B., 2005. Computational Approaches for Aerospace Design. John-Wiley and Sons, 602 pp.
Kipkpatrick, S., Gelatt Jr., C.D., Vecchi, M.P., 1983. Optimization by simulated annealing. Science 220 (4598), 671–680.
Lee-Glauser, G.J., Ahmadi, G., Layton, J., 1996. Satellite active and passive vibration control during liftoff. Journal of Spacecraft and Rockets 33 (3), 428–432.
Melody, J.W., Briggs, H.C., 1993. Analysis of structural and optical interactions of the Precision Optical Interferometer. In: Proc. SPIE 1947, pp. 44–57.
Melody, J.W., Neat, G.W., 1996. Integrated modeling methodology validation using the micro-precision interferometer testbed. In: Proceedings of the 35th IEEE Conference on Decision and Control, Kobe, Japan.
Moshrefi-Torbati, M., Keane, A.J., Elliott, S.J., Brennan, M.J., Rogers, E., 2003. Passive vibration control of a satellite boom structure by geometric optimisation using a Genetic Algorithm. Journal of Sound and Vibration 267, 879–892.
Moshrefi-Torbati, M., Keane, A.J., Elliott, S.J., Brennan, M.J., Anthony, D.K., Rogers, E., in press. Active vibration control (AVC) of a satellite boom structure using optimally positioned stacked piezoelectric actuators. Journal of Sound and Vibration.
Sirlin, S.W., Laskin, R.A., 1990. Sizing of active piezoelectric struts for vibration suppression on a space-based interferometer. In: Proceedings of the 1st US/Japan Conference on Adaptive Structures, pp. 47–63.