QUARTERLY
ECONOMIC
COMMENTARY
WINTER 201
8
KIERAN MCQUINN
, CONOR O'TOOLE
, MATTHEW ALLEN-COGHLAN
AND
PHILIP ECONOMIDES
ECONOMIC
FORECASTING
December
2018
QUARTERLY ECONOMIC COMMENTARY
Kieran McQuinn
Conor O’Toole
Matthew Allen-Coghlan
Philip Economides
Winter 2018
The forecasts in this Commentary are based on data available by 20 November 2018
Draft completed on 26 November 2018
A subscription to the Quarterly Economic Commentary costs €327 per year, including VAT and postage.
© The Economic and Social Research Institute, Whitaker Square, Sir John Rogerson’s Quay, Dublin 2.
ISBN 978-0-7070-0480-8 ISSN 0376-7191
DOI https://doi.org/10.26504/qec2018win
ABOUT THE ESRI
The Economic and Social Research Institute is an independent research institute working towards a vision of ‘Informed policy for a better Ireland’. The ESRI seeks to support sustainable economic growth and social progress in Ireland by providing a robust knowledge base capable of providing effective solutions to public policy challenges.
The Institute was founded in 1960 by a group of senior civil servants, led by Dr T.K. Whitaker, who identified the need for independent and in-depth research to support the policymaking process in Ireland. Since then, the Institute has remained committed to independent research and its work is free of any expressed ideology or political position. The Institute publishes all research reaching the appropriate academic standard, irrespective of its findings or who funds the research.
The ESRI brings together leading experts from a variety of disciplines who work together to break new ground across a number of research initiatives. The expertise of its researchers is recognised in public life and researchers are represented on the boards and advisory committees of several national and international organisations.
ESRI researchers uphold the highest academic standards. The quality of the Institute’s research output is guaranteed by a rigorous peer review process. Research is published only when it meets the required standards and practices. Research quality has also been assessed as part of two peer reviews of the Institute, in 2010 and 2016.
ESRI research findings are disseminated widely in books, journal articles and reports. Reports published by the ESRI are available to download, free of charge, from its website. ESRI staff members communicate research findings at regular conferences and seminars, which provide a platform for representatives from government, civil society and academia to discuss key findings from recently published studies and ongoing research.
THE AUTHORS
The Commentary is edited by Kieran McQuinn and Conor O’Toole. Kieran McQuinn is Research Professor and Conor O’Toole is a Senior Research Officer at the Economic and Social Research Institute (ESRI). Matthew Allen-Coghlan and Philip Economides are Research Assistants at the ESRI.
Research Notes are short papers on focused research issues. They are subject to
refereeing prior to publication.
Special Articles are published in the QEC in order to foster high-quality debate on
various aspects of the Irish economy and Irish economic policy. They are subject to refereeing prior to publication.
TABLE OF CONTENTS
Summary Table ... ii
National Accounts 2017, 2018, 2019 ... iii
CHAPTERS The Irish Economy – Forecast Overview ... 1
The International Economy ... 3
The Domestic Economy ... 18
General Assessment ... 60
Detailed Forecast Tables ... 63
RESEARCH NOTES Capacity constraints in the Irish economy? A partial equilibrium approach Kieran McQuinn ... 69
The Financial Crisis and the Changing Profile of Mortgage Arrears in Ireland M. Fahy, C. O’Toole and R. Slaymaker ... 83
SUMMARY TABLE
2015 2016 2017 2018 2019 Output (Real Annual Growth %)
Private Consumer Expenditure 3.6 4.0 1.6 2.6 2.3
Public Net Current Expenditure 1.4 3.5 3.9 4.5 5.0
Investment 50.8 51.7 -31.0 -6.3 9.8
Exports 39.3 4.4 7.8 8.7 5.2
Imports 33.2 18.5 -9.4 1.7 6.3
Gross Domestic Product (GDP) 25.1 5.0 7.2 8.2 4.2
Gross National Product (GNP) 13.8 11.5 4.4 7.8 3.8
Prices (Annual Growth %)
Consumer Price Index (CPI) -0.3 0.0 0.3 0.6 1.1
Growth in Average Hourly Earnings 2.8 2.5 1.5 2.6 2.9
Labour Market
Employment Levels (ILO basis (‘000)) 2,057 2,132 2,194 2,258 2,331
Unemployment Levels (ILO basis (‘000)) 226 195 158 142 118
Unemployment Rate (as % of Labour Force) 10.0 8.4 6.7 5.7 5.1
Public Finance
General Government Balance (€bn) -4.9 -1.5 -0.8 -1.5 -2.4
General Government Balance (% of GDP) -1.9 -0.5 -0.4 -0.5 -0.7
General Government Debt (% of GDP) 76.8 73.4 68.4 64.3 62.0
External Trade
Balance of Payments Current Account (€bn) 11.6 -11.4 24.9 38.4 36.3
Current Account (% of GNP) 5.8 -5.1 10.7 15.2 13.6
Note: Detailed forecast tables are contained in an Appendix to this Commentary.
NATIONAL ACCOUNTS 2017
A: EXPENDITURE ON GROSS NATIONAL PRODUCT
2016 2017 Change in 2017
€ bn € bn Value Price Volume
Private Consumer Expenditure 96.6 99.9 3.1 1.3 1.6
Public Net Current Expenditure 27.8 29.6 6.5 2.5 3.9
Gross Fixed Capital Formation 97.6 69.0 -29.3 2.4 -31.0
Exports of Goods and Services 328.2 352.6 7.4 -0.3 7.8
Physical Changes in Stocks 6.4 3.5
Final Demand 557.0 554.6 -0.4 0.5 -0.9 less:
Imports of Goods and Services 271.1 263.3 -7.9 1.6 -9.4
Statistical Discrepancy 2.1 2.8
GDP at Market Prices 273.2 294.1 7.6 0.4 7.2 Net Factor Payments -51.1 -61.0
GNP at Market Prices 222.2 233.1 4.9 0.5 4.4
B: GROSS NATIONAL PRODUCT BY ORIGIN
2016 2017 Change in 2017
€ bn € bn € bn %
Agriculture 3.3 4.2 0.9 27.0
Non-Agriculture: Wages, etc. 81.8 85.7 3.9 4.7
Other 102.2 113.3 11.1 10.8
Adjustments: Stock Appreciation 1.1 0.0
Statistical Discrepancy 0.5 -2.8
Net Domestic Product 236.7 250.6 13.9 5.9 Net Factor Payments -51.1 -61.0 -9.9 19.3
National Income 185.6 189.6 4.0 2.2
Depreciation 63.9 72.0 8.1 12.6
GNP at Factor Cost 249.5 261.6 12.1 4.8 Taxes less Subsidies -27.4 -28.4 -1.1 3.9
GNP at Market Prices 222.2 233.1 11.0 4.9
C: BALANCE OF PAYMENTS ON CURRENT ACCOUNT
2016 2017 Change in 2017
€ bn € bn € bn
X – M 42.4 89.3 46.9
F -49.9 -59.8 -9.9
Net Transfers -3.8 -4.6 -0.8
Balance on Current Account -11.4 24.9 36.3
NATIONAL ACCOUNTS 2018
A: EXPENDITURE ON GROSS NATIONAL PRODUCT
2017 2018 Change in 2018
€ bn € bn Value Price Volume
Private Consumer Expenditure 99.9 104.0 4.1 1.5 2.6
Public Net Current Expenditure 29.6 31.8 7.5 2.9 4.5
Gross Fixed Capital Formation 69.0 67.0 -3.0 3.6 -6.3
Exports of Goods and Services 352.6 383.5 8.8 0.0 8.7
Physical Changes in Stocks 3.5 3.0
Final Demand 554.6 589.3 6.3 0.9 5.3 less:
Imports of Goods and Services 263.3 269.1 2.2 0.5 1.7
Statistical Discrepancy 2.8 -0.1
GDP at Market Prices 294.1 320.2 8.9 0.6 8.2 Net Factor Payments -61.0 -67.1
GNP at Market Prices 233.1 253.1 8.6 0.7 7.8
B: GROSS NATIONAL PRODUCT BY ORIGIN
2017 2018 Change in 2018
€ bn € bn € bn %
Agriculture 4.2 4.3 0.1 2.5
Non-Agriculture: Wages, etc. 85.7 90.7 5.0 5.8
Other 113.3 117.0 3.7 3.3
Adjustments: Stock Appreciation 0.0 0.0
Statistical Discrepancy -2.8 0.1
Net Domestic Product 250.6 273.2 22.7 9.0 Net Factor Payments -61.0 -67.1 -6.1 10.1
National Income 189.6 206.1 16.5 8.7
Depreciation 72.0 74.8 2.8 3.9
GNP at Factor Cost 261.6 280.9 19.3 7.4 Taxes less Subsidies -28.4 -27.8 0.6 -2.1
GNP at Market Prices 233.1 253.1 19.9 8.6
C: BALANCE OF PAYMENTS ON CURRENT ACCOUNT
2017 2018 Change in 2018
€ bn € bn € bn
X – M 89.3 114.4 25.1
F -59.8 -70.8 -11.1
Net Transfers -4.6 -5.1 -0.6
Balance on Current Account 24.9 38.4 13.5
NATIONAL ACCOUNTS 2019
A: EXPENDITURE ON GROSS NATIONAL PRODUCT
2018 2019 Change in 2019
€ bn € bn Value Price Volume
Private Consumer Expenditure 104.0 108.2 4.0 1.7 2.3
Public Net Current Expenditure 31.8 33.9 6.6 1.5 5.0
Gross Fixed Capital Formation 67.0 75.5 12.8 2.7 9.8
Exports of Goods and Services 383.5 407.1 6.2 1.0 5.2
Physical Changes in Stocks 3.0 3.0
Final Demand 589.3 627.8 6.5 1.3 5.1
less:
Imports of Goods and Services 269.1 289.4 7.6 1.2 6.3
Statistical Discrepancy -0.1 -0.1
GDP at Market Prices 320.2 338.3 5.7 1.4 4.2
Net Factor Payments -67.1 -71.7
GNP at Market Prices 253.1 266.6 5.3 1.5 3.8
B: GROSS NATIONAL PRODUCT BY ORIGIN
2018 2019 Change in 2019
€ bn € bn € bn %
Agriculture 4.3 4.3 0.1 1.4
Non-Agriculture: Wages, etc. 90.7 96.0 5.3 5.9
Other 117.0 120.1 3.1 2.6
Adjustments: Stock Appreciation 0.0 0.0
Statistical Discrepancy 0.1 0.1
Net Domestic Product 273.2 289.4 16.2 5.9 Net Factor Payments -67.1 -71.7 -4.6 6.8
National Income 206.1 217.7 11.6 5.6
Depreciation 74.8 77.5 2.7 3.6
GNP at Factor Cost 280.9 295.2 14.3 5.1 Taxes less Subsidies -27.8 -28.6 -0.7 2.6
GNP at Market Prices 253.1 266.6 13.5 5.3
C: BALANCE OF PAYMENTS ON CURRENT ACCOUNT
2018 2019 Change in 2019
€ bn € bn € bn
X – M 114.4 117.7 3.3
F -70.8 -75.7 -4.8
Net Transfers -5.1 -5.7 -0.6
Balance on Current Account 38.4 36.3 -2.2
The Irish Economy – Forecast Overview
The Irish economy looks set to register another very strong year of growth in 2018, with the outlook remaining positive as well for 2019. While difficulties persist with the interpretation of the National Accounts, it is fair to say that the growth performance in 2018 has been broadly based with both domestic and external factors contributing significantly to the growth performance.
Overall, while headline GDP suggests a growth rate of over 8 per cent for the economy, underlying economic activity grew somewhere in the region of 4.5 to 5 per cent.
While the outlook for 2019 is also positive for the Irish economy, next year will see a number of significant challenges mainly from an international perspective. The outcome of the Brexit process is particularly important. A relatively benign UK exit such as the establishment of a European Economic Area agreement would see the Irish economy grow by 3 per cent in 2019, compared to a 4 per cent outcome where the UK remains in the EU. If the United Kingdom were to leave under a WTO style agreement, then Irish economic activity in 2019 would grow by just over 2.5 per cent in 2019. The forecasts of the Commentary assume the UK’s continuation of effective membership within the EU.
Notwithstanding the challenges posed by international developments, the persistently strong growth rate of the domestic economy does lead to questions as to the sustainability of economic performance going forward. In a Research Note to the Commentary, McQuinn addresses the implications of increased residential activity in terms of the labour market and the financial sector. Overall, while both credit and employment levels associated with construction are quite low at present, a significant increase in housing supply would likely see a sizeable increase in both the balance sheets of the Irish banking sector and the rate of inward net migration.
The International Economy
International developments in 2018 have been largely shaped by increased global trade tensions, uncertainties around Brexit and the Federal Reserve’s continued interest rate increases in response to growing inflationary pressure. As 2018 progresses, economic headwinds have reduced growth relative to 2017. These pressures include increased financial stress, heightened trade barriers and increased debt levels among emerging market nations. These growing concerns are reflected in recent updates to the IMF’s global economic outlook,
downgrading world output growth to 3.7 per cent for both 2018 and 2019.1
According to preliminary estimates of year-on-year real GDP growth, economic activity in the European Union continues to slow, falling from 2.1 per cent in Q2 2018 to 1.9 per cent Q3 2018. This slowdown is felt most strongly in Italy, with a 0.8 per cent growth rate, far below the EU average. As of September 2018, unemployment has fallen to 8.1 per cent for the Euro Area with rates ranging from a low of 2.3 per cent in the Czech Republic to a high of 19.0 per cent in Greece. As of October 2018, the ECB has tapered quantitative easing to €15 billion per month and is likely to end net purchases in January 2019. Interest rate increases are expected to be introduced after the summer of 2019. Inflation in the Euro Area averaged 2.1 per cent in Q3 2018, reaching 2.2 per cent as of October 2018.
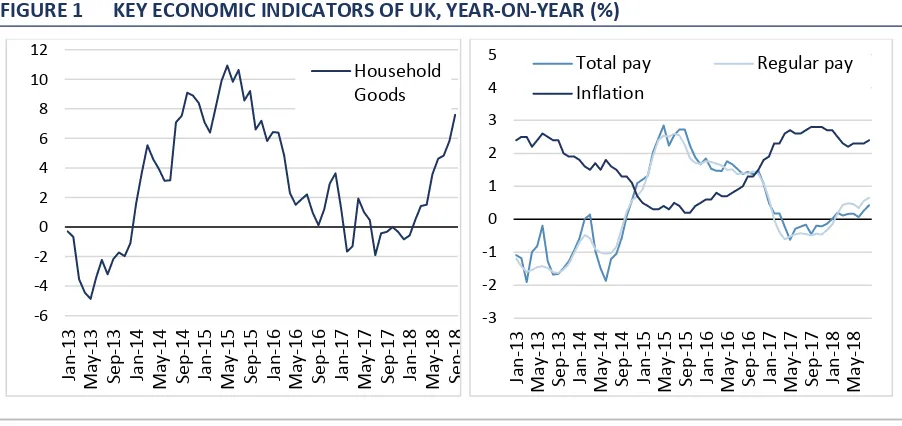
While real GDP growth in the UK has trended downwards since Q1 2015, the past two quarters of activity suggest the economy has recently gained momentum. Real GDP grew by 1.5 per cent in Q3 2018 relative to the same period last year. Figure 1 details recent activity in both the labour market and domestic sales. Retail sales of household goods have recovered in 2018, with seasonally-adjusted values averaging an increase of 7.6 per cent between July and September. Unemployment has continued to remain low throughout the year, most recently averaging 4.1 per cent between July and September.
However, strong inflationary pressure has caused real earnings to decline since November 2016. While British incomes have stalled, Figure 1 suggests expenditure is rising both in terms of volume and through increased prices. According to a recent ONS article, expenditure outweighed personal incomes by
1 International Monetary Fund, 2018. World Economic Outlook: Challenges to Steady Growth, Washington, D.C.:
an average of £900 per UK household in 2017, making households net borrowers
[image:15.595.72.523.134.347.2]for the first time since 1988.2
FIGURE 1 KEY ECONOMIC INDICATORS OF UK, YEAR-ON-YEAR (%)
Sources: ONS,Retail sales, Great Britain: September 2018 (LHS), ONS database,UK labour market: October 2018 (RHS).
Note: Total pay includes bonuses while regular pay excludes bonus payments. Chained Volume of Retail Sales using seasonally-adjusted index numbers of sales per week and percentage increase on a year earlier.
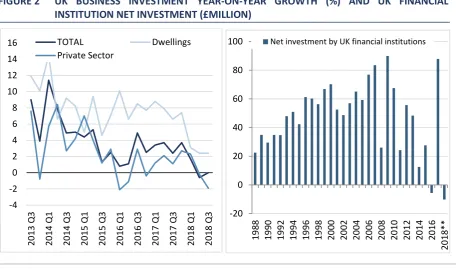
Investment in the UK continues to decline in 2018, which is likely due to the ongoing uncertainty concerning key Brexit negotiations. As displayed in Figure 2, growth rates in total, private and construction investment have trended downwards over the past five years, and are now experiencing negative growth rates. The large surge in investment among UK financial institutions in 2017 appears to have reversed in recent quarters. This surge included the UK’s highest annual acquisition of short-term assets since 2007, a common sign of uncertain investors shifting towards liquid portfolios. While the UK has a history of net investment over the last three decades, recent data for Q1 and Q2 of 2018 suggest the UK could experience a historically high level of disinvestment among domestic financial institutions.
2 Office of National Statistics, 2018. ‘Making ends meet: are households living beyond their means?’, July 2018.
-6 -4 -2 0 2 4 6 8 10 12 Jan -13 Ma y-1 3 Se p -13 Jan -14 Ma y-1 4 Se p -14 Jan -15 Ma y-1 5 Se p -15 Jan -16 Ma y-1 6 Se p -16 Jan -17 Ma y-1 7 Se p -17 Jan -18 Ma y-1 8 Se p -18 Household Goods -3 -2 -1 0 1 2 3 4 5 Jan -13 Ma y-1 3 Se p -13 Jan -14 Ma y-1 4 Se p -14 Jan -15 Ma y-1 5 Se p -15 Jan -16 Ma y-1 6 Se p -16 Jan -17 Ma y-1 7 Se p -17 Jan -18 Ma y-1 8
Total pay Regular pay
FIGURE 2 UK BUSINESS INVESTMENT YEAR-ON-YEAR GROWTH (%) AND UK FINANCIAL INSTITUTION NET INVESTMENT (£MILLION)
Source: ONS,Business investment real-time database (LHS),
ONS, Investment by insurance companies, pension funds and trusts: April to June 2018 (RHS).
As of late November 2018, the European Council has endorsed the Agreement on the withdrawal of the United Kingdom from the European Union. While the proposed Withdrawal Agreement has been met with mixed reception in British Parliament, a meaningful vote on the potential deal will not occur until December 11th 2018. The draft proposes a transition period until the end of 2020. During this period the UK will be able to continue participating in the EU Customs Union and the Single Market, enabling all four freedoms of movement.
As part of this agreement, the Protocol on Ireland and Northern Ireland, commonly referred to as the Irish backstop agreement, will be effective from the end of the transition period onwards. Until a subsequent agreement is negotiated between Europe and the UK, the backstop would enable a ‘single EU-UK customs
territory’.3 The UK’s National Institute of Economic and Social Research (NIESR)
has published a report detailing the estimated effects of the proposed Brexit deal
through use of their global macroeconomic model, NiGEM.4 Relative to the most
beneficial scenario of the UK staying in the EU, all other scenarios result in
3 A Singles Customs Territory would require the UK to align with EU tariffs and regulations. There would be no trade
barriers such as tariffs, quotas or checks on rules of origin excluding cases for fishing and aquaculture products. The UK would be unable to lower customs tariffs below the EU Common Customs Tariff. Under this arrangement, Northern Ireland’s businesses may export products to EU’s internal market without restriction. Products from outside of Northern Ireland would require that the processes provided for in the Union Customs Code would have to be applied.
4 Hantzsche, A., A. Kara and G. Young (2018). ‘The Economic Effects of the Government’s Proposed Brexit Deal’, the
National Institute of Economic and Social Research (NIESR). -4 -2 0 2 4 6 8 10 12 14 16 20 13 Q3 20 14 Q1 20 14 Q3 20 15 Q1 20 15 Q3 20 16 Q1 20 16 Q3 20 17 Q1 20 17 Q3 20 18 Q1 20 18 Q3 TOTAL Dwellings Private Sector -20 0 20 40 60 80 100 19 88 19 90 19 92 19 94 19 96 19 98 20 00 20 02 20 04 20 06 20 08 20 10 20 12 20 14 20 16 20 18* *
economic losses. The currently proposed deal strikes a middle-ground of losses, wedged between potential upsides of an Irish backstop scenario and downsides of an orderly no-deal outcome. By 2030, the report estimates the proposed deal will result in GDP losses of £1,090 per head (overall GDP down 3.9 per cent) relative to a ‘stay’ scenario. In a separate study, the London School of Economics (LSE), King’s College London and the Institute for Fiscal Studies have jointly modelled the consequences of the proposed Brexit deal relative to a baseline of
continued EU membership.5 Between 2020 and 2030, the report estimates lower
GDP per capita, ranging from 1.9 per cent to 5.5 per cent, relative to continued EU membership. In the Output section of the Commentary we examine the implications for the short-run domestic forecast of different Brexit scenarios.
The US economy grew at an annual rate of 3.5 per cent in Q3 2018. Personal consumption contributed 2.7 percentage points towards this increase. As of October 2018, the US unemployment rate declined to 3.7 per cent, a level consistent with full employment. The outlook for inflation remains on target following the Federal Reserve raising the official US interest rate to a range of 2 to 2.25 per cent in September 2018. Given the strong inflationary pressure introduced by a combination of stimulatory fiscal policy, tightened labour market conditions and rising trade protectionism throughout 2018, a fourth increase in the official US interest rate range to 2.25-2.5 per cent in December 2018 seems likely.
Trade performance for the US weakened in Q3 2018, following a 7 per cent year-on-year decline in the export of goods and a 9 per cent increase in imports. Between January and September, the US trade deficit in 2018 expanded by 9.5 per cent relative to the same period last year. Following the implementation of bilateral trade tariffs between July and September, Figure 3 highlights a significant decline in US exports. The overall impact on US-China trade has resulted in a 10 per cent rise in the trade deficit between January and September of 2018 relative to the same period last year. This extends the US-China trade deficit to a record high of $40 billion.
5 Levell, P., A. Menon, J. Portes and T. Sampson, (2018). ‘The Economic Consequences of the Brexit Deal’, Centre of
FIGURE 3 US-CHINA SEASONALLY-ADJUSTED IMPORTS AND EXPORTS, Y-O-Y GROWTH (%)
Source: United States Census Bureau, US Export and Import data for goods.
Real GDP in China grew year-on-year by 6.5 per cent in Q3 2018, its lowest increase since early 2009. Pressures in the banking sector, potential US tariff rate increases in January and attempts at curtailing growth in the real estate market appear to be impacting on growth in the Chinese economy.
China’s National Bureau of Statistics’ most recent release of housing data reveals the annual moving average of real estate investment increased by 9.7 per cent, year-on-year, in October 2018. As Figure 4 highlights, activity has been primarily focused on residential property (+13.7 per cent) while offices and houses for
business6 both continued to experience significant declines in investment. A
recent moderation of activity in the Chinese real estate market comes in tandem with the introduction of price caps on new apartments and limitations on the resale of real estate purchases.
6
This is a term used by China’s national statistics office. ‘Houses for business’ represent four times the value of offices in China thus are a significant and unique component of commercial real estate in the sector.
-45,000 -36,000 -27,000 -18,000 -9,000 0 9,000 18,000 27,000 36,000 -50 -40 -30 -20 -10 0 10 20 30 40 Se p -15 N o v-15 Jan -16 Ma r-16 Ma y-1 6 Ju l-16 Se p -16 N o v-16 Jan -17 Ma r-17 Ma y-1 7 Ju l-17 Se p -17 N o v-17 Jan -18 Ma r-18 Ma y-1 8 Ju l-18 Se p -18
FIGURE 4 US-CHINA SEASONALLY-ADJUSTED IMPORTS AND EXPORTS, Y-O-Y GROWTH (%)
Source: National Bureau of Statistics of China.
Real GDP in Japan grew year-on-year by 0.4 per cent for Q3 2018, following poor export performance and continued declines in private residential investment. Other developments in the Japanese economy include record levels of job availability, a decline in the unemployment rate to 2.3 per cent and low annual inflation of 0.4 per cent in September. This labour shortage is likely to contribute towards poor economic activity. With Japan and six other nations having ratified the ‘Comprehensive and Progressive Agreement for Trans-Pacific Partnership’
(CPTPP),7 the agreement is due to come into effect at year end. This promising
trade relationship combined with Japan’s success in forestalling potential automobile tariffs are targeted at boosting growth.
Developments in oil prices
As displayed in Figure 5, trends in global oil prices suggest a recent softening of inflationary pressure. Average oil prices from January to early November had increased between 33 and 37 per cent for Brent crude and WTI crude, respectively, relative to the same period last year. Although sanctions on the Iranian economy came into effect on 4 November, this restriction on supply was
7 The CPTPP was originally known as TPP, as Trans-Pacific Trade Agreement that had been signed in 2016 but never
entered into force as a result of the US withdrawing. The remaining 11 nations held a formal signing ceremony for CPTPP, which no longer requires the participation of the US. Since agreement has been ratified by the majority of signatory nations, CPTPP will be effective from December 30th 2018 onwards.
-20% -10% 0% 10% 20% 30% 40% 50% 60% Fe b -10 Ju n -10 O ct -10 Fe b -11 Ju n -11 O ct -11 Fe b -12 Ju n -12 O ct -12 Fe b -13 Ju n -13 O ct -13 Fe b -14 Ju n -14 O ct -14 Fe b -15 Ju n -15 O ct -15 Fe b -16 Ju n -16 O ct -16 Fe b -17 Ju n -17 Oc t-17 Fe b -18 Ju n -18 O ct -18
Total Investment Residential Offices
largely outweighed by an OPEC pact formed in June 2018, which strongly boosted
global oil production.8
While concerns of a global slowdown rise and fears of an oil supply gap subside, both Brent and WTI crude oil prices have fallen by approximately 15 per cent between early October and November of 2018. Prices may fall further during the remainder of the year as risks of greater US-Chinese trade tensions and currency volatility among emerging markets threaten global demand. From an Irish perspective, low oil prices may lead to an extended period of low inflation and reduced pressures on household expenses.
FIGURE 5 CRUDE OIL PRICES, NOT SEASONALLY-ADJUSTED ($ PER BARREL)
Sources: Federal Reserve Bank of St. Louis.
Note: Q4 2018 uses average of daily prices between October 1 and November 5.
Figure 6 summarises the forecasts for GDP growth produced by the major institutions of their respective economies. These forecasts signal a broad-based expectation of economic moderation across the majority of developed economies.
8 According to October’s Reuters survey of OPEC supply, oil production rose by 390,000 barrels per day relative to
September 2018. 0 20 40 60 80 100 120 140 20 12-08 20 12-11 20 13-02 20 13-05 20 13-08 20 13-11 20 14-02 20 14-05 20 14-08 20 14-11 20 15-02 20 15-05 20 15-08 20 15-11 20 16-02 20 16-05 20 16-08 20 16-11 20 17-02 20 17-05 20 17-08 20 17-11 20 18-02 20 18-05 20 18-08 20 18 -11
FIGURE 6 REAL GDP GROWTH (% CHANGE, YEAR-ON-YEAR)
Euro Area United States United Kingdom
Sources: FocusEconomics, IMF, OECD, HM Treasury and Federal Reserve.
I
MPLICATIONS FORI
RISHE
XPORTS,
I
MPORTS AND THEB
ALANCE OFP
AYMENTSGoods
Net exports of Irish goods contributed €7.4 billion to the trade surplus for Q2 2018. In Figure 7, goods trade in Q2 2018 saw Irish exports grow at an annual rate of 17.8 per cent while imports increased by 3.9 per cent. Over the past four quarters, for every €1 worth of goods Ireland imported, the economy exported €2.24 worth of goods.
FIGURE 7 ANNUAL GROWTH RATE (%) IN TOTAL IRISH EXPORTS AND IMPORTS OF GOODS
Source: Central Statistics Office.
Note: Export and Import growth rates feature on the LHS whereas € million changes in trade are highlighted by the RHS.
-2 -1 0 1 2 3 4
-2 -1 0 1 2 3 4
-2 -1 0 1 2 3 4
-6,000 -3,000 3,000 6,000 9,000 12,000 15,000 18,000 21,000
-20 -10 0 10 20 30 40 50 60 70
While these traded goods are owned by Irish resident firms, some of these goods may never physically cross the Irish border. When examining the trade of goods, foreign-owned Irish resident firm activities such as processing and merchanting
must be taken into account.9 Cross-border trade captured through monthly
merchandise-related trade statistics effectively excludes the trade of ownership goods (e.g. contract manufacturing, merchanting). Isolating and analysing cross-border trade arguably enhances our understanding of domestic exporter
activity.10
In Q3 2018, seasonally-adjusted cross-border imports of goods increased by 31 per cent relative to the same period last year. Exports increased by 18.7 per cent, bolstered by trade in medicinal and pharmaceutical products. Figure 8 highlights how the surplus experienced in the previous quarter largely outweighs recent negative contributions to the trade balance.
FIGURE 8 ANNUAL GROWTH RATE (%) IN CROSS-BORDER IRISH EXPORTS AND IMPORTS
Source: Central Statistics Office.
Increased cross-border exports in 2018 stem largely from chemical products, which grew year-on-year by 37 per cent in Q3 2018. Of these chemical products, medicinal and pharmaceutical exports also increased by 37 per cent. Chemical products accounted for two-thirds of total exports between January and
9 ‘Goods for processing’ is dominated by ‘Contract Manufacturing’, a process in which multinational companies
residing in Ireland issue contracts to foreign firms to produce goods. Although these goods never enter the Irish economy, due to ownership of these goods pertaining to Irish resident firms, sales are recorded as an Irish export. ‘Merchanting’ consists of the buying and selling of completed goods abroad which at no stage enter or leave Ireland.
10 For further details on ownership trade, see CSO’s ‘Explaining Goods Exports and Imports 2012-2016’.
-2,400 -1,600 -800 800 1,600 2,400 3,200 4,000 4,800
-15 -10 -5 0 5 10 15 20 25 30
September 2018. Exports of machinery and equipment, largely represented by electrical machinery and office machines, have been consistently declining since mid-2017.
Given the vulnerability of the domestic agricultural sector to Brexit, the fall in total food and live animal exports by 6.3 per cent relative to Q3 2017 is of note. Figure 10 splits food into four major sub-components, highlighting a broad-based decline in exports occurring across all food item types. While both the UK and EU contributed towards modest growth in Irish food exports, the remainder of the world’s demand for Irish food products declined by 16.9 per cent relative to the January-September period of 2017.
FIGURE 9 ANNUAL GROWTH RATE (%) IN CROSS-BORDER FOOD EXPORTS
Source: Central Statistics Office.
In Q3 2018, total cross-border imports of goods rose year-on-year by 30 per cent. This marks the highest rate of growth since Q1 2006. For the year to date, machinery and transport equipment products and chemicals products represented 40 and 24 per cent of total imports, respectively. Machinery imports fell by 3.3 per cent and chemicals by 0.3 per cent for the same period.
Table 1 displays changes in exports and imports between regions for the year up to September 2018. Relative to 2017, Ireland’s three-quarter cumulative trade deficit with the UK increased by 60 per cent to €2.7 billion. Bilateral trade in chemicals and related products experienced a 15 per cent decline compared to the same period last year. Imports from the UK rose by 4 per cent, largely driven -40
-30 -20 -10 0 10 20 30 40 50 60 70
Total Food Meat & Meat Prep Dairy and Eggs
by a 40 per cent increase in the import of gas products (natural and manufactured).
While trade in chemical products fell with the UK, trade with Europe and the US appears to have increased significantly. Excluding the UK, total exports and imports of goods with the EU yielded double-digit growth. Imports of medicinal products from Germany increased by 425 per cent, up from €0.9 billion in 2017 to €5 billion in 2018. Overall trade with the US saw the greatest improvement compared to the January-September period of 2017, causing the trade surplus with the US to increase by 40.5 per cent (+€5.2 billion). The 15 per cent rise in exports was driven almost entirely by medicinal products and organic chemicals, with the combined value of these two items representing 66 per cent of total Irish goods exports to the US, relative to 55 per cent in 2017.
TABLE 1 JANUARY-SEPTEMBER ANNUAL CHANGE (%) IN GOODS EXPORTS AND IMPORTS
Exports Imports
Total – UK -5 4
Food and live animals 1 7
Chemicals and related products -15 -15
Machinery and transport equipment -12 7
Miscellaneous manufactured articles 3 3
Total – Rest of EU 16 26
Food and live animals 3 6
Chemicals and related products 29 104
Machinery and transport equipment -17 5
Miscellaneous manufactured articles 6 -1
Total – US 15 -12
Food and live animals -39 19
Chemicals and related products 37 -45
Machinery and transport equipment -42 8
Miscellaneous manufactured articles 3 0
Source: Central Statistics Office.
recent quarterly exports by destination and imports by origin. Demand for chemical exports to Belgium and the US have grown rapidly in 2018, now representing 60 per cent of medicinal and organic chemical export demand. Growth in German imports have significantly outpaced the US for three consecutive quarters in 2018, contributing to the 425 per cent growth rate previously noted.
FIGURE 10 TOTAL MEDICINAL AND ORGANIC CHEMICAL TRADE BY TOP FIVE COUNTRIES
A. Exports by Destination (€’000) B. Imports by Origin (€’000)
Source: Central Statistics Office, QEC calculations.
Services
Given that two-thirds of total Irish imports are based on the purchase of foreign services, even marginal declines in service growth can have a significantly positive effect on the trade surplus. Service exports grew year-on-year by 6.7 per cent in Q2 2018. Imports of services declined by 10.2 per cent in Q2 2018, relative to the same period last year.
2,000,000 4,000,000 6,000,000 8,000,000 10,000,000 12,000,000 14,000,000 16,000,000 201 5Q1 201 5Q2 201 5Q3 201 5Q4 201 6Q1 201 6Q2 201 6Q3 201 6Q 4 201 7Q1 201 7Q2 201 7Q3 201 7Q4 201 8Q1 201 8Q2 201 8Q3
USA BELG GER SWITZ UK
500,000 1,000,000 1,500,000 2,000,000 2,500,000 3,000,000 3,500,000 4,000,000 201 5Q1 201 5Q2 201 5Q3 201 5Q4 201 6Q1 201 6Q2 201 6Q3 201 6Q4 201 7Q1 201 7Q2 201 7Q3 201 7Q4 201 8Q1 201 8Q2 201 8Q3
FIGURE 11 ANNUAL GROWTH RATE (%) IN IRISH SERVICE EXPORTS AND IMPORTS
Source: Central Statistics Office.
Exports of computer services in Q2 2018 increased by 18.6 per cent relative to the same period last year. Significant and consecutive declines in business services since Q2 2017 have moderated overall growth rates in service exports. Royalties & licenses and business services formed 71 per cent of services imports in Q2 2018. Successive year-on-year reductions in both items have resulted in six consecutive quarters of import declines, as reflected in Figure 12. Imports of research and development services experienced the largest annual decrease, falling by 68 per cent in Q2 2018.
FIGURE 12 EXPORTS AND IMPORTS OF SERVICES (€ MILLION)
Source: Central Statistics Office.
-15,000 -12,000 -9,000 -6,000 -3,000 3,000 6,000 9,000 12,000 15,000 18,000 21,000
-50 -40 -30 -20 -10 0 10 20 30 40 50 60 70
2014Q2 2014Q4 2015Q2 2015Q4 2016Q2 2016Q4 2017Q2 2017Q4 2018Q2
Exports Imports Change in Trade Balance (€M, Y-o-Y)
10,000 20,000 30,000 40,000 50,000 60,000
In terms of the overall impact on headline GDP, movements in certain elements of imports are expected to be offset by related movements in investment. Table 2 highlights the relationship over the past four years between R&D service imports and investment into R&D. For 2018, forecasts of service imports reflect the
Commentary’s outlook on R&D investment, in that a one-for-one
investment-import ratio is assumed in terms of the relationship between the annual values for fixed capital and services imports. If movements in, say, fixed capital R&D are not fully offset in a particular year by developments in the services imports of R&D, then this can cause significant fluctuations in GDP.
TABLE 2 GROSS DOMESTIC PHYSICAL CAPITAL FORMATION AND SERVICE IMPORTS (€ MILLION)
2014 2015 2016 2017 Fixed Capital – R&D 9,944 30,553 58,137 26,810
Service Imports – R&D 8,704 28,158 58,052 26,832
Inv-Imp Ratio 0.87 0.92 1.00 1.00
Source: Central Statistics Office.
Trade Balance
FIGURE 13 CROSS-BORDER AND ADJUSTED NET EXPORTS OF GOODS AND SERVICES (€ MILLION)
Source: Central Statistics Office, QEC calculations.
Note: Adjustment to net trade accounts for ownership trade of goods. This includes, but is not limited to, forms of goods for processing such as contract manufacturing, and merchanting, i.e. purchase and resale of goods which do not enter the merchant’s economy.
Due to the volatile nature of ownership trade in goods as well as services, forecasts in the Commentary continue to be based on trends in trade patterns linked to underlying Irish economic activity. QEC forecasts of exports are now 8.7 per cent and 5.2 per cent growth in 2018 and 2019 respectively. Imports are expected to fall marginally by 1.7 per cent in 2018, increasing by 6.3 per cent in 2019. The year-end current account is expected to reach €35.3 billion (14.1 per cent of GNP) in 2018 before falling somewhat to €32.9 billion (12.5 per cent of GNP) in 2019.
-6,000 6,000 12,000 18,000 24,000 30,000
2008Q2 2010Q2 2012Q2 2014Q2 2016Q2 2018Q2
The Domestic Economy
O
UTPUTThe domestic section of the Commentary is organised as follows; we initially review the outlook for output growth before discussing developments in the Irish monetary and financial sectors. Prices and earnings in the economy are then discussed, followed by a review of demand-side factors such as consumption and housing market issues. On the supply side, we then examine developments in investment and the labour market before concluding with an analysis of the public finances.
Given the ongoing uncertainty concerning the outcome of the Brexit process, in the box below we illustrate the manner in which the different potential Brexit outcomes may impact the short-term forecast for the Irish economy.
BOX 1 ASSESSING THE IMPACTS OF DIFFERENT BREXIT TYPE SCENARIOS ON THE SHORT-TERM FORECAST OF THE IRISH ECONOMY
One particular challenge in assessing the domestic implications of Brexit is to examine the magnitude of the impact on short-term forecasts of the Irish economy. An increasing literature has sought to address the implications of Brexit on the Irish economy from a number of perspectives. Bergin et al. (2017) assess the implications from a macroeconomic perspective using COSMO – the large structural model of the Irish economy. The model links to an international network of models ‘NiGEM’ at the National Institute for Economic and Social Research (NIESR) in the United Kingdom and as such focusses on the impact of Brexit through trade channels. Using a similar framework, Conefrey and Walsh (2018) assess the implications for Irish growth rates of the UK Government Brexit White Paper. Other work by Lawless (2018a; 2018b) and Lawless and Morgenroth (2018) assesses the implications of Brexit on the domestic economy at a more sectoral level. In particular, this work focusses on the impact through trade on intermediate goods and services.
and Warren, 2016), while the UK contribution to the EU budget is taken from HM Treasury and the EU.
When these simulations are performed on the Irish economy, the potential long-term impact of Brexit on Ireland is severe. While the three scenarios considered include a whole set of international variables that are linked to COSMO, the strongest effect is a reduction in the trade-weighted demand or Irish exports compared to what it otherwise would have been. Table A summarises the impacts on the domestic economy in 2027 of the different scenarios. In each of the scenarios, the same mechanisms are at play but the impacts are weakest for the ‘EEA’ scenario and strongest in the ‘WTO’ scenario. In COSMO, this shock is initially transmitted to the Irish economy through the traded sector. The shock to foreign demand would reduce the volume of output in the traded sector and exports over the medium- to long-run below their baseline values. The fall in traded sector output leads to labour demand being below base, which has knock-on effects for employment and the unemployment rate.
TABLE A THE IMPACTS OF BREXIT ON THE IRISH ECONOMY OVER THE MEDIUM TERM (2027) Scenario % Deviation from Baseline
EEA -2.3
EFTA -2.7
WTO -3.8
Given the assessment of the longer-term impact, the question is how to relate this to shorter-term forecasts of the Irish economy? This is achieved by taking the changes from the baseline from the macroeconometric model and applying them to the short-term forecasts in the Commentary. The short-term forecast for the Irish economy in the absence of Brexit indicates GDP growth in 2019 of 4.2 per cent. We now take the percentage change from the baseline and apply it to the baseline GDP forecast for 2019 in the Commentary. We then calculate the growth rate between the 2018 GDP level and the new adjusted 2019 GDP level in the case of the three scenarios. The results are presented in Table B. Note we only present the results for the EEA and the WTO scenarios, as the difference in Year 1 between the EEA and FTA scenarios are trivial.
TABLE B THE IMPACTS OF BREXIT ON THE SHORTER-TERM COMMENTARY FORECASTS Scenario Year GDP Level (€bn) % Growth Rate 2019/2018
Estimate 2018 318.8
Baseline 2019 331.5 4.2
EEA 2019 328.6 3.2
WTO 2019 327.1 2.8
1.0 percentage points has been knocked off the growth rate under the relatively benign EEA agreement with respect to a no Brexit baseline. Under the WTO, this reduction is almost 1.4 percentage points.
From a practical perspective it is worth noting that EEA membership is only possible for countries that are members of the EU or the EFTA. If the UK does leave the EU in March 2019, the EEA scenario implies that the UK will have to apply for EFTA membership. The application process could take up to 12 months. Therefore, the EEA option is unlikely to impact on either Irish or UK GDP in 2019.
It can be argued that the results presented in Table B are somewhat benign in nature as they assume a smooth adjustment over the long run, which is probably unrealistic. This is because Bergin et al. (2017) ultimately captures the long-run trade effects of Brexit. A variety of short-run effects such as heightened consumer and producer uncertainty, disruptions in financial markets and lack of access to international supply chains are not controlled for. However, these could be quite significant in magnitude resulting in a more substantial impact on the short-term outlook than suggested here.
References:
Bergin, A., A. Garcia-Rodriguez, E.L.W. Morgenroth and D. Smith (2017). ‘Modelling the Medium- to Long-Term Potential Macroeconomic Impact of Brexit on Ireland’, The
Economic and Social Review, Vol 48(3), pp 305-316.
Conefrey T. and G. Walsh (2018). ‘Macroeconomic implications of the UK Government Brexit White paper: A preliminary analysis’, Box in the Central Bank of Ireland Quarterly
Bulletin, Q4, pp 13-17.
Ebell, M. and J. Warren (2016). ‘The long-run economic impact of Leaving the EU’,
National Institute Economic Review, Vol. 236, pp. 113-143.
Lawless, M., 2018. Intermediate goods inputs and the UK content of Irish goods exports, Economic and Social Research Institute (ESRI).
Lawless, M., 2018. ‘Irish-UK Services Trade and Brexit’, Working Paper No. WP595, Economic and Social Research Institute (ESRI).
Lawless, M. and E. Morgenroth, 2018. ‘Brexit and Irish Consumers’, Quarterly Economic
Commentary: Special Article, Economic and Social Research Institute (ESRI).
This box was prepared by Kieran McQuinn.
M
ONETARY ANDF
INANCIALC
ONDITIONSInternational monetary environment
position were some of the reasons for the uncertainty in a European context. Figure 14 outlines the CBOE VIX Index, the market standard measure of volatility. A discernible increase in volatility since the summer is evident.
FIGURE 14 VIX VOLATILITY INDEX (%)
Source: St Louis Fed Database, from Chicago Board Options Exchange.
From a European perspective, monetary policy continues to provide a stabilising backstop to an increasingly uncertain environment. The Eonia rate (Figure 15) remains anchored at -0.4 per cent in line with the stated ECB policy of maintaining a negative overnight rate. Despite being committed to a removal of the extraordinary measures (asset purchases) from the end of 2018, the ECB continues to signal that policy rates will remain low into the middle of next year. 0
5 10 15 20 25 30 35 40 45
FIGURE 15 EURO OVERNIGHT INDEX AVERAGE, EONIA (%)
Source: European Central Bank, Statistical Data Warehouse.
Figure 16 presents the ten-year government bond yields for a selected group of economies. As of August 2018, Irish ten-year bond yields stood at 0.85 percentage points which was below the Eurozone average. Importantly, despite a peak in the first months of this year, the cost of borrowing has continued to trend downwards into the third quarter of 2018. This is in contrast to financing costs for other economies such as Italy where political tensions have led to uncertainty around debt sustainability. The decoupling of Ireland from other peripheral economies is a particular success and points towards increasing market confidence in Ireland’s prospects. Given the historically low Euro Area interest rates at present, the highly indebted position of the Irish economy suggests that as much low cost long-term financing as possible should be secured by the authorities.
-1 0 1 2 3 4 5 6 7
01-1999 01-2000 01-2001 01-2002 01-20
03
FIGURE 16 TEN-YEAR GOVERNMENT BOND YIELD (%)
Source: St. Louis Fed. database.
Household credit and mortgage market
In Q1 2018, for the first time since 2009, the stock of outstanding mortgage lending as new lending outstripped repayments. This has continued into Q2 as mortgage lending continued to rise. Figure 17 presents the growth rates of credit to households from Irish resident credit institutions. The data are split by loans for house purchase and other personal loans (auto finance, credit cards, student loans etc.). On an annualised basis, outstanding mortgage lending grew by 0.7 per cent to Q2 2018. Non-mortgage credit also continued to expand in Q2 2018 at an annualised rate of 2.1 per cent. However, this represents a decline in the growth rate when compared with similar rates in 2017.
-2 0 2 4 6 8 10 12 14 01 -20 04 08 -20 04 03 -20 05 10 -20 05 05 -20 06 12 -20 06 07 -20 07 02 -20 08 09 -20 08 04 -20 09 11 -20 09 06 -20 10 01 -20 11 08 -20 11 03 -20 12 10 -20 12 05 -20 13 12 -20 13 07 -20 14 02 -20 15 09 -20 15 04 -20 16 11 -20 16 06 -20 17 01 -20 18 08 -20 18
FIGURE 17 GROWTH RATES OF CREDIT TO HOUSEHOLDS (%)
Source: Central Bank of Ireland, Credit, Money and Banking Statistics.
Notes: Data are taken from Central Bank of Ireland data release A.18, Growth rates series codes 777 and 1,252.
An important measure of the sustainability of activity in the mortgage market is the payment arrears rate. As of Q2 2018, the share of principal dwelling home loans in arrears stood at 6.3 per cent, down marginally on the previous quarter and down from 7.1 per cent year-on-year. This constitutes a total of 9.7 per cent of the balance of outstanding PDH mortgages. The default rate on buy-to-let (BTL) loans has also reduced but remains at 14.7 per cent of accounts.
FIGURE 18 IRISH HOUSEHOLD MORTGAGE ACCOUNTS IN ARREARS BY TYPE OF LOAN (%)
Source: Central Bank of Ireland, Mortgage Arrears Statistics.
Notes: PDH refers to principal dwelling houses loans while BTL are buy-to-let loans. Loans are defined in arrears if they are greater than 90 days past due on their payments.
-20 -10 0 10 20 30 40 20 05Q1 20 05Q3 20 06Q1 20 06Q3 20 07Q1 20 07Q3 20 08Q1 20 08Q3 20 09Q1 20 09Q3 20 10Q1 20 10Q3 20 11 Q1 20 11Q3 20 12Q1 20 12Q3 20 13Q1 20 13Q3 20 14Q1 20 14Q3 20 15Q1 20 15Q3 20 16Q1 20 16Q3 20 17Q1 20 17Q3 20 18Q1
Lending for House Purchase Other Personal
In Q3 2018, the volume of new mortgage drawdowns increased by 14.4 per cent year-on-year and the value of mortgages increased by 17.5 per cent year-on-year. This represents a moderate deceleration in the rate of growth of the volume of loans. Annualised growth of close to 20 per cent was very high for any mortgage market, despite the fact that the number of new loans was rising from a low base. The slowdown noted between Q2 and Q3 2018 is to be welcomed if it signals a normalisation of the sector’s activity. In terms of the average loan size for mortgages, it was €226,250 in Q3 2018 which is marginally higher than the level in Q2.
FIGURE 19 YEAR-ON-YEAR GROWTH RATE OF NEW MORTGAGE DRAWDOWNS (%)
Source: Banking and Payments Federation Ireland.
One interesting feature of the mortgage market has been an increase in ‘switcher’ activity as banks have increasingly vied for increases in market share through refinancing activity. In a sense, as these refinancing loans do not represent new exposures in the market, and often provide borrowers with a lower cost of financing when they refinance, they do not carry the same financial stability risks as new loans. In fact these loans are exempt from compliance with the macroprudential framework if there is no increase in the loan balance. When these are removed from the new lending data, growth rates are lower and are decelerating at a significant rate. For example, in Q3 2018 the growth rate for loans for new house purchases excluding refinancing only stood at 8 per cent, with an 11 per cent annualised growth for the value of lending. This suggests that new mortgage lending for house purchase is softening at a quicker pace than suggested by the aggregate drawdown figures.
-80 -60 -40 -20 0 20 40 60 80 100 20 06Q1 20 06Q3 20 07Q1 20 07 Q3 20 08Q1 20 08Q3 20 09Q1 20 09Q3 20 10Q1 20 10Q3 20 11 Q1 20 11Q3 20 12Q1 20 12Q3 20 13Q1 20 13Q3 20 14Q1 20 14 Q3 20 15Q1 20 15Q3 20 16Q1 20 16Q3 20 17Q1 20 17Q3 20 18Q1 20 18Q3
FIGURE 20 COMPARISON OF ANNUALISED GROWTH RATES FOR ALL LOANS VERSUS HOUSE PURCHASE LOANS (%)
Source: Banking and Payments Federation Ireland.
Part of this softening is linked to a slowdown in recent house price growth, which has declined on an annualised basis over recent quarters. This is evident in the scatter plot below which focuses on the narrow window of 2017 and 2018. Looking at this trend, while house prices and new lending growth are positively correlated (depicted in the growth as the upward sloping trend line), the rates of both house price growth and average new lending volume growth have been steadily declining over time, with the lowest points on the charts representing the most recent data.
-20 -10 0 10 20 30 40 50
2016Q1 2016Q2 2016Q3 2016Q4 2017Q1 2017Q2 2017Q3 2017Q4 2018Q1 2018Q2 2018Q3
Change in Total Loans Change in Total Value
FIGURE 21 CORRELATION BETWEEN HOUSE PRICE GROWTH AND AVERAGE NEW LENDING VOLUME GROWTH (%)
Source: Banking and Payments Federation Ireland.
In late November 2018, the Central Bank of Ireland (CBI) released their annual
review of the macroprudential rules in the mortgage market.11 These rules are
aimed to boost the resilience of both banks and borrowers to adverse shocks as well as prevent house price-credit spirals from forming like we saw in Ireland between 2003 and 2007. The CBI reaffirmed the current regulations and made no changes to the present framework. At this particular juncture, and given the critical supply shortages in the housing market, it is certainly prudent not to loosen credit conditions and risk any credit-based stimulus to house prices. The importance of these measures cannot be overstated in terms of their ability to provide a safe and sustainable mortgage market over the medium term.
Trends in SME and corporate credit market
Turning to the provision of credit to non-financial corporations, in Q2 2018 the overall stock of credit continued to fall with deleveraging an ongoing phenomenon in the sector. While the overall stock fell by 5.8 per cent on an annualised basis, when property and financial intermediation sectors are excluded the declines were more modest, at -0.7 per cent and -0.4 per cent respectively. These figures highlight that, while considerable deleveraging has occurred following the financial crisis, significant levels of debt remain. This could point towards potential vulnerabilities if the ultra-low interest rate environment were to rapidly unwind.
11 Central Bank of Ireland (2018). Mortgage Measures - Review of Residential Mortgage Lending Requirements.
2017 Q1 2017 Q2
2017 Q3 2017 Q4 2018 Q1
2018 Q2
2018 Q3
0% 2% 4% 6% 8% 10% 12%
0% 5% 10% 15% 20% 25% 30%
Av
era
ge
H
o
u
se
Price
G
ro
w
th
FIGURE 22 GROWTH RATES OF CREDIT TO PRIVATE SECTOR ENTERPRISES (%)
Source: Central Bank of Ireland, Credit, Money and Banking Statistics.
Notes: Data are taken from Central Bank of Ireland data release A.14, Growth rates series codes 17, 17.1 and 17.2.
Often the aggregate figures conceal the difference in financing conditions between Irish SMEs and larger corporates operating in the Irish market. To understand the financing environment for SMEs, we plot the trend in new lending to SMEs on a quarterly rolling average basis. New lending has increased steadily since the middle of 2013 and continues to expand. Relative to the first three quarters of 2017, the level of credit to SMEs has increased for the first three quarters of 2018 by 11 per cent.
-20.0 -10.0 0.0 10.0 20.0 30.0 40.0
Total
Total ex Financial Intermediation
FIGURE 23 QUARTERLY NEW LENDING TO IRISH SMES BY SECTOR (FOUR-QUARTER ROLLING AVERAGE)
Source: Central Bank of Ireland, SME Credit Series, Table A.14.1.
Figure 24 presents the four-quarter rolling average of SME credit growth to the second quarter of 2018. This suggests that the increase in credit has been slowing rapidly as the economy has recovered and the SME sector has returned to more normal operating conditions.
FIGURE 24 TREND GROWTH RATE FOR SME CREDIT (FOUR-QUARTER ROLLING AVERAGE)
Source: Central Bank of Ireland, SME Credit Series, Table A.14.1.
0 200 400 600 800 1,000 1,200 1,400 1,600 20 … 20 … 20 … 20 … 20 … 20 … 20 … 20 … 20 … 20 … 20 … 20 … 20 … 20 … 20 … 20 … Other Business Services including ICT and Finance Hotels and Restaurants
Wholesale and Retail
Construction and Real Estate
Interest rates and the cost of finance
The cost of finance in Ireland for both corporate and household credit remains high by European standards. More recently, in line with the rest of Europe, some reductions in lending rates are occurring. The standard variable rate on new mortgage loans in Ireland stood at 3.13 per cent as of Q3 2018; this is down slightly year-on-year from 3.41 in Q3 2017. The market for fixed rates has become more competitive and the average rate on one- to three-year fixed rate products stood at 2.82 per cent in Q3 2018. However, comparing Irish new house purchase loans relative to other Eurozone economies, it can be seen that interest rates on mortgages in Ireland remain the highest of comparator countries (Figure 25).
FIGURE 25 INTEREST RATES ON NEW HOUSE PURCHASE LOANS TO HOUSEHOLDS (%)
Source: Central Bank of Ireland, SME Credit Series, Table A.14.1.
Notes: Countries included are: AT, BE, EE, ES, FI, FR, IE, IT, LT, NL, PT, SI. These countries are selected due to data availability. Data differ between this chart presented and the text, as the ECB comparison data include restructured mortgages whereas the new business standard variable rate (SVR) is only for new drawdowns.
A similar picture emerges in relation to corporate interest rates. Figure 26 presents the interest rates on new business loans for non-financial corporates in Ireland relative to the average for the Eurozone. Two series are presented: 1) covering all loans and 2) capturing loans of less than €250,000 in value, which is used as a proxy for loans for SMEs. In September 2018, the average rate on new loans for all Irish corporates was 2.37 per cent, down marginally on the previous quarter. The Eurozone average was 1.65 per cent, approximately 70 basis points lower than the Irish rate. For small Irish corporate loans, the interest rate in September 2018 was 5 per cent compared to the Eurozone average of 2.27 per cent, a full 270 basis points higher than the Eurozone figure. Ongoing policy 0
1 2 3 4 5 6 7 8
measures to reduce the cost of financing for Irish SMEs, and to improve competition in the banking and other financing sectors, should continue apace.
FIGURE 26 INTEREST RATES ON NEW CORPORATE LOANS – EUROPEAN COMPARISON (%)
Source: ECB MFI data. Small loans refer to loans less than €250,000.
Inflation outlook
While the early months of 2018 had seen a moderation in inflation, both the overall CPI and the HCPI have begun to rise into the second and third quarters of 2018. Figure 27 presents the inflation rate for these series and the CPI excluding energy and unprocessed foods. While increasing inflationary pressures are evident from the CPI and HCPI, core inflation which excludes energy and un-processed foods is much weaker and suggests a more muted inflation outlook for the domestic economy.
It is interesting to explore the variation across different groups of products and services. In the year to October 2018, increasing prices were evident in the following areas: housing, water, electricity, gas and other fuels (+5.5 per cent), alcoholic beverages and tobacco (+2.6 per cent), transport (+3.3 per cent), and restaurants and hotels (+2.1 per cent) and education (+1.7 per cent). Other goods in the economy continue to experience declines in price with furnishings, household equipment and routine household maintenance down 4.3 per cent, miscellaneous goods and services down 3.1 per cent, food and non-alcoholic beverages down 2.2 per cent and communications down 1.0 per cent.
0 1 2 3 4 5 6 7 8
FIGURE 27 ANNUAL GROWTH IN INFLATION (%)
Source: Central Statistics Office.
The difference in price trends between the goods and services sectors is quite apparent. The underlying trends in the CPI (Figure 28) up to October 2018 indicates service prices have been accelerating. It is notable that the persistent decline of goods prices evident from 2013 to Q2 2018 have moderated with goods prices only falling marginally at present.
FIGURE 28 DECOMPOSITION OF ANNUAL (%) CPI GROWTH INTO GOODS AND SERVICES GROWTH
Source: Central Statistics Office.
Given the exceptionally rapid growth in the Irish economy, and the robust improvement in the labour market, inevitably questions arise as to whether the -8 -6 -4 -2 0 2 4 6 20 08M0 6 20 08M1 2 20 09M0 6 20 09M1 2 20 10M0 6 20 10M1 2 20 11M0 6 20 11M1 2 20 12M0 6 20 12M1 2 20 13M0 6 20 13M1 2 20 14M0 6 20 14M1 2 20 15M0 6 20 15M1 2 20 16M0 6 20 16M1 2 20 17M0 6 20 17M1 2 20 18M0 6
CPI - All items CPI - ExcL Energy & Unprocessed Food HICP - All items
-2.5 -2 -1.5 -1 -0.5 0 0.5 1 1.5 2 2.5
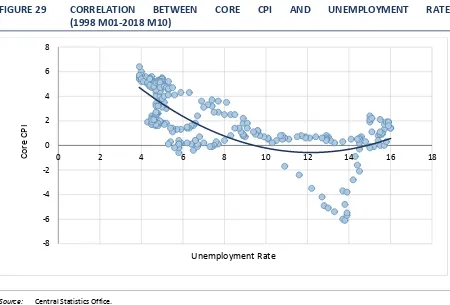
[image:43.595.70.526.82.352.2] [image:43.595.72.525.496.724.2]economy will begin to overheat, leading to upward pressure on prices and wages. In an accompanying note to this Commentary, McQuinn (2018) finds that while resources are becoming tighter in Ireland, the open nature of the economy should provide some spare capacity to accommodate further growth. The current lack of pressure on core inflation despite the rise in employment demonstrates the highly non-linear relationship between Irish prices and unemployment that would be expected by traditional relationships such as the NAIRU (Ball and
Mankiw, 2002).12 The exposure of the Irish economy to global prices through the
[image:44.595.73.523.323.628.2]exceptionally high share of traded activity (for both exports and imports) provides for a much more muted reaction of prices to unemployment. However, as Figure 29 displays, periods where the Irish unemployment rate has previously approached 4 per cent have been correlated with rising core inflation. As the economy continues to expand robustly, and if it reaches a point of near full employment, price rises will be much more likely.
FIGURE 29 CORRELATION BETWEEN CORE CPI AND UNEMPLOYMENT RATE (1998 M01-2018 M10)
Source: Central Statistics Office.
Note: The fitted line is a simple quadratic fit function between the two series.
In light of the Commentary’s forecast of strong domestic demand and the continued positive developments in the labour market performance, prices are expected to increase over the next two years. Consumer prices are expected to increase moderately by 0.6 per cent in 2018, followed by 1.1 per cent in 2019.
12 Ball, L. and G. Mankiw (2002). ‘The NAIRU in Theory and Practice’, Journal of Economic Perspectives, 16 (4), pp.
115-136. -8 -6 -4 -2 0 2 4 6 8
0 2 4 6 8 10 12 14 16 18
Unemployment Rate
Core
D
EMANDHousehold sector consumption
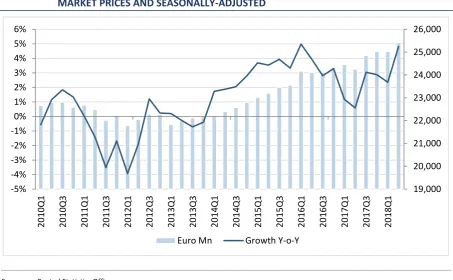
[image:45.595.71.525.263.543.2]Growth in personal consumption has continued apace in the Irish economy through the first half of 2018. The most up to date Quarterly National Accounts show that, on an annualised basis, personal consumption expenditure increased by 4.8 per cent in Q2 2018. The persistent fall in unemployment, increases in disposable incomes and an improvement in household balance sheets have all contributed to the growth in household spending.
FIGURE 30 QUARTERLY PERSONAL CONSUMPTION ON GOODS AND SERVICES – CONSTANT MARKET PRICES AND SEASONALLY-ADJUSTED
Source: Central Statistics Office.
Retail sales can be used as a leading indicator of consumption. These indicators provide a snapshot of what goods and services households are purchasing and what sectors are driving consumption growth in the country. Table 3 presents retail sales for selected items in terms of the annual growth rate in the volume of sales in Q3 2018. Overall retail business is up 4.6 per cent year-on-year with a positive growth rate in each of the retail business sectors. When the motor trade is excluded, sales are up by 4.3 per cent. Furniture and lighting sales continue to grow rapidly (up 7.7 per cent in Q3) due to the strong growth in the Irish housing market, while department store sales also performed well over this period (up 6.2 per cent in Q3).
19,000 20,000 21,000 22,000 23,000 24,000 25,000 26,000 -5% -4% -3% -2% -1% 0% 1% 2% 3% 4% 5% 6% 20 10Q1 20 10Q3 20 11Q1 20 11Q3 20 12Q1 20 12Q3 20 13Q1 20 13Q3 20 14 Q1 20 14Q3 20 15Q1 20 15Q3 20 16Q1 20 16Q3 20 17Q1 20 17Q3 20 18Q1