from natural peatland pipes
.
White Rose Research Online URL for this paper:
http://eprints.whiterose.ac.uk/77441/
Version: Published Version
Article:
Billett, MF, Dinsmore, KJ, Smart, RP et al. (6 more authors) (2012) Variable source and
age of different forms of carbon released from natural peatland pipes. Journal of
Geophysical Research: Biogeosciences, 117 (G2). G02003. 1 - 16. ISSN 2169-8953
https://doi.org/10.1029/2011JG001807
[email protected] https://eprints.whiterose.ac.uk/
Reuse
Unless indicated otherwise, fulltext items are protected by copyright with all rights reserved. The copyright exception in section 29 of the Copyright, Designs and Patents Act 1988 allows the making of a single copy solely for the purpose of non-commercial research or private study within the limits of fair dealing. The publisher or other rights-holder may allow further reproduction and re-use of this version - refer to the White Rose Research Online record for this item. Where records identify the publisher as the copyright holder, users can verify any specific terms of use on the publisher’s website.
Takedown
If you consider content in White Rose Research Online to be in breach of UK law, please notify us by
Variable source and age of different forms of carbon released
from natural peatland pipes
M. F. Billett,
1K. J. Dinsmore,
1R. P. Smart,
2M. H. Garnett,
3J. Holden,
2P. Chapman,
2A. J. Baird,
2R. Grayson,
2and A. W. Stott
4Received 8 July 2011; revised 4 January 2012; accepted 14 January 2012; published 7 April 2012.
[1]
We used the carbon isotope composition (
14C and
d
13C) to measure the source and
age of DOC, POC, dissolved CO
2and CH
4(
d
13C only) released from three natural
peat pipes and the downstream catchment outlet of a small peatland in northern England.
Sampling under different hydrological extremes (high flows associated with storm
events and low flows before or after storms) was used to explore variability in C sources
as flow paths change over short periods of time. The
d
13C composition of organic C
differed (
d
13C-DOC
28.6
‰
to
27.6
‰
;
d
13C-POC
28.1
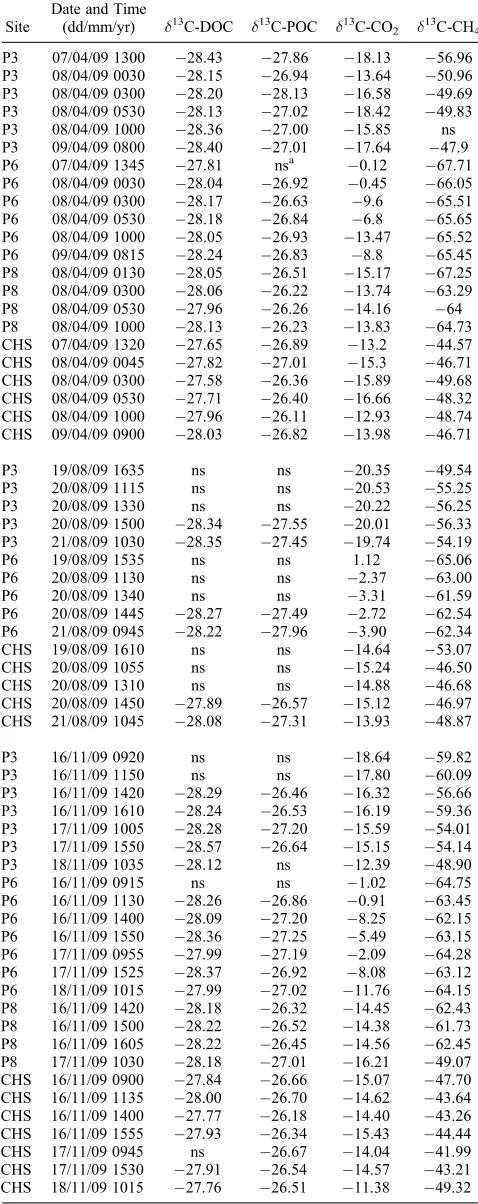
‰
to
26.1
‰
) from that of
the dissolved gases (
d
13C-CO
220.5
‰
to +1.1
‰
;
d
13C-CH
467.7
‰
to
42.0
‰
)
and showed that C leaving the catchment was a mixture of shallow/deep pipe and non-pipe
sources. The isotopic composition of the dissolved gases was more variable than DOC
and POC, with individual pipes either showing
13C enrichment or depletion during a storm
event. The
14C age of DOC was consistently modern at all sites; POC varied from
modern to 653 years BP and evasion CO
2from modern to 996 years BP. Differences in the
isotopic composition of evasion CO
2at pipe outlets do not explain the variability in
d
13C and
14C at the catchment outlet and suggest that overland flow is likely to be an
important source of CO
2. Our results also show that the sources of CO
2and CH
4are
significantly more variable and dynamic than DOC and POC and that natural pipes vent
old, deep peat CO
2and POC (but not DOC) to the atmosphere.
Citation: Billett, M. F., K. J. Dinsmore, R. P. Smart, M. H. Garnett, J. Holden, P. Chapman, A. J. Baird, R. Grayson, and A. W. Stott (2012), Variable source and age of different forms of carbon released from natural peatland pipes,J. Geophys. Res.,117, G02003, doi:10.1029/2011JG001807.
1.
Introduction
[2] Soil pipes are significant subsurface structural features
of peatlands and are known to occur in northern Europe, North America, Siberia, and the Southern Hemisphere [Norrström and Jacks, 1996; Price, 1992; Rapson et al., 2006; Thorp and Glanville, 2003]. They have been widely recorded in UK blanket peats [e.g.,Holden and Burt, 2002; Holden, 2005;Jones et al., 1997], where it has been shown that peat drainage, surface drying and Calluna vulgaris L. (Hull.) encroachment are associated with increased pipe densities. Human action and environmental change can therefore potentially increase the number and size of pipes. Despite their widespread occurrence, there has been almost no research on the role of soil pipes in the release of C from peatlands and their potential to export C stored deep within the peat profile. Hence, it is important to understand and
quantify the sources and amounts of different forms of C lost from peatlands via the pipe network and to investigate whether old, pre-bomb C is being released from deep peat sources.
[3] Globally, peatlands are estimated to store between 400
and 500 Gt C and play a significant role in greenhouse gas (GHG) exchange between the land surface and the atmo-sphere [Gorham, 1991;Roulet, 2000]. Peatland management and mismanagement (degradation) has had a major impact on their CO2sink and CH4source strength [e.g.,Gorham, 1991;Minkkinen et al., 2002]. Much of our understanding of C cycling and GHG fluxes associated with peatlands is based upon a knowledge of relationships between water table position, microbial community, temperature, plant type and management [Billett et al., 2006a; Cole et al., 2002; McNeil and Waddington, 2003;Strack et al., 2008;Worrall et al., 2006]. These factors affect components of the peatland C budget in different ways [e.g., Dinsmore et al., 2010; Koehler et al., 2011]. While pipes are known to be important in the delivery of water to peatland streams [e.g., Holden and Burt, 2002], there has been little work examining the role that water movement through peatlands plays in the retention and release of particulate and dissolved organic carbon (POC, DOC) and of dissolved gaseous carbon (CO2 1
Centre for Ecology and Hydrology Edinburgh, Penicuik, UK. 2School of Geography, University of Leeds, Leeds, UK. 3
NERC Radiocarbon Facility (Environment), East Kilbride, UK. 4NERC Life Sciences Mass Spectrometry Facility, Centre for Ecology and Hydrology, Lancaster Environment Centre, Lancaster, UK.
and CH4). Pipe-mediated C transport is likely to be tempo-rally variable since it is known that the relative contribution of pipeflow to streamflow changes with antecedent condi-tions [Holden and Burt, 2002]. The dynamic hydrology associated with peatland pipes is also manifest in frequent changes in outlet morphology, appearance of new pipes and closure of existing pipes [Holden et al., 2012].
[4] Natural soil pipes, which comprise inter-connecting
macropores several centimeters in diameter and up to sev-eral hundred meters in length, typically form complex, undulating, branching subsurface networks that are potential pathways for water, dissolved gas, sediment and solute transport [Holden et al., 2009]. Flow within individual pipes is either perennial (continuous) or ephemeral (responds only to storm events and therefore discontinuous). Pipe networks are also known to occur at a variety of depths within the soil profile [Holden and Burt, 2002] and have the potential to provide connectivity with both deep and shallow sources of water [Holden, 2004]. This has important implications in ombrotrophic peatlands where deep peat has traditionally been assumed to be a stable C store largely disconnected from the stream network.
[5] Radiocarbon (14C) studies in northern temperate,
boreal and subarctic peatlands show that the14C age of peats increases with depth down the soil profile [Schiff et al., 1997; Charman et al., 1999; Chasar et al., 2000;Palmer et al., 2001; Raymond and Bauer, 2001a, 2001b; Billett et al., 2007; Clymo and Bryant, 2008]. The upper layers are dominated by peat14C ages that are modern (post-bomb) with peat typically several thousand years old in deeper layers [Charman et al., 1999;Chasar et al., 2000;Palmer et al., 2001;Clymo and Bryant, 2008]. Soil solution DOC and gaseous forms of C also increase in age with depth. However, soil gases are generally younger than the peat at the same depth and, in most reported cases, soil solution DOC is younger still. Ages of gases reported in peatlands range from modern to 4330 years BP for CO2and modern to 4033 years for CH4, while ages of DOC range from modern to 6970 years [Charman et al., 1999;Chasar et al., 2000; Clymo and Bryant, 2008; Garnett et al., 2011]. Although there are a number of exceptions, peatland-derived stream water DOC generally produces a radiocarbon signa-ture indicating a modern source. Studies of 14C and stable carbon isotope (d13C) suggest that the majority of the DOC is derived from the decomposition of recent soil organic matter [Palmer et al., 2001; Raymond and Bauer, 2001a; Billett et al., 2007;Evans et al., 2007]. Stream water POC, however, is often much older with ages of up to 3710 years reported [Striegl et al., 2007;Billett et al., 2011].Billett et al. [2007] found that DOC released from the stream system of four UK peatland catchments was young (modern to 202 years BP), while CO2being released (evaded or degassed) from the stream water surface was older, (modern to 1449 years BP), suggesting (in association with thed13C values) that the sources of fluvial DOC and CO2 were in most cases different.
[6] Up to now there has been no study of the radiocarbon
age of natural pipe waters in peatlands. In terms of C this is important because it is not only present in a variety of chemical forms in peats (DOC, POC, DIC (dissolved inor-ganic carbon), CO2 and CH4), but the age of C stored is known to increase with depth within the peat profile. It could
be assumed that peatland pipes simply act as“benign” con-duits for surface water transfer through the peat mass, although that is unlikely. We know that CO2and CH4 con-centrations in both soil solution and the soil atmosphere of shallow and deep peats are orders of magnitude higher than concentrations in the above-ground atmosphere [Charman et al., 1999; Clymo and Bryant, 2008; Hope et al., 2004; Dinsmore et al., 2009]. Therefore, concentrations in pipe water are likely to be significantly higher than those in stream water. Pipeflow, supersaturated with CO2and CH4, may degas rapidly once it leaves the pipe system due to lower ambient partial pressures [Dinsmore et al., 2011]. In peatland systems this out-gassing in the drainage network potentially contributes a significant loss of terrestrially derived C to the atmosphere [Hope et al., 2004]. It has been shown that peatland headwater streams are important zones of degassing [Dawson et al., 2002], and concentrations of CO2 vary over different temporal scales [Dawson et al., 2001; Dinsmore and Billett, 2008]. Specific parts of peat-land streams act as hot spots for degassing [Billett and Moore, 2008]; additional degassing (CO2 and CH4) hot spots have been identified in peatland gullies [McNamara et al., 2008] and the riparian zone of DOC-rich streams [Dinsmore et al., 2009]. Recent work by Dinsmore et al. [2011] has demonstrated the importance of pipe outgassing and shown that significant loss of greenhouse gases (CO2, CH4 and N2O) occur from the pipe network to the atmosphere.
[7] Here we report isotopic measurements of DOC, POC,
CO2(d13C and14C) and CH4(d13C only) released from three natural pipes and the downstream catchment outlet of a blanket bog at Moor House, Cumbria, UK. We hypothesize that:
[8] 1. Natural peat pipe waters contain C sourced from
different depths/ages within the profile.
[9] 2. Dissolved, particulate and gaseous forms of C
exported from peat pipes have different sources/ages. [10] 3. Natural pipes contain a greater proportion of“old”
C compared to the stream network.
[11] We tested these hypotheses by collecting samples of
pipe and stream water under a range of hydrological condi-tions associated with spring, summer and autumn high flow events. Since upland peatland systems in the UK are char-acterized by a rapid rainfall-runoff response [Holden and Burt, 2003a] associated with changes in flow pathways and greater pipe flow, our aim was to target sampling at different parts of the storm hydrograph to see the greatest potential differences in carbon age/source.
2.
Methods
2.1. Study Site
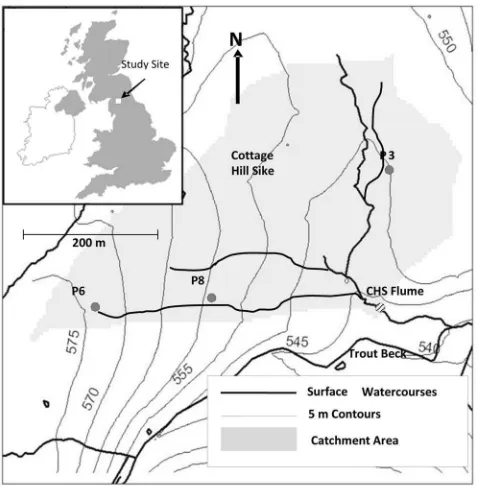
[12] Cottage Hill Sike (5441′N, 223′W), located within
temperature of 5.3C (1931–2006) and rainfall of 2012 mm yr 1 (1951–1980, 1991–2006) [Holden and Rose, 2011]. The catchment contains an ECN (Environmental Change Network) target monitoring site and is one of the CEH (Centre for Ecology and Hydrology) Carbon catchments. As part of the ECN, parameters such as vegetation composition, water table position and soil-water chemistry have been monitored under strict protocols since 1992 [Sykes and Lane, 1996]. Vegetation cover in the catchment is predom-inantlyCalluna vulgarisandEriophorum vaginatumL. with other species includingEmpertrum nigrumL. andSphagnum capillifolium(Ehrh.) Hedw.
[13] Stream discharge is characterized by a rapid
hydro-logical response to all rainfall or snowmelt events [Clark et al., 2005]. Discharge at the outlet of the catchment is monitored continuously through a rated flume (CHS flume). Trout Beck (the mainstream in the area into which CHS drains) displays mean lag times of 2.8 h between peak rainfall and peak discharge [Evans et al., 1999] and annual runoff coefficients of 70%–80%. Overland flow and shallow throughflow generally dominate runoff response at the site, with little apparent deeper flow through the peat matrix [Holden and Burt, 2003a].
[14] Stream water chemistry at Cottage Hill Sike is acidic
and organic-rich with a mean (1993–2007) pH of 4.3, mean DOC concentration of 18.88.7 (SD) mg L 1and mean Ca concentration of 1.1 mg L 1 [Tipping et al., 2010]. Soil water DOC concentrations sampled within the catchment by the Environmental Change Network (ECN) at 10 and 50 cm depth were 21.1 4.4 and 16.92.2 mg L 1[Adamson et al., 2001], respectively, with summer maxima of 25– 50 mg L 1[Clark et al., 2005]. Mean annual DOC flux from the catchment (1992–2007) is high (23.4 g C m 2 yr 1), with significant year-on-year variation [Billett et al., 2010]. Previous isotopic studies carried out at the site showed that
DOC at the catchment outlet was modern (i.e., carbon fixed post-1955 AD), while CO2 released (evaded) from the stream water surface was older (modern to 53035 years BP), suggesting that the sources of fluvial DOC and CO2 were different [Billett et al., 2007]. In addition,Tipping et al. [2010] showed that stream water DOM (dissolved organic matter) was young (5 years old) and predominantly associ-ated with surface peat, whereas groundwater DOM was 8,500 years old and likely derived from a source within the underlying glacial clay.
2.2. Sampling and Analysis
[15] We aimed to collect samples for isotopic analysis of
DOC, POC, CO2 and CH4 over a range of hydrological conditions by sampling pre-storm (base flow), rising limb, high flow and the receding limb of storms at different times of year. We succeeded in sampling pipe water during major high flow events in April and November and a minor rainfall event in August 2009. Samples collected in all three storms were sent for stable isotope (d13C) analysis at the NERC Life Sciences Mass Spectrometry Facility (LSMSF-Lancaster, UK); those collected in August and November were also sent to the NERC Radiocarbon Facility (RCF-East Kilbride, UK) for14C analysis. A mean of 84 pipe outlets have been mapped in CHS [Holden et al., 2012]. Of these, several have been more intensively studied for their hydrology and hydrochemistry [Dinsmore et al., 2011;Holden et al., 2012;Smart et al., 2012; J. Holden et al., Natural pipes in blanket peatlands: Major point sources for the release of carbon to the aquatic system, submitted to Global Change Biology, 2012]. Of these pipes (24 ephemeral; 60 perennial) we selected three to represent different pipe types and pipe outlet depths below the peat surface (depths ranged from 15 cm to 200 cm below the surface). These were P3 (peren-nially flowing, pipe outlet 25 cm from the peat surface), P6 (perennially flowing, pipe outlet 100 cm from the peat sur-face) and P8 (ephemerally flowing, pipe outlet 160 cm from the peat surface). The naming of the three pipes is consistent with that used in other papers from the site; for more infor-mation on pipe distribution and morphology, see Holden et al.[2012] andSmart et al.[2012]. Our sampling strategy was therefore based on three continuously monitored pipes plus the catchment outlet (CHS flume). An additional set of water samples from the same sites was collected for the determination of DOC, POC, CO2and CH4concentration and in situ measurements of pH, conductivity and tempera-ture at the time of sampling.
[16] Between field sampling, sample preparation in the
[image:4.612.62.301.60.303.2]laboratory, and analysis, all water samples were stored at 4C and in the dark following standard protocols (to mini-mize biological activity). For the determination of DOC and POC, samples were collected from free flowing water at the pipe outlet in acid-washed, 500 mL polypropylene sample bottles pre-rinsed with sample water. A Thermalox Total Carbon (TC) analyzer was used to measure DOC (precision 0.1 mg C L 1, detection limit 1.0 mg C L 1). Samples were acidified and sparged with O2to stabilize the sample and remove inorganic carbon. Acidified samples were run in duplicate (or triplicate if the coefficient of variation was >1%). Regular analysis of potassium hydrogen phthalate standards and a certified reference material (VKI QC WW4a) ensured the level of error was kept to a minimum.
Particulate organic carbon was determined indirectly by loss-on-ignition after filtration through 0.7 mm Whatman GF/F glass micro-fibre filters. The filtrate was dried at 105C (24 h), ignited at 375C (16 h); POC was calculated using a regression equation for non-calcareous soils [Ball, 1964;Dawson et al., 2002].
[17] For the determination ofd13C-DOC and d13C-POC,
samples were collected in two acid-washed 500 mL poly-propylene sample bottles per sample pre-rinsed three times with sample water. Prior to analysis for d13C of DOC and POC at LSMSF, 1 L samples were filtered through pre-ashed 0.70mm GF/F filter papers on an acid-washed suction filtration system into acid-washed 1 L conical flasks. Filter papers were stored in 20 mL acid-washed glass vials at 4C prior to 13C analysis of POC at LSMSF. The pH of each sample filtrate was then determined in 500 mL aliquots, prior to being adjusted to pH 4 by addition of 2 M HCl. Samples were then sparged with CO2-free N2 for 20 min before the pH was raised to pH 7 by 0.2 M NaOH. 500 mL aliquots of sample were then placed in 1 L rotary evaporator flasks for evaporation at 40C under vacuum. Samples were evaporated to near dryness (20–30 mL) before being trans-ferred to a 100 mL rotary evaporator flask and evaporated to dryness. The dried DOC samples were then transferred to labeled 20 mL acid washed glass vials and stored at 4C prior tod13C analysis at the LSMSF. Samples for the deter-mination of d13C-DOC and d13C-POC were combusted using a Eurovector elemental analyzer. Resultant CO2from combustion was analyzed for d13C using an Isoprime Ltd “Isoprime”Isotope Ratio Mass Spectrometer (IRMS). Max-imum standard deviation of duplicates ford13C was 0.16‰. [18] For14C-DOC, 1 L of stream or pipe water was
col-lected in acid-washed pre-rinsed glass bottles before storage and analysis at the NERC Radiocarbon Facility (NERC RCF). Because the concentration of POC is generally much lower than DOC, 10 L of sample was collected in an acid-washed 10 L sample aspirator for 14C-POC analysis. This sample was filtered (using ashed 0.7 mm GF/F filters) and the filter contents (i.e., the POC) retained and sent to the NERC RCF, where the POC was removed from the filter and dried. Samples of DOC were filtered (through ashed GF/F filters), acidified to pH 4 by addition of 2 M HCl, and sparged by bubbling with CO2-free N2 gas. The samples were returned to pH 7 by addition of KOH solution, rotary evaporated and freeze-dried. For all DOC and POC samples, the total carbon in the dried sample material was cryogenically recovered as CO2, following combustion inside an evacuated sealed quartz tube by heating with CuO, and stored in glass tubes prior to isotope analysis.
[19] Samples for the determination of dissolved CO2and CH4in stream or pipe water were collected using the head-space method [Hope et al., 2004;Billett and Moore, 2008]. This involves equilibrating 40 mL of water with 20 mL of ambient atmosphere for 1 min underwater in a sealed 60 mL syringe and transferring the equilibrated saturated headspace sample to a gas-tight nylon syringe. Dissolved gas con-centrations are calculated from the measured headspace and ambient concentrations using Henry’s law, which requires additional measurements of water temperature, atmospheric pressure and elevation [Hope et al., 1995]. On return to the laboratory at CEH Edinburgh headspace samples were ana-lyzed on an HP5890 Series II gas chromatograph equipped
with a FID and attached methanizer (detection limits: CO2 199 ppmv, CH41.26 ppmv). For the determination ofd13 C-CO2 an additional headspace sample was collected in the same way described above, the only difference being that the headspace sample was transferred to an evacuated 20 mL exetainer using a hypodermic needle. To collect sufficient CH4for the determination ofd13C we used three100 mL syringes, and in each syringe 60 mL of stream water was equilibrated with 40 mL of ambient air. The headspace from all three syringes was transferred to a dry 100 mL syringe in the field and the composite headspace injected into a sealed 100 mL evacuated glass Wheaton bottle through a self-sealing septum. Samples for the determination ofd13
C-CO2 were directly introduced into the injection port of an Iso-prime Ltd (Cheadle, UK) TraceGas pre-concentrator inter-faced via an open split to an Isoprime Ltd isotope ratio mass spectrometer. All samples were analyzed to the United Kingdom Accreditation Scheme (UKAS) ISO17025 stan-dard. Methane analysis was performed using the same instrument with the gas selectors set to CH4and a furnace tube in line. Methane was converted to CO2 in a Pt/Ni furnace at 1050C from which d13
C measurements were then determined.
[20] Samples of dissolved CO2for C isotope analysis were collected in situ from selected peat depths (25, 30, 50 and 100 cm) in one profile20 m meters from the outlet to pipe P3 using a passive sampling method [Garnett and Hardie, 2009]. Stainless steel probes were inserted vertically (with minimal disturbance) to the required sampling depth. The end of the probes contained a hydrophobic gas permeable, water-impermeable filter (Accurel PP V8/2 HF, Membrana GmbH, Germany). The upper end of the probe remained above ground, and to this a quartz glass cartridge containing a zeolite molecular sieve [Hardie et al., 2005] was attached. The molecular sieve passively adsorbs CO2 and therefore sampled the atmosphere inside the probe, thus collecting CO2 in the vicinity of the gas entry point to the probe. Probes were inserted on 20th August and removed on 11th November 2009. The molecular sieves were then returned to the NERC RCF, the CO2cryogenically recovered following heating (500C) and stored in glass tubes until analysis.
[21] Further supporting age data were provided by
radio-carbon analysis of two basal peats (2.4–2.6 m) from a site at the western edge of the CHS catchment (100 m west of pipe P6; see Figure 1) collected on 26 July 2000. Samples were acid-washed (2 M HCl) to remove potentially mobile car-bon, dried, and converted to CO2in a combustion“bomb” in an atmosphere of high pressure oxygen. The CO2 was cryogenically recovered then converted to benzene, and the 14
C measured by liquid scintillation counting (on a Quan-tulus 1220, LKB Wallac, Finland).
[22] Carbon dioxide lost by evasion from the water surface
for 14C analysis by accelerator mass spectrometry (AMS). Sample times in this study varied from 30 min at CHS flume to 19 h at pipe P3. After trapping the evaded CO2, the molecular sieve cartridges were returned to the NERC RCF and the CO2recovered using the same procedures as used for the14C analysis of dissolved peat CO2[seeHardie et al., 2005; this study].
[23] For all samples analyzed for radiocarbon, an aliquot
of the recovered CO2was first used to determined13C (rel-ative to the Vienna-PDB standard) by isotope IRMS (VG Optima, Micromass, UK). The remaining CO2 was con-verted to graphite by Fe-Zn reduction [Slota et al., 1987] and passed to the Scottish Universities Environmental Research Centre (SUERC) for14C measurement by AMS. Following conventions, 14C results were normalized to d13C 25‰ and expressed as % modern and conventional radiocarbon
ages (years BP; where 0 BP = 1950 AD) with 1 s ana-lytical confidence. A correction was made to the evasion isotope values to account for the fact that the CO2 had degassed into a closed chamber. As described byBillett and Garnett[2010], this adjustment is used to calculate the iso-topic composition of the evasion CO2-C if it had been degassing directly into the free atmosphere rather than the chamber. However, for the current samples, the correction made only a small difference to most results. During passive sampling, isotopic fractionation occurs which has been quantified to be4‰[Garnett and Hardie, 2009]. Thed13C values for dissolved CO2in peat were therefore adjusted to account for this effect (14C results did not require this cor-rection as following convention they were normalized to a d13C of 25‰).
[24] Hourly rainfall was recorded in a tipping bucket
rain gauge at the ECN weather station approximately one kilometre from the study site. Discharge at the outlets of the three pipes was measured using continuously recording Trafag DL/N type pressure transducers with data loggers, installed in stilling wells located within rated V notch weir boxes which collected discharge from pipe outlets; discharge at the CHS flume was recorded continuously using a logging pressure transducer (In Situ Level Troll 300) situated directly upstream of the flume.
[25] Possible differences in chemical species between
sites and between the isotopic signature of different forms of C were evaluated using one-way ANOVA followed by Tukey’s multiple comparison test to examine which indi-vidual mean values differ significantly from others.
3.
Results
3.1. Storm Hydrology
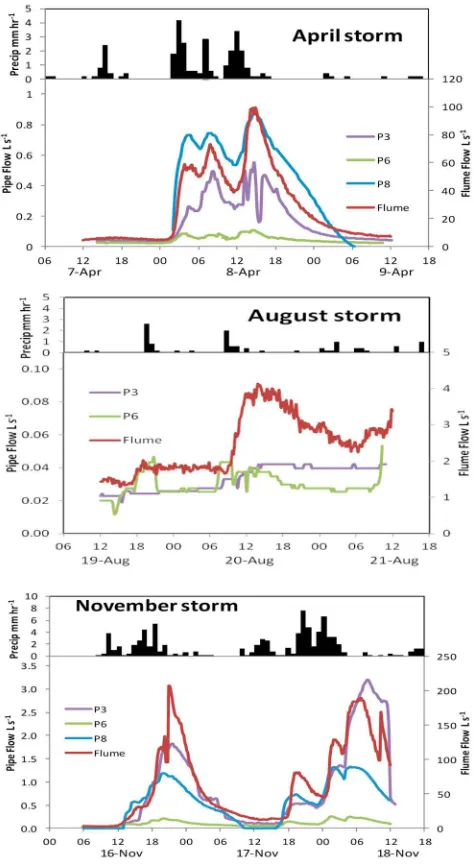
[26] The most intense of the three storms occurred in
November when 78.4 mm of rain fell in 44 h. The precipi-tation profile had two major peaks which resulted in a rapid runoff response as flow at CHS flume increased from 4 to 207 L s 1(Figure 2). The intensity of the November storm was demonstrated by the exceedence value relative to the complete 2009 flow record at CHS flume; peak flow in the November event was only exceeded 0.3% of the time. Similarly the April storm was double-peaked but of lower intensity (24.8 mm of precipitation in 33 h) resulting in a rise in discharge from 4 to 99 L s 1at CHS flume. The excee-dence value of this storm was 2.3%. The August event was of a smaller magnitude (10.8 mm of precipitation in 44 h) and, due to a combination of drier antecedent conditions and low rainfall intensity, we only measured a rise in discharge from 1 to 4 L s 1at the catchment outlet. The exceedence value of the August event was 34.8%. In all three events the rainfall-runoff response lag time (the time between onset of rainfall and a rise in water level at CHS flume) was approximately 1 h.
[27] Of the two continuously flowing pipes, P6 was the
[image:6.612.63.300.62.494.2]less hydrologically responsive. Discharge increased from 0.02 to 0.25 L s 1during the November storm and from 0.02 to 0.11 L s 1during the April storm. In contrast, P3 recorded much higher flows with an increase from 0.03 to a maximum of 3.21 L s 1in November and from 0.04 to 0.55 L s 1in April. During the August event, discharge at the two con-tinuously flowing perennial pipes remained at 0.02–0.04
L s 1; there was no flow from the ephemeral pipe (P8). In the intense November storm P8 exhibited two distinct peri-ods of discharge which were closely related to precipitation intensity; a maximum flow of 1.32 L s 1 was recorded during the second storm peak. In the April storm P8 recor-ded the highest flows of all the pipes reaching 0.87 L s 1 soon after the second precipitation peak. The storm hydro-graphs of pipes P3 and P8 were similar in shape to that at CHS flume.
3.2. Spatial Differences in Chemical and Isotopic Concentrations Between Sites
[28] Although mean DOC concentrations at the two
con-tinuously flowing pipes (P3 and P6), the ephemeral pipe (P8) and the CHS flume were not statistically different (Table 1), the mean concentration at P8 was almost double those at the other three sites. Likewise POC concentrations were not significantly different at the four sample sites. Highest CO2concentrations were observed at P6 and lowest at P8; the differences between these two pipes were statis-tically significant. Mean CH4 concentration at P6 was between 45 and 108 times higher and significantly different from the other three sites. No significant differences existed between pH, conductivity and temperature at the four sites when data from all the storm events were pooled.
[29] The meand13C value of DOC released from P3 was
statistically more13C depleted than the DOC from other sites (Table 2). In contrast DOC at the flume was significantly more13C enriched; P6 and P8 had similard13C-DOC values. P3 and P6 had similar d13C-POC values and were signifi-cantly more13C depleted than POC from P8 and CHS flume. The most 13C enriched dissolved (and evaded) CO2 was associated with P6, whereas P3 was significantly depleted in 13C compared to the other sites. For CH4 the most 13C depleted mean values were at P6 and P8, while CH4 mea-sured at CHS flume was the most 13C enriched. P3 had a significantly differentd13C-CH4value from the other sites.
[30] A comparison between thed13C signature of different
forms of C at each of the four sites (Table 2, statistics not shown) demonstrated that the isotopic composition of both DOC and POC associated with each pipe and CHS flume was statistically similar. However, differences between the d13C composition of CO2, CH4and evasion CO2were sta-tistically significant showing that at each site the gaseous forms of C had a uniqued13C signature.
[31] Table 3 shows the14C enrichment of DOC, POC and
evasion CO2 for the August and November storm events. The overall (August + November) mean14C enrichment of DOC samples collected was significantly higher at P3 (114.22% modern) and P6 (114.30% modern) compared to CHS flume (111.21% modern). For POC pipe P6 was sig-nificantly more14C depleted (99.61% modern) compared to P3 (107.09% modern) and CHS flume (105.58% modern). Likewise, P6 was associated with the most 14C depleted evasion CO2(mean 94.57% modern), although this was not significantly different from the value at CHS flume (97.74% modern). Evasion CO2 at P3, however, was significantly more14C-enriched than the other two sites.
[32] We compared the 14C values of DOC, POC and
evasion CO2at individual sites and found that both at P3 and P6 DOC was significantly 14C enriched compared to both evasion CO2and POC. At CHS flume, however, the mean 14C enrichment of all three forms of C was signifi-cantly different. We collected insufficient carbon for 14C analysis of the ephemeral pipe (P8) to make the same type of comparison.
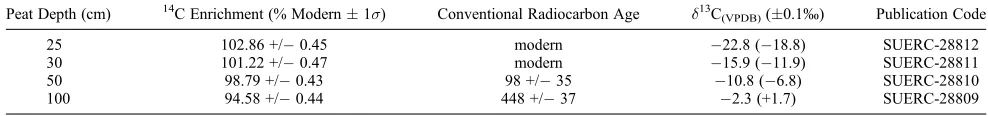
[33] Isotope analysis of dissolved CO2passively sampled down the peat profile at P3 showed that between 25 and 100 cm CO2became progressively more13C enriched and 14
[image:7.612.61.555.84.169.2]C depleted (Table 4). The oldest CO2 was collected at 100 cm and corresponded to a radiocarbon age of 448 37 years BP. The 2 basal peat samples from the western edge of the catchment sampled in 2000 were dated at
Table 1. Basic Mean Chemical Characteristics (Minimum and Maximum Values in Parentheses) of P3, P6, P8 and the Outlet Flume During the Three Storm Events
P3 (n= 18) P6 (n= 18) P8a(n= 8) Flume (n= 18)
DOC (mg L 1) 33.29[a]b(5.60–124.93) 35.12[a] (7.21–85.05) 60.55[a] (6.38–142.84) 32.82[a] (12.20–51.30) POC (mg L 1) 2.89[a] (0.09–23.60) 2.60[a] (0.72–9.81) 1.20[a] (0.18–2.72) 0.86[a] (0.36–1.73) CO2-C (mg L 1) 1.42[ab] (0.46–2.91) 2.41[a] (0.58–10.99) 0.78[b] (0.70–0.95) 1.48[ab] (0.44–3.45) CH4-C (mg L 1) 3.71[b] (0.37–11.75) 215.80[a] (13.36–1132.14) 4.79[b] (0.37–6.81) 2.00[b] (0.02–4.53) pH 4.16[a] (3.99–4.32) 4.22[a] (4.01–4.42) 4.17[a] (4.09–4.24) 4.22[a] (4.12–4.36) Cond (mS cm 1) 37[a] (25–45) 37[a] (25–46) 41[a] (31–50) 37[a] (26–45) Temp (C) 7.15[a] (3.52–13.91) 6.55[a] (3.53–12.06) 4.67[a] (3.71–5.52) 7.12[a] (3.49–13.27)
aPipe P8 flowed only during the April and November events. b
Mean values that do not share the same bracketed letter(s) are significantly different (Tukey’s multicomparison test).
Table 2. Meand13
C Values (Minimum and Maximum Values in Parentheses) of Various Carbon Species Collected During the Three Storm Events
P3 (n= 12–18) P6 (n= 13–18) P8 (n= 8) Flume (n= 14–18)
d13C-DOC 28.3[c]a( 28.6 to 28.1) 28.2[b] ( 28.4 to 27.8) 28.1[b] ( 28.2 to 28.0) 27.9[a] ( 28.1 to 27.6) d13C-POC 27.2[b] ( 28.1 to 26.5) 27.1[b] ( 28.0 to 26.6) 26.4[a] ( 27.0 to 26.2) 26.6[a] ( 27.3 to 26.1) d13C-CO
2 17.4[c] ( 20.5 to 12.4) 4. 9[a] ( 13.5 to 1.1) 14.6[bc] ( 16.2 to 13.7) 14.5[b] ( 16.7 to 11.4) d13C-CH4 54.1[b] ( 60.1 to 47.9) 64.2[c] ( 67.7 to 61.6) 61.9[c] ( 67.3 to 49.1) 46.7[a] ( 53.1 to 42.0) d13C-evasion CO
[image:7.612.58.553.642.707.2]6396 46 (Publication Code SRR-6613) and 6511 50 years BP (Publication Code SRR-6614).
3.3. Temporal Changes in Chemical and Isotopic Concentrations During Storm Events
[34] During the April storm, DOC concentrations from the
three pipes were variable and high and showed no consistent temporal trend over the hydrograph period. Concentrations of DOC in the more intense November storm were much lower and showed a decline in all three pipes over the event period (Figure 3). d13C-DOC values were variable and inconsistent during both storms.
[35] During the April storm event POC concentrations
peaked at the same time on the rising limb of the storm hydrograph at CHS flume and all three pipes (Figure 4). Generally higher POC concentrations were recorded in the more intense November storm with P3 releasing very high POC concentrations during the low-flow period between the two discharge peaks. Like the d13C values of DOC, there were no consistent temporal trends ind13C-POC during the two storms.
[36] In the April and November storms the onset of rising
stream and pipe discharge was associated with a rapid drop in dissolved CO2concentration (Figure 5); thereafter, con-centrations recovered slightly (April) or remained consis-tently low (November). Our data also showed that over the course of both storm events the often distinct pre-storm differences between CO2concentrations at all four sampling sites became less clear as flows increased. P6 exhibited significant changes in d13C-CO2 during both storms, with pre-storm (base flow) values of 0.1‰and 0.9‰ chang-ing to 13.5‰ and 11.8‰ during the high discharge period indicating progressive 13C depletion. The d13C-CO2 values of P3, P8 and CHS flume were less variable over the course of both storms ( 11.4‰to 18.6‰) and in the November storm showed a trend of increasing 13C enrich-ment over time.
[37] In all three pipes, CH4concentrations dropped at the start of the storms and remained relatively low throughout the storm; these changes were clearer in the November event (Figure 6). While distinct differences existed between indi-vidual pipes and CHS flume, only P3 exhibited a consistent trend of increasing13C enrichment over time.
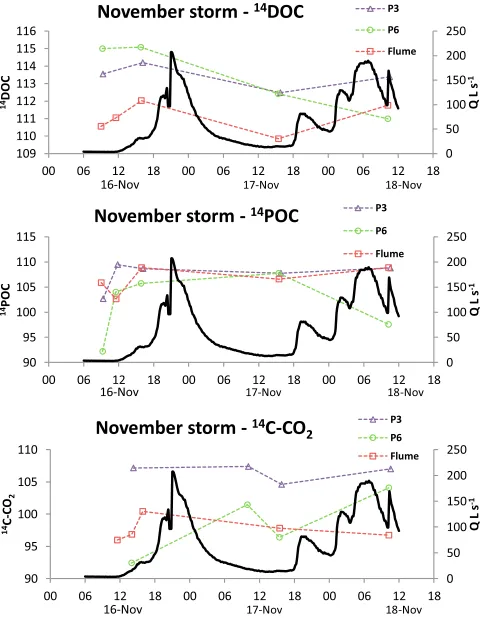
[38] The most complete set of radiocarbon data was
col-lected for the November storm (Figure 7) and showed that at CHS flume and P3, changes in14C-DOC and14C-POC were similar. During the pre-storm period POC produced from P6 was14C depleted; it became rapidly14C enriched at the start of the November storm and then more depleted at the end of the storm. Evasion14C-CO2values changed little at P3 over the course of the storm. However, pre-storm evasion 14 C-CO2values were depleted at both P6 and CHS flume. At the onset of the storm, values became more14C enriched before declining in the case of CHS flume and enriching further in the case of P6.
[39] We do not show temporal changes in isotopic
com-position during the August event because changes in dis-charge were minimal (Figure 2). Thed13C signature of DOC and POC at the three remaining sites (P3, P6 and CHS flume) varied only slightly (0.2–0.6‰) over the sampling period, although at P6 there was a larger change (2.1‰). Evasion and dissolved CO2were more variable, particularly at P6 where we recorded the most 13C enriched sample (+1.1‰dissolved CO2) at summer base flow before the start of the small storm. This changed to 3.9‰on the receding limb of the short event. Likewise, dissolved CH4 values were more variable than DOC or POC, with changes of up to 6.8‰during the course of the event.
[40] The radiocarbon age of DOC and POC samples
collected during the August event was generally modern, although at P6 we measured POC ages of 526 37 and 55937 years BP at base flow and peak flow, respectively. Evasion CO2ages were most
14
[image:8.612.61.552.83.188.2]C depleted at base flow with ages varying from 99638 to 83138 years BP at P6 and
Table 3. Mean14C Enrichment (% Modern) Values (Minimum and Maximum Values in Parentheses) of DOC, POC and Evasion CO 2 Collected From Three Pipes and the Catchment Outlet During the August and November Storm Events
P3 P6 P8 Flume
August
DOC 115.31 (115.00–115.89) 115.54 (113.97–116.71) ns 111.48 (111.08–112.01) POC 106.46 (103.31–110.24) 96.54 (93.27–102.67) ns 103.94 (103.24–104.68) CO2-C 109.13 (107.41–110.19) 89.21 (88.34–90.17) ns 98.04 (96.01–99.53)
November
DOC 113.41 (112.48–114.20) 113.37 (110.99–115.08) 114.6 (113.37–115.83) 111.1 (109.9–112.0) POC 107.47 (102.68–109.47) 101.45(92.21–107.75) 111.21 (110.89–111.52) 106.57 (102.64–108.87) CO2-C 106.54 (104.61–107.38) 98.59 (92.43–104.09) 106.45
a
97.77 (95.98–100.42)
a
One sample.
Table 4. Isotopic Signature of CO2Collected at a Range of Peat Depths (25–100 cm) at Site P3 by Passive Samplinga
Peat Depth (cm) 14C Enrichment (% Modern1s) Conventional Radiocarbon Age d13C(VPDB)(0.1‰) Publication Code
25 102.86 +/ 0.45 modern 22.8 ( 18.8) SUERC-28812
30 101.22 +/ 0.47 modern 15.9 ( 11.9) SUERC-28811
50 98.79 +/ 0.43 98 +/ 35 10.8 ( 6.8) SUERC-28810
100 94.58 +/ 0.44 448 +/ 37 2.3 (+1.7) SUERC-28809
a NB:d13
[image:8.612.58.552.654.712.2]327 37 to 3837 years BP at CHS flume; radiocarbon ages at P3 were all modern.
4.
Discussion
[41] The use of carbon isotopic geochemistry in headwater
regions is a powerful tool to investigate catchment processes that control the source and age of C in the freshwater
[image:9.612.95.516.60.297.2]environment. In contrast, isotopic measurements in major river systems are often difficult to interpret because of their size and complexity [e.g., Raymond and Bauer, 2001a]. Here, d13C and 14C measurements of C released at the catchment outlet (CHS flume) and from three pipes can be individually related to specific parts (in the case of pipes, depth-variable, micro-catchments) of the peatland itself.
Figure 3. Temporal changes in DOC concentration andd13C-DOC for the three pipes (P3, P6, P8) and the CHS flume during the April and November storm events. Flow (solid line) is presented for CHS flume only.
[image:9.612.97.519.448.697.2]We sampled under different hydrological extremes (high and low flows associated with storm events) to explore variability in C sources as flow paths change over short time periods. P3 and P8 were hydrologically more responsive than P6 and, collectively, all three pipes were more responsive to rainfall events than the catchment outlet. While pipe water DOC and POC concentrations
[image:10.612.95.518.57.308.2]were similar across all the sample sites, concentrations were higher than those recorded in the soil solution at the site [Adamson et al., 2001], demonstrating the importance of peatland pipes as conduits for carbon flow. Dissolved gas concentrations were more variable across the sites with P6 in particular enriched in both CO2 and CH4 [see also Dinsmore et al., 2011].
Figure 5. Temporal changes in CO2-C concentration andd13C-CO2for the three pipes (P3, P6, P8) and the CHS flume during the April and November storm events. Flow (solid line) is presented for CHS flume only.
[image:10.612.92.519.450.696.2]4.1. Source and Age of DOC and POC
[42] A small but significant difference ind13C-DOC and
d13C-POC between the pipes and CHS flume showed that water leaving the catchment was more 13C enriched com-pared to water derived from the two continuously flowing pipes (P3 and P6). Biological processing of organic C in aquatic systems would lead to13C enrichment of both DOC and POC as it is transported from the pipe system through the drainage network to the catchment outlet. However, water transfer times (which are typically likely to be <2 h) from pipe outlet to CHS flume are unlikely to be sufficient for in-stream processing to account for this difference in d13C-DOC andd13C-POC between perennial pipe water and stream water.
[43] We found that POC was consistently enriched in13C
by 1.0‰–1.5‰ compared to DOC. Likewise, Guo and
MacDonald [2006] found that the d13C value of size frac-tionated organic matter in water from the Yukon River changed from 27.9‰ (low molecular weight DOM) to 26.2‰(high molecular weight particulate organic matter, >0.45 mm). Our DOC and POC data are consistent with a common source (derivation from C3 plants) followed by further transformation and decomposition of soil organic matter.Guo and MacDonald[2006] also recognized that the different d13C values suggested an age difference between the various size fractions, as CO2sequestered by vegetation derived from the modern atmosphere (which includes a
substantial component of CO2derived from combustion of fossil fuels) would have a d13C signature1.5‰depleted relative to CO2sequestered by plants in the preindustrial era. This is consistent with our14C data for DOC and POC with P6 producing the oldest organic carbon (up to 559 years BP). [44] The isotopic data therefore showed that, while the
sources (implied fromd13C values) of both DOC and POC produced in the CHS catchment were consistent across a range of flow conditions, the age (14C enrichment) of POC varied significantly (Table 3), both being more or less14C enriched compared to the contemporary atmosphere (14C concentration of atmosphere in 2009 estimated to be105% modern, based onLevin et al., 2008). Interestingly, all DOC samples were significantly more enriched in14C compared to the atmospheric CO2 in the year of sampling (2009), indicating that a substantial component of the carbon in DOC had been fixed from the atmosphere within the last 50 years. While acknowledging that we cannot completely exclude the possibility that C fixed pre-bomb contributed to DOC, if we make the simplifying assumption that DOC was derived only from carbon fixed after the AD 1963 bomb-14C peak, then we can estimate“mean”ages for the DOC, based on the recent declining trend in the atmospheric level of14C [e.g.,Levin et al., 2008]. Thus, mean14C concentrations for DOC from P3 and P6 (114% modern) suggested a mean age of18 years since carbon fixation, clearly older than a mean age of 13 years for DOC measured at CHS flume (111% modern).
4.2. Source and Age of CO2and CH4
[45] The d13C signature of dissolved CO2 and CH4 released from the two continuously flowing pipes was dis-tinctly different from the catchment outlet. P6 was charac-terized by highly 13C enriched CO2 and highly depleted CH4, whereas flow from P3 was13C depleted for both gases compared to stream water. A comparison betweend13C-CO2 (evasion) with d13C-CO2 (dissolved) showed a 4‰ enrichment in the dissolved phase (Figure 8), demonstrating that preferential loss of the lighter isotope of C occurred across the water-air interface during degassing [see also Zhang et al., 1995;Doctor et al., 2008].
[46] During storms we found that the clearest change in
d13C-CO2occurred in P6, with a significant shift toward13C depletion at higher flows. Isotopic depth profiling in peats generally shows that CO2becomes more13C enriched with increasing depth from ca. 20‰to ca. +10‰[Clymo and
Bryant, 2008, Figure 5]; similar 13C enrichment trends have also been measured by Aravena et al. [1993] and Charman et al.[1999]. Steinmann et al. [2008] found that d13C-DIC (a surrogate for CO2) changed from 21.7‰at 50 cm depth to +8.8‰at 6 m depth in a peat profile. This suggests that CO2 in pipe water from P6 changed from a deep to a shallow source during storms. However, this pat-tern was not observed at other sites; in the April storm there was no change in d13C-CO2 in P3, P8 and CHS flume, whereas in the November storm there was a gradual 13C enrichment of CO2during the event period at both P3 and CHS flume. Measurements of down profile changes ind13 C-CO2made at P3 suggested that CO2reaching the pipe outlet (d13C-CO2 20.5‰ to 12.4‰) was derived from up to
[image:11.612.61.301.59.368.2]25–30 cm depth. The most13C depleted (shallowest) CO2 was released from P3 during the summer (August) event.
During the most intense storm (November) we measured progressive 13C enrichment of CO2at P3 during the event (a change from –18.6‰ to 12.4‰), suggesting an increasing contribution of CO2from deeper within the peat profile. P3 therefore behaved differently from P6, the latter exhibiting progressive 13C depletion during the November event consistent with increasing dominance of near-surface CO2sources.Waldron et al.[2007], working in a catchment rich in organo-mineral soils and peats, described variations in stream water DIC as a combination of a 13C-depleted (d13C-DIC 22‰), low-flow end-member and a more
13
C-enriched (d13C-DIC 10‰to 6‰) high-flow end-member, produced primarily from CO2 derived from the respiration of C3 vegetation ( 28‰) and anaerobic fer-mentation of peat ( 14‰ to +10‰). A similar mixing model would explain the changes in the shallow pipe (P3) and the CHS flume, but not the deep pipe (P6).
[47] The range ind13C-CH4values in the CHS catchment is typical of Northern Hemisphere lakes and wetlands ( 64‰ to 58‰; Walter et al., 2008) and suggests the dominant source is from acetate fermentation, producing values in the range 65‰ to 50‰ [Hornibrook et al., 1997]. Values ofd13C-CO2ranging from +8.6‰to +9.2‰ have been measured at 4 m depth in Scottish peatlands [Clymo and Bryant, 2008;Garnett and Hardie, 2009] and it is known that fermentation processes in deep peats can produce highly 13C enriched CO2. Pathways for methano-genesis (CO2reduction or acetate fermentation) in peatlands can be identified by calculating an aC value, where aC = (d13C-CO2+ 1000)/(d13C-CH4+ 1000). Values of 1.03–1.07 from the pipes and outlet of the CHS catchment strongly suggest that acetate fermentation (characterized by aC values >0.95) is the most important pathway for CH4 pro-duction [Whiticar et al., 1986] at the study site. WhileClymo and Bryant[2008] andGarnett et al.[2011] found relatively little change inaCwith depth,Steinmann et al.[2008] and Hornibrook et al.[1997] found that theaCvalue increased from 1.02 at 5 cm depth to 1.07 at 600 cm depth. We found
that P6 had the highestaC values (1.06–1.07) compared to the other perennial pipe (P3) (1.04–1.05) and the more var-iable (1.03–1.06) ephemeral pipe (P8). Although we do not know howaCvaries with depth in the CHS catchment, these data may suggest that dissolved gases in P6 were derived from a deep source, P3 from a shallow source and P8 from several sources across a range of depths.
[48] The most depletedd13C-CH4value we measured was 67.7‰from P6, which is close to the most13C depleted CH4value recorded byClymo and Bryant[2008] in a raised bog in southwest Scotland. The most negative d13C-CH4 values were often (but not exclusively) associated with deeper water sources in the pre-storm, low-flow period and support results from CH4 isotope peat depth profiling at other sites, which showed that d13C-CH4 becomes more negative with depth [Hornibrook et al., 1997; Steinmann et al., 2008]. Clymo and Bryant [2008], however, found that CH4became more13C enriched at depth.Waldron et al. [1999], Chasar et al.[2000] and Hornibrook et al.[2000] found relatively small or non-existent changes with depth, presumably because of inconsistent and changing hydro-logical gradients within the profile affecting the reducing environment and the movement of dissolved gases at dif-ferent depths. This ledSteinmann et al.[2008] to conclude that isotopic composition could not be used to separate CH4 bursts in peat bogs originating from near-surface or deep sources.
[49] Although thed13C values of DOC and POC showed
[image:12.612.127.487.57.279.2]that they are isotopically similar and, like many other studies [e.g., Billett et al., 2007], are derived from decomposition associated with C3 plants, the sources of dissolved and evaded CO2 and CH4 were distinctly different (Table 2). Pipe P6 was consistently highly depleted in13C-CH4, and had a wide range of13C-CO2enriched values relative to the other pipes and CHS flume (Figure 9). Our stormflow sampling showed that the most13C-CO2depleted samples at P6 occurred at highest flows as water tables rise within the catchment. At this point the13C-CO2signal of P6 became
more like that of the ephemeral pipe (P8) and the CHS flume. The most 13C depleted CO2 measurements were associated with the shallow perennial pipe (P3), whereas the most13C enriched CH4samples were at the catchment out-let. The contemporary atmosphere in 2009 (d13C-CO2= ca. 8‰, d13C-CH4 = ca. 47‰) was isotopically distinct from the dissolved gas samples (Figure 9).
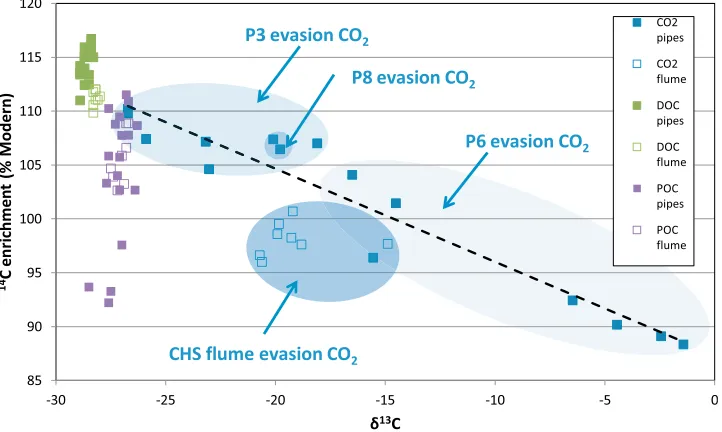
[image:13.612.61.297.55.229.2][50] The isotopic signature of evaded CO2 ranged from relatively 13C enriched/14C depleted values associated with P6, to13C depleted/14C enriched values associated with P3 (Figure 10). We also found a significant relationship between14C enrichment andd13C of evasion CO2collected at the pipe outlets (r2= 0.92,p< 0.001). The overall isotopic trend associated with pipe water CO2suggested that it was composed of a simple mixture of deep, old groundwater (produced from weathering or anaerobic fermentation) and
shallower, young (plant-derived) CO2 not dissimilar from pipe DOC, with the relative importance of the different sources changing in response to hydrological conditions (Figure 10). Our long-term (18 month) data set showed that pipe water derived from P6 had a higher mean pH and conductivity than P3 and P8, as well as significantly ele-vated CO2, CH4and N2O concentrations [Dinsmore et al., 2011]. Because P6 also produced the oldest CO2and POC compared to the other two pipes, both the geochemical and isotopic evidence points toward the pipe tapping deep peat carbon even though the pipe is only at 100 cm depth at its outlet in a peat face. The other perennial pipe (P3) and the ephemeral pipe (P8) have all the geochemical and isotopic characteristics of shallow pipes with good connectivity to near surface carbon, even though the latter has the deepest pipe outlet [Holden et al., 2012].
[image:13.612.127.488.481.697.2][51] The isotopic values of evasion CO2 at CHS flume clearly do not lie on the trend line associated with the three pipes (Figure 10), suggesting that an additional (more13C and/or14C depleted) source contributes to evasion CO2-C at CHS flume. Elevated Ca concentrations can occur under extreme low flow conditions at CHS, but during high flows, a geogenic (carbonate-derived) additional CO2source is less likely. Additionally, the fact that mean pH and conductivity at CHS flume was similar or lower than the three pipes, also suggests an additional geogenic CO2 source is unlikely [Dinsmore et al., 2011]. Isotopic fractionation during CO2 evasion between the pipe outlets and the CHS flume would lead to preferential loss of 12C and 13C enrichment, rather than13C depletion (Figure 10). We believe the most likely explanation for the presence of more13C and/or14C depleted evasion CO2at the CHS flume is a contribution from over-land flow/atmospheric CO2, which might be expected to have an isotopic signature ofd13C = ca. 27‰and14C = ca. 105% modern (if derived from atmospheric CO2and/or the decomposition of organic matter on/near the peat surface). The fact that the isotopic composition of evasion CO2 at
Figure 9. Relationship between thed13C isotopic composi-tion of dissolved CO2and CH4for the three pipes (P3, P6, P8) and the CHS flume during the three storm events.
CHS flume does not vary as much as the pipes, suggests that a relatively small proportion of pipe CO2reaches the flume (most is lost by evasion) or is diluted by non-pipe sources, such as overland flow. The isotopic evidence for evasion CO2therefore supports the findings of Holden et al. (sub-mitted manuscript, 2012), who made measurements of pipe C fluxes within the study catchment, and estimated that pipe outlets delivered to the surface 22% of the C that leaves the catchment outlet.
5.
Conclusions
[52] Isotopic measurements at a peatland site in northern
England showed that the age and source of C released from pipes into the drainage network is highly dynamic in space and time. This is particularly true for POC and the dissolved gases (CO2and CH4) and suggests thatd13C and14C com-position is a sensitive indicator of changes in hydrological pathway in peat systems. We found that individual pipes showed contrasting 13C enrichment trends and clearly tap both shallow (near-surface) and deep sources of CO2 and CH4within the catchment. In contrast, pipes did not receive deep DOC suggesting that, while connectivity exists for the gaseous C phase, it does not exist for the dissolved C phase. We also found that C leaving the catchment was a mixture of pipe and non-pipe sources.
[53] The radiocarbon age data showed that, although all
DOC and the majority of POC was modern, evasion CO2 was more age variable The oldest POC (maximum 652 years BP) and CO2(maximum 822 years BP) was produced from pipe P6, which showed all the geochemical and isotopic characteristics of tapping deep peat C. Various studies have recorded significant increases in soil C, CO2and DOC age with depth [e.g.,Clymo and Bryant, 2008]. At the peat sur-face (pipe outlets) and in the stream we found evidence for old soil C (POC) and CO2, but not DOC. This finding sug-gests that the transport pathways in peat that link gaseous, dissolved and particulate C to the surface are different. The observed differences for DOC and POC are less easy to explain, since aged DOC has been routinely measured in deep peats [Clymo and Bryant, 2008;Garnett et al., 2011]. Since the isotopic signature is potentially a mixture of dif-ferent sources we suggest that the amount of young DOC produced primarily from near-surface decomposing peat is so large that it masks the presence of any older deep peat DOC in the pipe system; this effect is not seen for CO2 because young gaseous C produced close to the peat surface will be lost directly to the atmosphere. Although we did not seek to measure “old”or“new”water, our findings do support the overall conclusion by Jones [2004] that the proportions of event and pre-event water vary from storm to storm and pipe to pipe within a single catchment.
[54] Natural pipes therefore play a dynamic (short-term)
and changing (long-term) role in peatland C loss. The iso-topic evidence presented here shows that pipes produce C derived from both shallow and deep sources in ombrotrophic bogs, supporting earlier suggestions [Holden and Burt, 2003b] that the traditional acrotelm-catotelm model for ombrotophic bogs [Ingram, 1978], whereby fluxes are mainly considered within an upper, shallow, active acrotelm zone, is inappropriate when considering C transfer from peat to the aquatic system.
Appendix A
[55] Table A1 contains a table showing thed13C values of
[image:14.612.311.550.124.726.2]DOC, POC, CO2 and CH4 of samples collected from the
Table A1. d13C Values of DOC, POC, CO2and CH4Samples
Site
Date and Time (dd/mm/yr) d13
C-DOC d13
C-POC d13
C-CO2 d13C-CH4
P3 07/04/09 1300 28.43 27.86 18.13 56.96 P3 08/04/09 0030 28.15 26.94 13.64 50.96 P3 08/04/09 0300 28.20 28.13 16.58 49.69 P3 08/04/09 0530 28.13 27.02 18.42 49.83 P3 08/04/09 1000 28.36 27.00 15.85 ns P3 09/04/09 0800 28.40 27.01 17.64 47.9 P6 07/04/09 1345 27.81 nsa 0.12 67.71 P6 08/04/09 0030 28.04 26.92 0.45 66.05 P6 08/04/09 0300 28.17 26.63 9.6 65.51 P6 08/04/09 0530 28.18 26.84 6.8 65.65 P6 08/04/09 1000 28.05 26.93 13.47 65.52 P6 09/04/09 0815 28.24 26.83 8.8 65.45 P8 08/04/09 0130 28.05 26.51 15.17 67.25 P8 08/04/09 0300 28.06 26.22 13.74 63.29 P8 08/04/09 0530 27.96 26.26 14.16 64 P8 08/04/09 1000 28.13 26.23 13.83 64.73 CHS 07/04/09 1320 27.65 26.89 13.2 44.57 CHS 08/04/09 0045 27.82 27.01 15.3 46.71 CHS 08/04/09 0300 27.58 26.36 15.89 49.68 CHS 08/04/09 0530 27.71 26.40 16.66 48.32 CHS 08/04/09 1000 27.96 26.11 12.93 48.74 CHS 09/04/09 0900 28.03 26.82 13.98 46.71
P3 19/08/09 1635 ns ns 20.35 49.54 P3 20/08/09 1115 ns ns 20.53 55.25 P3 20/08/09 1330 ns ns 20.22 56.25 P3 20/08/09 1500 28.34 27.55 20.01 56.33 P3 21/08/09 1030 28.35 27.45 19.74 54.19
P6 19/08/09 1535 ns ns 1.12 65.06
P6 20/08/09 1130 ns ns 2.37 63.00
P6 20/08/09 1340 ns ns 3.31 61.59
P6 20/08/09 1445 28.27 27.49 2.72 62.54 P6 21/08/09 0945 28.22 27.96 3.90 62.34 CHS 19/08/09 1610 ns ns 14.64 53.07 CHS 20/08/09 1055 ns ns 15.24 46.50 CHS 20/08/09 1310 ns ns 14.88 46.68 CHS 20/08/09 1450 27.89 26.57 15.12 46.97 CHS 21/08/09 1045 28.08 27.31 13.93 48.87
P3 16/11/09 0920 ns ns 18.64 59.82 P3 16/11/09 1150 ns ns 17.80 60.09 P3 16/11/09 1420 28.29 26.46 16.32 56.66 P3 16/11/09 1610 28.24 26.53 16.19 59.36 P3 17/11/09 1005 28.28 27.20 15.59 54.01 P3 17/11/09 1550 28.57 26.64 15.15 54.14 P3 18/11/09 1035 28.12 ns 12.39 48.90
P6 16/11/09 0915 ns ns 1.02 64.75
P6 16/11/09 1130 28.26 26.86 0.91 63.45 P6 16/11/09 1400 28.09 27.20 8.25 62.15 P6 16/11/09 1550 28.36 27.25 5.49 63.15 P6 17/11/09 0955 27.99 27.19 2.09 64.28 P6 17/11/09 1525 28.37 26.92 8.08 63.12 P6 18/11/09 1015 27.99 27.02 11.76 64.15 P8 16/11/09 1420 28.18 26.32 14.45 62.43 P8 16/11/09 1500 28.22 26.52 14.38 61.73 P8 16/11/09 1605 28.22 26.45 14.56 62.45 P8 17/11/09 1030 28.18 27.01 16.21 49.07 CHS 16/11/09 0900 27.84 26.66 15.07 47.70 CHS 16/11/09 1135 28.00 26.70 14.62 43.64 CHS 16/11/09 1400 27.77 26.18 14.40 43.26 CHS 16/11/09 1555 27.93 26.34 15.43 44.44 CHS 17/11/09 0945 ns 26.67 14.04 41.99 CHS 17/11/09 1530 27.91 26.54 14.57 43.21 CHS 18/11/09 1015 27.76 26.51 11.38 49.32
three pipes and the CHS flume and analyzed at the NERC Life Sciences Mass Spectrometry Facility.
Appendix B
[56] Table B1 contains a table showing 14C enrichment,
conventional radiocarbon ages and d13
C values of DOC-C, POC-C and evasion CO2-C of samples collected from the
[image:15.612.67.548.172.734.2]three pipes and the CHS flume and analyzed at the NERC Radiocarbon Facility. For evasion CO2 (1) sample times marked the end of the collection period and (2) have not been corrected for the effect of degassing into the free atmosphere. Samples marked with an asterisk had CO2 volumes lower than recommended when using molecular sieve cartridges (<4 mL); hence these values should be treated with caution.
Table B1. 14C Enrichment, Conventional Radiocarbon Ages andd13
C Values of DOC-C, POC-C and Evasion CO2-C of Samples
Sample Type/Site
Date and Time (dd/mm/yr)
Publication Code
14
C Enrichment % Modern1s
Conventional Age (Years BP1s)
d13CVPDB‰ +/ 0.1
Evasion CO2- P3 19/08/09 2000 SUERC-26041* 107.07 (0.49) modern 24.3 Evasion CO2- P3 20/08/09 0900 SUERC-26042 109.03 (0.51) modern 24.9 Evasion CO2- P3 20/08/09 1500 SUERC-26043 108.77 (0.51) modern 25.0 Evasion CO2- P6 19/08/09 1915 SUERC-26044 90.28 (0.43) 822 (38) 2.1 Evasion CO2- P6 20/08/09 1230 SUERC-26045 90.82 (0.41) 774 (36) 3.1 Evasion CO2- P6 20/08/09 1455 SUERC-26048* 91.72 (0.43) 694 (38) 5.0 Evasion CO2- CHS 19/08/09 2000 SUERC-26049 96.55 (0.45) 282 (37) 19.3 Evasion CO2- CHS 20/08/09 1300 SUERC-26050 98.79 (0.45) 98 (37) 18.7 Evasion CO2- CHS 20/08/09 1500 SUERC-26051 99.73 (0.43) 21 (35) 18.7
DOC-P3 19/08/09 1635 SUERC-26425 115.89 (0.53) modern 28.5
DOC-P3 20/08/09 1115 SUERC-26426 115.00 (0.53) modern 28.7
DOC-P3 20/08/09 1330 SUERC-26427 115.03 (0.53) modern 28.6
DOC-P6 19/08/09 1535 SUERC-26428 113.97 (0.50) modern 28.7
DOC-P6 20/08/09 1130 SUERC-26429 116.71 (0.54) modern 28.4
DOC-P6 20/08/09 1340 SUERC-26430 115.93 (0.51) modern 28.7
DOC-CHS 19/08/09 1610 SUERC-26431 112.01 (0.52) modern 28.2
DOC-CHS 20/08/09 1055 SUERC-26432 111.08 (0.51) modern 28.2
DOC-CHS 20/08/09 1310 SUERC-26435 111.36 (0.51) modern 28.0
POC-P3 19/08/09 1635 SUERC-27450 110.24 (0.51) modern 27.6
POC-P3 20/08/09 1115 SUERC-27451 105.83 (0.49) modern 27.6
POC-P3 20/08/09 1330 SUERC-27452 103.31 (0.45) modern 27.7
POC-P6 19/08/09 1535 SUERC-27453 93.67 (0.43) 526 (37) 28.5
POC-P6 20/08/09 1130 SUERC-27454 102.67 (0.45) modern 26.4
POC-P6 20/08/09 1340 SUERC-27455 93.27 (0.44) 559 (37) 27.5
POC-CHS 19/08/09 1610 SUERC-27456 104.68 (0.48) modern 27.5
POC-CHS 20/08/09 1055 SUERC-27457 103.91 (0.48) modern 27.4
POC-CHS 20/08/09 1310 SUERC-27460 103.24 (0.45) modern 26.9
Evasion CO2- P3 16/11/09 1700 SUERC-28149* 106.40 (0.50) modern 21.3 Evasion CO2- P3 17/11/09 1030 SUERC-28150 106.67 (0.50) modern 18.6 Evasion CO2- P3 17/11/09 1700 SUERC-28151* 104.55 (0.47) modern 21.3 Evasion CO2- P3 18/11/09 1200 SUERC-28152 106.44 (0.50) modern 16.9 Evasion CO2- P6 16/11/09 1530 SUERC-28160* 94.08 (0.41) 490 (35) 6.9 Evasion CO2- P6 17/11/09 1115 SUERC-28161 101.80 (0.44) modern 13.8 Evasion CO2- P6 17/11/09 1610 SUERC-28162* 97.48 (0.45) 205 (37) 14.8 Evasion CO2- P6 18/11/09 1045 SUERC-28163* 104.10 (0.45) modern 15.8 Evasion CO2- P8 17/11/09 1030 SUERC-28166* 105.94 (0.50) modern 18.5 Evasion CO2- CHS 16/11/09 1200 SUERC-28153 96.62 (0.45) 276 (38) 19.1 Evasion CO2- CHS 16/11/09 1400 SUERC-28156 97.62 (0.46) 193 (38) 17.5 Evasion CO2- CHS 16/11/09 1515 SUERC-28157 100.69 (0.44) modern 17.9 Evasion CO2- CHS 17/11/09 1700 SUERC-28158 98.25 (0.43) 142 (35) 17.8 Evasion CO2- CHS 18/11/09 1220 SUERC-28159 97.68 (0.43) 188 (35) 14.1
DOC-P3 16/11/09 0920 SUERC-30529 113.55 (0.52) modern 28.9
DOC-P3 16/11/09 1610 SUERC-30530 114.20 (0.50) modern 28.9
DOC-P3 17/11/09 1550 SUERC-30531 112.48 (0.49) modern 28.5
DOC-P3 18/11/09 1035 SUERC-30534 113.39 (0.50) modern 28.9
DOC-P6 16/11/09 0915 SUERC-30540 115.00 (0.50) modern 28.3
DOC-P6 16/11/09 1550 SUERC-30541 115.08 (0.50) modern 28.7
DOC-P6 17/11/09 1525 SUERC-30544 112.42 (0.49) modern 28.7
DOC-P6 18/11/09 1015 SUERC-30545 110.99 (0.51) modern 28.9
DOC-P8 16/11/09 1420 SUERC-30546 113.37 (0.52) modern 28.5
DOC-P8 16/11/09 1605 SUERC-30547 115.83 (0.53) modern 28.4
DOC-CHS 16/11/09 0900 SUERC-30535 110.56 (0.51) modern 28.3
DOC-CHS 16/11/09 1135 SUERC-30536 111.05 (0.48) modern 28.1
DOC-CHS 16/11/09 1555 SUERC-30537 112.03 (0.52) modern 28.2
DOC-CHS 17/11/09 1530 SUERC-30538 109.85 (0.48) modern 28.3
DOC-CHS 18/11/09 1015 -SUERC-30539 111.76 (0.51) modern 28.3
POC-P3 16/11/09 0920 SUERC-29750 102.68 (0.45) modern 27.1
[57] Acknowledgments. The research was funded by UK Natural Environment Research Council (NERC) grant NE/E003168/1, with addi-tional support from the NERC Radiocarbon Facility (Allocation 1380.0409) and the NERC Life Sciences Mass Spectrometry Facility (Allo-cation SIU190). Cottage Hill Sike is a NERC Centre for Ecology and Hydrology Carbon Catchment and is part of the Moor House Environmen-tal Change Network site. We are grateful to ECN for background data from the catchment and to Natural England for granting access.
References
Adamson, J. K., W. A. Scott, A. P. Rowland, and G. R. Beard (2001), Ionic concentrations in a blanket peat bog in northern England and correlations with deposition and climate variables, Eur. J. Soil Sci., 52, 69–79, doi:10.1046/j.1365-2389.2001.t01-1-00350.x.
Aravena, R., B. G. Warner, D. J. Charman, L. R. Belyea, S. P. Mathur, and H. Dinel (1993), Carbon isotopic composition of deep carbon gases in an ombrogenous peatland, northwestern Ontario, Canada,Radiocarbon,35, 271–276.
Ball, D. F. (1964), Loss on ignition as an estimate of organic matter and organic carbon in non-calcareous soils, J. Soil Sci., 15, 84–92, doi:10.1111/j.1365-2389.1964.tb00247.x.
Billett, M. F., and M. H. Garnett (2010), The isotopic composition of CO2lost by evasion from surface water to the atmosphere: A methodo-logical comparison of a direct and indirect approach,Limnol. Oceanogr. Methods,8, 45–53, doi:10.4319/lom.2010.8.0045.
Billett, M. F., and T. R. Moore (2008), Supersaturation and evasion of CO2and CH4in surface waters at Mer Bleue peatland, Canada,Hydrol.
Processes,22, 2044–2054, doi:10.1002/hyp.6805.
Billett, M. F., C. M. Deacon, S. M. Palmer, J. J. C. Dawson, and D. Hope (2006a), Connecting organic carbon in stream water and soils in a peatland catchment,J. Geophys. Res.,111, G02010, doi:10.1029/2005JG000065. Billett, M. F., M. H. Garnett, and S. M. L. Hardie (2006b), A direct method
to measure14CO2lost by evasion from surface waters,Radiocarbon,48, 61–68.
Billett, M. F., M. H. Garnett, and F. Harvey (2007), UK peatland streams release old carbon dioxide to the atmosphere and young dissolved organic carbon to rivers, Geophys. Res. Lett., 34, L23401, doi:10.1029/ 2007GL031797.
Billett, M. F., et al. (2010), Carbon balance of UK peatlands: Current state of knowledge and future research challenges, Clim. Res.,45, 13–29, doi:10.3354/cr00903.
Billett, M. F., M. H. Garnett, K. J. Dinsmore, K. E. Dyson, F. Harvey, A. M. Thomson, S. Piirainen, and P. Kortelainen (2011), Age and source of different forms of carbon released from boreal peatland streams during spring snowmelt in E. Finland,Biogeochemistry,107, 1–14, doi:10.1007/ s10533-011-9645-4.
Charman, D. J., R. Aravena, C. L. Bryant, and D. D. Harkness (1999), Carbon isotopes in peat, DOC, CO2, and CH4in a Holocene peatland in Dartmoor, southwest England,Geology,27, 539–542, doi:10.1130/ 0091-7613(1999)027<0539:CIIPDC>2.3.CO;2.
Chasar, L. S., J. P. Chanton, P. H. Glaser, D. I. Siegel, and J. S. Rivers (2000), Radiocarbon and stable carbon isotopic evidence for transport and transformation of dissolved organic carbon, dissolved inorganic carbon, and CH4in a northern Minnesota peatland,Global Biogeochem.
Cycles,14, 1095–1108, doi:10.1029/1999GB001221.
Clark, J. M., P. J. Chapman, J. K. Adamson, and S. N. Lane (2005), Influence of drought-induced acidification on the mobility of dissolved organic carbon in peat soils, Global Change Biol., 11, 791–809, doi:10.1111/j.1365-2486.2005.00937.x.
Clymo, R. S., and C. L. Bryant (2008), Diffusion and mass flow of dissolved carbon dioxide, methane, and dissolved organic carbon in a 7-m deep raised peat bog,Geochim. Cosmochim. Acta,72, 2048–2066, doi:10.1016/j.gca.2008.01.032.
Cole, L., R. D. Bardgett, P. Ineson, and J. K. Adamson (2002), Relationships between enchytraeid worms (Oligochaeta), climate change, and the release of dissolved organic carbon from blanket peat in northern England,Soil Biol. Biochem.,34, 599–607, doi:10.1016/S0038-0717(01)00216-4. Dawson, J. J. C., M. F. Billett, and D. Hope (2001), Diurnal variations in the
carbon chemistry of two acidic upland streams in northeast Scotland, Freshwater Biol.,46, 1309–1322, doi:10.1046/j.1365-2427.2001.00751.x. Dawson, J. J. C., M. F. Billett, C. Neal, and S. Hill (2002), A comparison of particulate, dissolved and gaseous carbon in two contrasting upland streams in the UK,J. Hydrol.,257, 226–246, doi:10.1016/S0022-1694(01)00545-5. Dinsmore, K. J., and M. F. Billett (2008), Continuous measurement and modeling of CO2losses from a peatland stream during stormflow events,
Water Resour. Res.,44, W12417, doi:10.1029/2008WR007284. Dinsmore, K. J., U. M. Skiba, M. F. Billett, and R. M. Rees (2009), Spatial
and temporal variability in CH4 and N2O fluxes from a Scottish ombrotrophic peatland; implications for modelling and upscaling,Soil Biol. Biochem.,41, 1315–1323, doi:10.1016/j.soilbio.2009.03.022. Dinsmore, K. J., M. F. Billett, U. M. Skiba, R. M. Rees, and C. Helfter
(2010), Role of the aquatic pathway in the carbon and greenhouse gas budgets of a peatland catchment,Global Change Biol.,16, 2750–2762, doi:10.1111/j.1365-2486.2009.02119.x.
Dinsmore, K. J., R. P. Smart, M. F. Billett, J. Holden, A. J. Baird, and P. J. Chapman (2011), Greenhouse gas losses from peatland pipes: A major pathway for loss to the atmosphere? J. Geophys. Res., 116, G03041, doi:10.1029/2011JG001646.
Doctor, D., C. Kendall, S. Sebestyen, J. Shanley, N. Ohte, and E. Boyer (2008), Carbon isotope fractionation of dissolved inorganic carbon (DIC) due to outgassing of carbon dioxide from a headwater stream, Hydrol. Processes,22, 2410–2423, doi:10.1002/hyp.6833.
Evans, C. D., C. Freeman, L. G. Cork, D. N. Thomas, B. Reynolds, M. F. Billett, M. H. Garnett, and D. Norris (2007), Evidence against recent climate-induced destabilisation of soil carbon from14C analysis of riverine dissolved organic matter, Geophys. Res. Lett.,34, L07407, doi:10.1029/2007GL029431.
Evans, M. G., T. P. Burt, J. Holden, and J. K. Adamson (1999), Runoff generation and water table fluctuations in blanket peat: Evidence from UK data spanning the dry summer of 1995,J. Hydrol.,221, 141–160, doi:10.1016/S0022-1694(99)00085-2.
Garnett, M. H., and S. M. L. Hardie (2009), Isotope (14C and13C) analysis of deep peat CO2using a passive sampling technique,Soil Biol. Biochem.,
41, 2477–2483, doi:10.1016/j.soilbio.2009.09.004.
Garnett, M. H., S. M. L. Hardie, and C. Murray (2011), Radiocarbon and stable carbon analysis of dissolved methane and carbon dioxide from the profile of a raised peat bog,Radiocarbon,53, 71–83.
Gorham, E. (1991), Northern peatlands: Role in the carbon cycle and probable responses to climatic warming, Ecol. Appl., 1, 182–195, doi:10.2307/1941811.
[image:16.612.60.552.72.238.2]Guo, L., and R. W. MacDonald (2006), Source and transport of terrigenous organic matter in the upper Yukon River: Evidence from isotope (d13C, Table B1. (continued)
Sample Type/Site
Date and Time (dd/mm/yr)
Publication Code
14
C Enrichment % Modern1s
Conventional Age (Years BP1s)
d13 CVPDB‰ +/ 0.1
POC-P3 16/11/09 1610 SUERC-29752 108.66 (0.50) modern 26.3
POC-P3 17/11/09 1550 SUERC-29753 107.77 (0.50) modern 26.7
POC-P3 18/11/09 1035 SUERC-29754 108.79 (0.50) modern 27.3
POC-P6 16/11/09 0915 SUERC-29762 92.21 (0.40) 652 (35) 27.6
POC-P6 16/11/09 1130 SUERC-29763 104.01 (0.46) modern 27.2
POC-P6 16/11/09 1550 SUERC-29764 105.73 (0.49) modern 27.1
POC-P6 17/11/09 1525 SUERC-29765 107.75 (0.50) modern 27.0
POC-P6 18/11/09 1015 SUERC-29766 97.57 (0.45) 197 (37) 27.0
POC-P8 16/11/09 1420 SUERC-29767 110.89 (0.51) modern 26.7
POC-P8 16/11/09 1605 SUERC-29770 111.52(0.51) modern 26.8
POC-CHS 16/11/09 0900 SUERC-29755 105.87 (0.47) modern 27.0
POC-CHS 16/11/09 1135 SUERC-29756 102.64 (0.45) modern 27.2
POC-CHS 16/11/09 1555 SUERC-29757 108.86 (0.50) modern 26.8
POC-CHS 17/11/09 1530 SUERC-29760 106.6 (0.47) modern 26.8