Sonar Image Based Advanced Feature Extraction and
Feature Mapping Algorithm for Under-Ice AUV
Navigation
Herath Mudiyanselage Dinuka Doupadi Bandara,
National Centre for Maritime Engineering and Hydrodynamics
Australian Maritime College
Submitted in partial fulfilment of the requirements for the degree of Master of Philosophy University of Tasmania
iii
DECLARATIONS
Declaration of Originality and Authority of Access
This thesis contains no material which has been accepted for a degree or diploma by the University or any other institution, except by way of background information and duly acknowledged in the thesis, and to the best of my knowledge and belief no material previously published or written by another person except where due acknowledgement is made in the text of the thesis, nor does the thesis contain any material that infringes copyright.
This thesis may be made available for loan and limited copying and communication in accordance with the Copyright Act 1968.
---
iv
ACKNOWLEDGEMENT
It is hard to believe my wonderful journey is coming to an end. However, the completion of this thesis marks the beginning of another great adventure ahead. Thus, it is with great pleasure that I thank the many people who made this thesis possible.
First and foremost I would like to thank my supervisors Dr Hung Nguyen, Assistant Professor Alexander Forrest, Dr Shantha Jayasinghe and Dr Zhi Quan Leong for their invaluable guidance, consistent support, good company and encouragement throughout my research work. It is difficult to overstate my gratitude to them as they have not only been great supervisors but also great mentors.
I would also wish to express my gratitude to Mr Peter King for his valuable support and guidance in this research. Also, I would like to thank the AUV team at AMC including Dr Damien Guihen and Dr Konrad Zurcher for their support and advice regarding my research. Moreover, I would like to thank all my friends who have created a very unforgettable memory in this journey as well as staff members at AMC and UTAS.
Sonar images were provided by the Responsive AUV Localisation and Mapping (REALM) project, supported by the Atlantic Canada Opportunities Agency Atlantic Innovation Fund, Research & Development Corporation Newfoundland and Labrador, Fugro GeoSurvey’s Inc. and Memorial University of Newfoundland.
vi
ABSTRACT
Navigation and localisation of AUVs are challenging in underwater or under-ice environments due to the unavoidable growth of navigational drift in inertial navigation systems and Doppler velocity logs, especially in long-range under-ice missions where surfacing is not possible. Similarly, acoustic transponders are time consuming and difficult to deploy. Terrain Relative Navigation (TRN) and Simultaneous Localisation and Mapping (SLAM) based technologies are emerging as promising solutions as they require neither deploying sensors nor the calculation of distance travelled from a reference point in order to determine the location. These techniques require robust detection of the features present in sonar images and matching them with known images. The key challenge of under-ice image based localisation comes from the unstructured nature of the seabed terrain and lack of significant features. This issue has motivated the research project presented in this thesis. The research has developed technologies for the robust detection and matching of the available features in such environments.
vii filtering effect. This thesis presents a comprehensive performance comparison of feature detection and matching of the SURF, Harris, FAST, BRISK and FREAK algorithms, with filtering effects. However, these detectors and descriptors have reduced efficiency in underwater environments lacking features. Therefore, this research further addressed this problem by developing new advanced algorithms named the ‘SURF-Harris’ algorithm, which combined Harris interest points with the SURF descriptor, and the ‘SURF-Harris-SURF’ algorithm which combined Harris and SURF interest points with the SURF descriptor, using the most significant factor of each detector and descriptor to give better performance, especially in feature mapping.
ix
Contents
Chapter 1 Introduction ... 1
1.1 Background ... 1
1.2 Problem Definition ... 3
1.3 Scope of the Thesis ... 4
1.3.1 Objectives ... 5
1.4 Expected Outcomes ... 5
1.5 Principal Contributions ... 6
1.6 Methodology ... 6
1.7 Thesis Structure ... 7
Chapter 2 Literature Review ... 8
2.1 Internal Sensors ... 9
2.1.1 Inertial Navigation Systems (INS) ... 9
2.1.2 Doppler Velocity Log (DVL) ... 10
2.2 External Sensors ... 12
2.2.1 Acoustic Transponders ... 12
2.2.2 Side-Scan Sonar and Multi-Beam Sonar ... 13
2.3 State Estimators for Under-Ice Localisation and Mapping ... 15
2.3.1 Terrain Relative Navigation (TRN) ... 15
2.3.2 Simultaneous Localisation and Mapping (SLAM) ... 17
2.4 Summary ... 20
Chapter 3 Performance Comparison of Keypoint Detectors and Descriptors... 21
3.1 Introduction ... 21
3.2 Detectors and Descriptors ... 23
3.2.1 Speeded-Up Robust Features (SURF) ... 24
3.2.2 Harris Detector ... 25
3.2.3 Features from Accelerated Segment Test (FAST) ... 25
3.2.4 Binary Robust Invariant Scalable Keypoints (BRISK) ... 26
3.2.5 Fast Retina Keypoints (FREAK) ... 28
3.3 Methodology ... 29
3.3.1 Image Acquisition ... 29
3.3.2 Image Preparation ... 37
3.3.3 Keypoint Detection ... 40
3.3.4 Keypoint Matching ... 41
x
3.4.1 Keypoint Detection ... 43
3.4.2 Verification of Keypoint Matching ... 50
3.5 Summary ... 52
Chapter 4 Advanced Feature Detection and Mapping Algorithm ... 53
4.1 Introduction ... 53
4.2 Methodology ... 54
4.2.1 SURF-Harris (SUHA) Algorithm ... 54
4.2.2 SURF-Harris-SURF Algorithm (SUHASU) ... 58
4.3 Evaluation Method for Feature Detection and Mapping ... 59
4.3.1 Image Acquisition ... 59
4.3.2 Image Pre-processing ... 63
4.3.3 Keypoint Detection ... 63
4.3.4 Keypoint Mapping ... 63
4.4 Results and Discussion ... 64
4.4.1 Keypoint Detection and Mapping ... 64
4.5 Comparison of Results ... 67
Chapter 5 Summary, Conclusion and Future Work ... 70
5.1 Summary ... 70
5.2 Conclusion ... 72
5.3 Future Work ... 73
xi
List of Figures
Figure 1-1. Under-ice terrain (low contrast and repetitive ice-texture) on the ... 4
Figure 1-2. Side-scan sonar image with lack of significant features ... 5
Figure 2-1. Classification of AUV navigation and localisation techniques ... 9
Figure 2-2. Operation of the DVL sensor in water track mode (Medagoda et al. 2016) ... 10
Figure 2-3. Communication networks ... 12
Figure 3-1. The segment test used by the FAST descriptor (Rosten & Drummond 2006) ... 26
Figure 3-2. Scale-space keypoints detection of BRISK (Leutenegger et al. 2011) ... 27
Figure 3-3. Sampling Pattern of BRISK descriptor (Leutenegger et al. 2011) ... 27
Figure 3-4. Major steps in image processing ... 29
Figure 3-5. Survey terrain in Holyrood Arm, Newfoundland and Labrador, Canada (47.388N, 53.1335W) (King et al. 2014) ... 30
Figure 3-6. Data flow of sonar image capture ... 30
Figure 3-7. (a) Original image before resizing and filtering; (b) image after filtering; (c) contrast enhanced image and (d) morphologically filtered image with Data Set 8 first day image (Image 15) 39 Figure 3-8. Keypoints detected in Data Set 8 (Image 15) with the (a) SURF algorithm; (b) FAST algorithm ... 43
Figure 3-9. Retain percentage of the number of key points ... 45
Figure 3-10. Key points matching using SURF Data Set 8 ... 46
Figure 3-11. Number of matches produced by each algorithm for Data Sets 1–13 (note: Data Set 14 is deliberately removed from this diagram as it matches the features in the same image) ... 48
Figure 3-12. Number of keypoints matching percentage ... 48
Figure 3-13. (a) Harris detector with all of the keypoints matching; (b) None of the keypoint matching ... 50
Figure 4-1. (a) The sliding sector window used in SURF to compute the dominant orientation of the Haar features to add rotational invariance to the SURF features. (b–c) The feature vector construction process, showing a grid containing a 4x4 region subdivided into 4x4 sub-regions and 2x2 (Bay et al. 2008)... 56
Figure 4-2. Flow chart in image processing ... 59
Figure 4-3. Keypoints matching using the ‘SURF-Harris-SURF’ algorithm for Data Set 5 ... 66
Figure 4-4. Keypoints matching using Data Set 5 with (a) SURF algorithm; (b) FAST algorithm; (c) Harris algorithm; (d) BRISK algorithm; (e) FREAK algorithm; (f) Harris algorithm; (g) SURF-Harris-SURF algorithm ... 67
xii
List of Tables
xiii
List of Abbreviations
AUG Autonomous Glider
AUV Autonomous Underwater Vehicle
BRIEF Binary Robust Independent Elementary Feature
BRISK Binary Robust Invariant Scalable Keypoints
CML Concurrent Mapping and Localisation
DoH Determinant of Hessian
DT Distance Travel
DVL Doppler Velocity Log
EKF Extended Kalman Filter
FAST Features from Accelerated Segment Test
FREAK Fast Retina Keypoints
GIB Global Positioning System Intelligent Buoys
GPS Global Positioning System
INS Inertial Navigation Systems
LBL Long Baseline
LOG Laplacian of Gaussian
MBES Multi-Beam Echo Sounder
MSAC M-Estimator Sample Consensus
PSNR Peak Signal to Noise Ratio
RANSAC Random Sample Consequence
SIFT Scale-Invariant Feature Transform
xiv
SSD Sum of Squared Difference
SSS Side-Scan Sonars
SURF Speeded-Up Robust Features
SUSAN Smallest Univalue Segment Assimilating Nucleus
TRN Terrain Relative Navigation
xv
Nomenclature
(x, y) Given point of the image I
𝐼𝑥 Partial derivatives of 𝑥 in Harris detector
𝐼𝑦 Partial derivatives of 𝑦 in Harris detector
𝐿𝑥𝑦(𝐱, 𝜎) Convolution of the Gaussian second order derivative with image I in point xy
𝐿𝑦𝑦(𝐱, 𝜎) Convolution of the Gaussian second order derivative
with image I in point y
𝑉𝐷𝑉𝐿 Velocity of the DVL in the navigation frame
𝑉𝑐 Water current velocity in the navigation frame
𝑑𝑥, 𝑑𝑦 Derivatives in the 𝑥 and 𝑦 for sub-regions
𝑟𝑏,1 ,𝑟𝑏,2, 𝑟𝑏,3 𝑎𝑛𝑑𝑟𝑏,4 Unit vector along the beam
𝑣1,𝑣2, 𝑣3 𝑎𝑛𝑑 𝑣4 Four beams, assumed to be mounted at 300 degrees
from the vertical in the DVL
(𝑥, 𝑦) Difference in intensity for a displacement in all direction
λ1, λ2 Eigenvalues of Matrix C
𝐸(𝑥, 𝑦) Corner detection
𝐻(𝐱, 𝜎) Hessian matrix
𝐼 Image patch over the area of (𝑢, 𝑣)and shifted by
(𝑥, 𝑦)
𝐼(𝑢, 𝑣)]2 Intensities
xvi
𝐿 𝑥𝑥(𝐱, 𝜎) Convolution of the Gaussian second order derivative with image I in point
n Layers of the pyramid
𝐶𝑖 Octaves of the pyramid
𝑑𝑖 Intra-octaves of the pyramid
𝑃 Total matrix of Harris features and Hessian features in
matrix form
𝑃1 Calculated Hessian features (matrix form)
𝑃2 Calculated Harris features (matrix form)
𝑉 Haar wavelent response vector for horizontal and
vertical (Sub-region)
𝑐(𝑥, 𝑦) Intensity structure of the local neighbourhood
𝑤 (𝑢, 𝑣) Window function
1
Chapter 1
Introduction
1.1
Background
Autonomous underwater vehicles (AUVs) are becoming increasingly popular in underwater operations such as search and rescue (Jacoff et al. 2015), mapping (Caress et al. 2012), climate change assessments (Schofield et al. 2010), marine habitat monitoring (Williams et al. 2012), shallow water mine countermeasures (Freitag et al. 2005), pollutant monitoring (McCarthy & Sabol 2000) and under-ice inspection (McFarland et al. 2015). As the name suggests, AUVs should be able to determine their location and course without human intervention. In order to achieve this, AUVs need to address two critical problems: 1) mapping the environment through which they are transiting and 2) finding their location relative to the map. Although GPS is a widely used positioning method in land and aerial vehicles, AUVs cannot rely on it underwater due to the rapid attenuation of radio signals in water (Paull et al. 2014). In addition, current underwater localisation systems tend to rely on baseline transponders. However, these techniques are not able to provide accurate position estimates for long-range missions, especially for AUVs operating in under-ice environments.
Over the last few decades, AUV operations have continued to push the limits of the existing technology and return measurements that would be logistically impossible by other means. Nevertheless, fully autonomous navigation under ice still requires further significant development since:
Under-ice environments are largely low contrast compared to land terrain, often featureless (e.g. smooth ice) and are comprised mostly of repetitive ice textures (Spears et al. 2015);
Navigation under translating and rotating surfaces such as icebergs remains an unsolved problem (McFarland et al. 2015);
Unavoidable growth of navigational drift in the position estimates (Webster et al. 2015); and
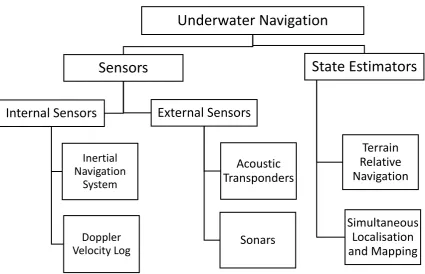
2 There are various potential AUV internal and external sensors, and state estimators to aid navigation in under-ice environments. Internal sensors such as the Inertial Navigation System (INS) do not measure position, but rather determine the location internally by integrating instantaneous vehicle velocities or accelerations. External systems determine positions relative to the properties or features of the environment, and state estimators represent the algorithms used for underwater localisation and mapping such as Terrain Relative Navigation (TRN) and Simultaneous Localisation and Mapping (SLAM). Sonar imaging, Doppler Velocity Log (DVL), and underwater acoustic positioning systems are some of the sensor-based navigation support systems. Out of these solutions, sonar imaging is the most feasible method as it uses natural features present in the environment (Kimball & Rock 2011; Richmond et al. 2009; Miller et al. 2010). Apart from that, sonar imaging is free from the drift and thus no extra recalibration effort is required. Therefore, in recent years, there has been an increased research interest in sonar imaging based AUV localisation in academia as well as in the industry (Bandara et al. 2016; Li et al. 2017; Song et al. 2016).
3
1.2
Problem Definition
Extracting reliable key features in dynamic and unstructured underwater environments is the major challenge in underwater navigation (Chen & Hu 2011; Guth et al. 2014). This becomes even more difficult when dealing with the unstructured nature of ice terrains which are largely low contrast, featureless and comprised mostly of repetitive ice texture (Spears et al. 2015) as shown in Figure 1-1. Moreover, if the entire surveyed region lacks texture and variations, determining the accurate location of the AUV is virtually impossible without advanced feature detection methods.
There are a number of feature detectors and descriptors reported in the literature that have been developed primarily for land and aerial vehicles. Among these, the most popular feature detectors and descriptors are Harris corner (Harris & Stephens 1988) detectors, Smallest Univalue Segment Assimilating Nucleus (SUSAN) (Smith 1992), Scale-Invariant Feature Transform (SIFT) (Lowe 1999), Speeded-Up Robust Features (SURF) (Bay et al. 2006), Features from Accelerated Segment Test (FAST), (Rosten & Drummond 2006), Binary Robust Independent Elementary Features (BRIEF) (Calonder et al. 2010), Binary Robust Invariant Scalable Keypoints (BRISK) (Leutenegger et al. 2011) and Fast Retina Keypoints (FREAK) (Alahi et al. 2012).
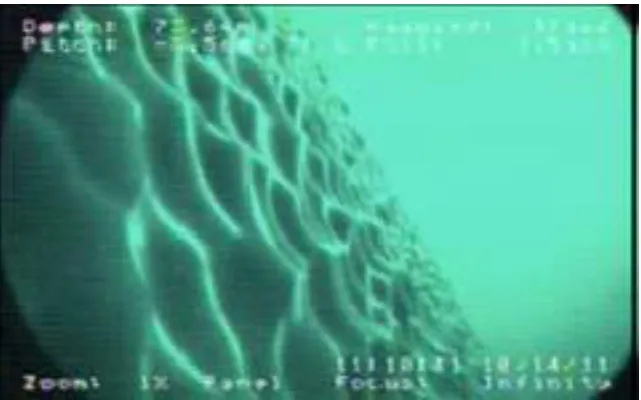
4 Figure 1-1. Under-ice terrain (low contrast and repetitive ice-texture) on the
side wall of the Petermann Ice Island (Forrest et al. 2012)
[This figure is used with permission from author, Alexander L Forrest “Digital terrain mapping of Petermann Ice Island fragments in the Canadian high arctic. 21st IAHR International Symposium on Ice, 2012. 1-12]
1.3
Scope of the Thesis
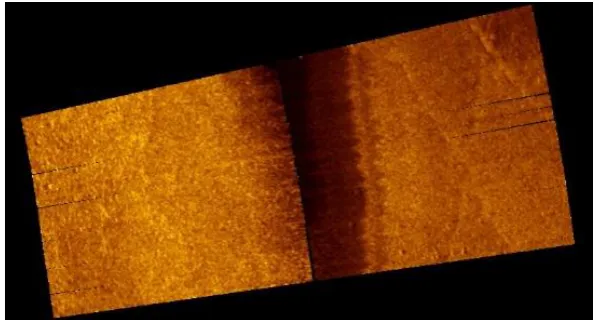
The motivation behind this study is to develop new advanced algorithms for feature detection and feature matching to work in underwater environments which are lacking in significant features or variations. These environments are largely low contrast compared to land terrain and are mostly featureless, as shown in the side-scan sonar image of the seabed in Figure 1-2. Therefore, the specific research question for this thesis is:
‘Can a sonar image based feature detector and descriptor algorithm be developed to provide more reliable results for AUV navigation in under-ice environments which lack significant texture and distinguishable patterns?’
Moreover, this thesis outlines the importance of developing an advanced feature detection and mapping algorithm, especially for sonar images to work in underwater or under-ice environments.
5 Figure 1-2. Side-scan sonar image with lack of significant features
1.3.1 Objectives
While answering the above-mentioned research question of the thesis, the following objectives were achieved:
Identified suitable keypoint detectors and descriptors that can be used for side-scan sonar images based localisation and mapping.
Developed two novel keypoint detector and matching algorithms to work in underwater environments.
1.4
Expected Outcomes
To identify potential keypoint detectors and descriptors to work with side-scan sonar images in underwater environments and assess their performance with regard to filtering effect.
6
1.5
Principal Contributions
The principal contributions of this thesis include:
The development and testing of two new advanced algorithms named ‘SURF-Harris’, which combines Harris interest points with SURF descriptor, and ‘SURF-Harris-SURF’ which combines Harris and SURF interest points with SURF descriptor to yield better performance, especially in feature mapping; and
Investigation into the effects of filtering applied to conventional feature detection and description in side-scan sonar images collected over two consecutive days, covering a wide range of scenarios that can occur in an underwater environment.
1.6
Methodology
To achieve the outcomes of this thesis, the research questions are addressed through three main components:
A review of the literature on technologies for underwater and under-ice AUV navigation and localisation, especially those using side-scan sonar images.
Analysis of potential keypoint detector and descriptor algorithms which can be used for side-scan sonar images in a wide range of scenarios that can occur in underwater environments such as clutter, mud, sand, stones and lack of features with filtering effect.
7
1.7
Thesis Structure
Chapter 1: Introduces the background, research questions, objectives and the direction of the research on ‘developing a sonar image based feature detector and descriptor algorithm for AUV navigation’. Major contributions and the organisation of the thesis are also summarised in this introductory chapter.
Chapter 2: Outlines and discusses the literature surrounding underwater AUV navigation and localisation. The direction for subsequent work is framed to incorporate existing work on the subject, while identifying areas of further work that are possible.
Chapter 3: Starts with evaluating potential feature (keypoint) detectors and descriptors which can be used for side-scan sonar images in underwater environments. According to the tests carried out with side-scan sonar images, SURF, Harris, FAST, BRISK and FREAK feature detectors and descriptors are selected. These algorithms are used for a wide range of scenarios that can occur in underwater environments such as clutter, mud, sand, stones and lack of features, and effects on the sonar images such as scaling, rotation and non-uniform intensity and backscatter with filtering effect. Relevant simulation results and major problems associated with the conventional detectors and descriptors are explained in detail.
Chapter 4: Outlines and discusses a novel contribution of new advanced algorithms ‘SURF-Harris’ and ‘SURF-Harris-SURF’ which give better performance, especially in feature mapping. Relevant methodology and simulation results are explained in detail.
8
Chapter 2
Literature Review
Autonomous platforms have been used under ice since the early 1970s (Francois et al. 1972). Since then, AUVs have been used for numerous underwater operations and under-ice inspections. These under-ice missions have pushed the limits of existing technology and provided highly valuable scientific information, but the ability of an autonomous platform to consistently estimate its own geo-referenced position in real time with acceptable accuracy continues to be a challenge. Current underwater localisation systems tend to rely on baseline transponders and are unable to provide accurate position estimates for long-range missions. This is especially true for AUVs operating in under-ice environments. This chapter provides a comprehensive review of suitable sensors and navigation methods for under-ice AUV navigation followed by new methodologies proposed in subsequent chapters, which can be implemented for future developments for under-ice navigation, especially in featureless environments.
9 Figure 2-1. Classification of AUV navigation and localisation techniques
2.1
Internal Sensors
There are various sensors deployed in AUVs for under-ice navigation and localisation such as Inertial Navigation Systems (INSs) and Doppler Velocity Logs (DVLs). INS units navigate relative to the initial position. They require accurate knowledge of the vehicle state which depends on sensors to provide measurements of the derivatives of the states (Hildebrandt et al. 2013).
2.1.1 Inertial Navigation Systems (INS)
INS units are an advanced form of dead reckoning that consists of an embedded computer, motion sensors (accelerometer), and rotation sensors (gyroscope) to continuously calculate the position, orientation and velocity of a moving object without the need for external references. According to Grewal et al. (2007) the main advantages of INS over other forms of navigation are autonomy and independency from other external aids. In addition, an INS is suitable for integrated navigation, guidance and control. Most of the time, an INS corrects its position measurements using a GPS receiver. A GPS/INS integrated system can achieve relatively high accuracy of localisation in a shallow water environment within a short
10 period of time with regular surfacing for GPS fixes. However, INS accumulated errors have effects on localisation error if they are not corrected by GPS for a long time (Chen et al. 2013). Therefore, GPS/INS is not suitable for under-ice long-range missions where regular surfacing for GPS fixes is not possible. Kinsey et al. (2006) showed navigation-grade INS with 0.010 gyro
bias. This bias translates into a ∼1 km/h position drift without aiding. Therefore, INS is a better solution for navigation systems for both sea floor and ice surface with DVL. However, one of the biggest challenges of using these units in polar regions is to achieve alignment at high latitude where rotational accelerations are at a minimum.
2.1.2 Doppler Velocity Log (DVL)
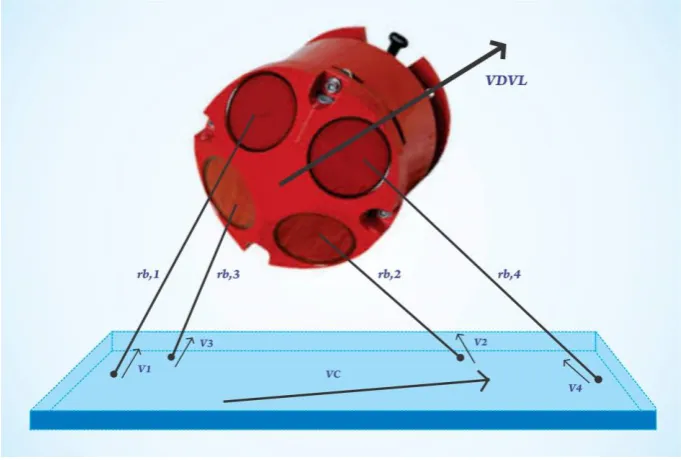
[image:27.595.134.475.426.656.2]A Doppler Velocity Log (DVL) uses acoustic measurements to capture bottom tracking and determines the velocity vector of an AUV moving across the seabed, as shown in Figure 2-2. It determines the AUV surge, sway and heave velocities by transmitting acoustic pulses and measuring the Doppler shifted returns from the pulses off the seabed (Paull et al. 2014).
11
𝑉𝐷𝑉𝐿 - Velocity of the DVL in the navigation frame
𝑉𝑐 - Water current velocity in the navigation frame
𝑣1,𝑣2, 𝑣3 𝑎𝑛𝑑 𝑣4 - Four beams, assumed to be mounted at 300 from the vertical in the
DVL
𝑟𝑏,1 ,𝑟𝑏,2, 𝑟𝑏,3 𝑎𝑛𝑑𝑟𝑏,4 - Unit vector along the beam
According to the previous field experiment reports, the biggest challenge in DVL-based navigation is the drift in the position estimates (Kaminski et al. 2010; McEwen et al. 2005; Richmond et al. 2009). This becomes even more difficult in long-range AUV navigation (Medagoda et al. 2016). Nevertheless, a DVL is hardly ever used alone for underwater navigation and is generally combined with other sensors such as acoustic transponders and INS units (Hou et al. 2008; Lin & Wei 2004; Rigby et al. 2006). Therefore, it is important to use another feasible methodology such as combination of TRN and SLAM with sonars for under-ice missions rather than conventional sensors. Moreover, Kimball & Rock (2011) revealed that existing navigation methods which rely on internal sensors are not adequate to enable navigation with respect to free-floating icebergs. Presented in their paper (Kimball & Rock 2011) was an alternative approach that extended TRN techniques to deal explicitly with iceberg motion using sonar data.
In addition to the examples cited above, the British Columbia Environmental Fluid Mechanics group deployed a Gavia AUV in Pavilion Lake, British Columbia and Ellesmere Island, Nunavut in 2008. The selection of these sites was based on finding a location where a distinct delineation existed between first-year and multiyear ice. The Gavia AUV was equipped with a GeoSwathTM sonar unit, INS and RDI 1200 kHz DVL. For sub-surface
measurements, acoustic long baseline (LBL) or DVL have been used. This operation successfully demonstrated under-ice field trials in both lake-ice and sea-ice capability with a small AUV. Furthermore, it showed refinement of the integration of an INS/DVL system with a LBL system (Forrest et al. 2008).
12
2.2
External Sensors
2.2.1 Acoustic Transponders
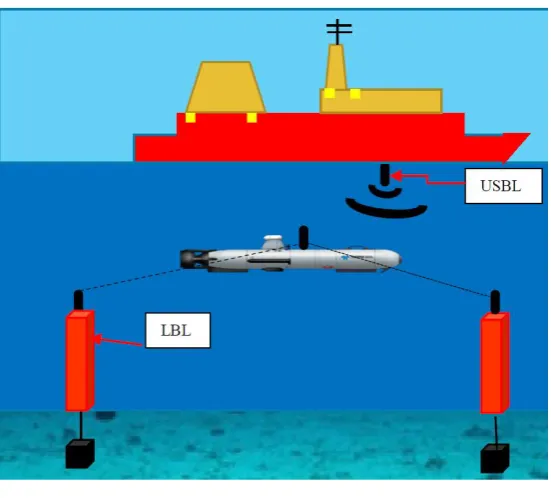
Acoustic transponders measure positions relative to a framework of baseline stations as shown in Figure 2-3, which must be deployed prior to operations. They are generally categorised into the following two types:
Long Baseline System (LBL); and
Ultra-Short Baseline System (USBL).
[image:29.595.162.438.266.515.2]Long Baseline (LBL) systems use a sea-flow baseline transponder network and derive the position with respect to the network. As per Figure 2-3, LBL transponders are typically mounted in the corners of the operation site. The position is generated from adding three or more time-of-flight ranges to the sea flow station using triangulation. However, due to the rapid attenuation of high-frequency sound in water, the LBL system typically has a very limited maximum range (Kinsey et al. 2006). On the other hand, Ultra-Short Baseline (USBL) systems rely on a surface transponder, as shown in Figure 2-3. USBL calculates subsea positions by calculating multiple distances, applying triangulations and phase differencing through an array of transceivers (Chen et al. 2013; Paull et al. 2014). This system does not require a
13 seafloor-mounted system as it uses the ship’s hull. The major disadvantage is that its positioning accuracy is dependent on the size of the baseline (Paull et al. 2014).
A few authors have discussed the acoustic transponder design and performance of AUV navigation systems for under-ice environments. In the mid-1980s, Vestgard suggested an under-ice Long Baseline (LBL) positioning system based on a combination of ice-moored and seafloor beacons (Vestgård 1985). This work additionally presented the methodology for a self-calibrating array of acoustic hydrophones and pingers affixed to moving ice-floes that was adapted for AUV monitoring (Jakuba et al. 2008). The most commonly used LBL navigation can be seen in vehicles such as Odyssey (Deffenbaugh et al. 1993). Similarly, Ultra-Short Base Line (USBL) systems were implemented on vehicles such as Remus (Kukulya et al. 2010). The advantage of the USBL is that it does not require a seafloor-mounted system. The major disadvantage is that its positioning accuracy is not as good as the LBL system.
In 2015, the real-time under-ice acoustic navigation system was introduced and the acoustic navigation beacons provided reliable acoustic range estimates and data transfer to an Autonomous Underwater Glider (AUG) through the water column out to 100 km with approximately 50% throughput (Webster et al. 2015). Several operational difficulties were faced during the field experiments such as coordinating acoustic transmissions and although the AUG residence in the sound channel should improve throughput, the data packet was not successfully decoded in the post-processing stage and there was a clock problem. Ensuring that these platforms consistently estimate their own geo-referenced position in real time with acceptable accuracy remains a challenge.
2.2.2 Side-Scan Sonar and Multi-Beam Sonar
14 resolution is inversely proportional to the range (Paull et al. 2014). Multi-beam sonars form separate beams with narrow azimuthal and wide elevation beam-widths using a phased array of transducers (Padial et al. 2014) Multi-beam sonars are capable of gathering echo sounding data more efficiently than single-beam sonars. Nevertheless, the image resolution is inversely proportional to frequency.
Side-scan sonar (SSS) imaging is a promising technique to overcome the challenge caused by the unavoidable growth of drift in vehicle position estimation in underwater vehicle navigation and localisation as it uses features in the environment that are naturally present in order to determine the location. Nevertheless, the particular challenge of under-ice sonar image based localisation can come from the unstructured nature of the terrain with largely low contrast and lack of features. Thus, extracting key features in such an environment is the major challenge. These detectors and descriptors work well in land and aerial complex environments, however they have reduced efficiency in featureless environments such as under ice. Consequently, AUV navigation in under-ice terrain is virtually impossible without advanced feature extracting algorithms and a combination of detectors and descriptors has to be used for under-ice environments.
15
2.3
State Estimators for Under-Ice Localisation and Mapping
2.3.1 Terrain Relative Navigation (TRN)
TRN uses real-time sensing and a terrain or landmark map to determine a vehicle position. TRN was initially developed for aerial platforms and first deployed as the cruise missile guidance system, i.e. TERCOM (Terrain Contour Matching), which performed batch correlation of altimeter measurements against a prior map to generate an estimation of current position (Golden 1980). TRN can eliminate the need for underwater vehicles to surface repeatedly for GPS fixes or work with pre-surveyed acoustic transponder arrays. Multiple research publications have addressed this problem by using prior available maps (Blackinton et al. 1983; Singh et al. 1995), where prior maps were not available but were constructed incrementally using sensor data, and where navigation was achieved by using altitude control and obstacle avoidance without explicit maps (Di Massa & Stewart Jr 1997).
Kimball & Rock (2011) proposed a new iceberg relative navigation technique for mapping and localisation. In the mapping process, the AUV circumnavigates an iceberg by collecting multi-beam sonar ranges to the iceberg’s submerged surface that are then combined in post-processing to form a self-consistent iceberg map. The post-processing operation uses terrain correlation at trajectory self-intersections to account for iceberg motion during data collection. In the localisation step the vehicle uses the iceberg map in an extended TRN-based localisation estimator to determine its position with respect to the iceberg. The localisation estimator has been augmented with states that enable it to account for iceberg motion between sonar measurements.
16 capturing a high number of sound points instantly and yielding rich information (Chen et al. 2015).
17 2.3.2 Simultaneous Localisation and Mapping (SLAM)
Simultaneous Localisation and Mapping (SLAM), sometimes called Concurrent Mapping and Localisation (CML), is a technique used by autonomous technologies to build up a map with an unknown environment or to update a map of a known environment. Over the last two decades, many research studies were carried out to solve the SLAM problem with various algorithms for land and surface vehicles. However, underwater SLAM has many more challenging issues compared to land SLAM, due to the unstructured nature of the underwater scenarios and difficulty in identifying reliable features.
SLAM can be performed online or offline. Where the current pose is estimated along with the map is called online SLAM (Paull et al. 2014). Most of the authors have developed filters in information form to address the online SLAM. The Bayesian filter is the fundamental filter derived other filters such as Particle filters, Kalman filters and Information filters. Extended Kalman Filter (EKF) is the most popular solution among the SLAM algorithm due to its simplicity. Most of the under-water navigation missions used offline SLAM due to difficulty in pre-processing. Roman et al. (Roman & Singh 2005) showed that the vehicle trajectory and map estimates are using offline SLAM. Furthermore, the estimation of ice-berg trajectory too was performed in 2015, using offline SLAM (Kimball & Rock 2015). There are two key advantages in the computation of an iceberg map offline as a post-processing over an online SLAM formulation. First, it affords the opportunity for a human operator to clean the mapping sonar data and provides input as to which sonar soundings overlap for terrain correlation. Second, it allows a large number of computationally intensive terrain correlation computations to be carried out in machines that are far more powerful than those available on an AUV (Kimball & Rock 2011).
18 Aerospace deployed ENDURANCE AUV, a redesign of the DEPTHX vehicle in West Lake Bonney in Antarctica (Stone Aerospace/PSC 2016).
One of the key challenges to implementing SLAM in a real underwater environment is the limited accuracy of the sensors, particularly for the environments with low light, strong ocean currents and turbid waters. Apart from that, filtering the noise in sonar images and extracting important features in the image are important tasks in SLAM (Guth et al. 2014). Extracting good features of the environment is a highly complex problem, especially when it comes to underwater environments. This problem is quite pronounced when dealing with flat terrain or a poor feature extraction environment. Many underwater features are scale dependent, i.e. sensitive to viewing angle and scale (Chen et al. 2013). The computational complexity of SLAM applications are closely related to the size of the environment to be explored and the methods used for feature extraction, tracking, data association and filtering (Guth et al. 2014).
19 due to tides and currents. Moreover, long linear features along the vehicle deployment path caused another problem in the image-based AUV localisation.
20
2.4
Summary
21
Chapter 3
Performance Comparison of Keypoint Detectors and
Descriptors
3.1
Introduction
Localisation is a crucial issue given the dynamic and unstructured characteristics of underwater environments and sensors with high resolution and accuracy are needed in order to determine the correct track of the vehicle. In image based navigation, features in the environment are compared with stored maps with features. Optical imaging devices such as monocular or stereo cameras and sonars are the sensors that are most used in image based navigation. Visual udometry is mainly achieved through optical flow or structure of motion (SFM). Moreover, side-scan sonar images can be interpreted in a similar manner as optical images, although these images have very unique properties such as the presence of acoustic shadow (Nadir), resolution and range-varying attenuation (Blondel 2010). However, due to the limitations of optical cameras in underwater environments such as inadequacy of light, susceptibility to scattering, reducing range and blurred images due to the vehicle movements they are not popular in AUV navigation (Paull et al. 2014; Burguera et al. 2015).
As discussed in Chapter 2 of this thesis, the use of side-scan sonar images is a more feasible method for identifying the position of an AUV as it uses natural features available in the environment. Therefore, sonar image based AUV localisation is a promising solution as it requires neither deploying sensors nor the calculation of distance travelled from a reference point in order to determine location. In recent years there has been increased research interest in sonar imaging based AUV localisation in academia as well as in the industry (Bandara et al. 2016; Li et al. 2017; Song et al. 2016). Therefore, localisation and recognition of objects based on local point features has become a broadly used methodology.
23
3.2
Detectors and Descriptors
Generally, many algorithms which come from computer vision depend on the determination of keypoints (interest points) in each image and calculating a feature description from the pixel region surrounding the keypoint. Terminology varies across the literature in feature detection and feature description. According to some discussions (Hassaballah et al. 2016; Krig 2014a), interest points are referred to as keypoints and the algorithms used to find the interest points are called detectors. Similarly, the algorithms used to describe the features are referred to as descriptors.
24 3.2.1 Speeded-Up Robust Features (SURF)
The SURF algorithm consists of a feature detector and a descriptor algorithm, which is inspired by the SIFT algorithm (Schmidt et al. 2013). It computes the Hessian matrix given in Eq. (3.1) as the output of the detector. The original authors of this method claim that the Hessian matrix yields better performance in terms of computation time and thus achieves fast detection of features (Bay et al. 2006). The Hessian matrix 𝐻(𝐱, 𝜎) of image I, given point of
𝐱 = (x, y) and scale 𝜎 is defined in Eq. (3.1):
,
,
,
, ,
xx xy
xy yy
L L
L L
H
x x
x
x x
(3.1)
where 𝐿 𝑥𝑥(𝐱, 𝜎), 𝐿𝑥𝑦(𝐱, 𝜎) and 𝐿𝑦𝑦(𝐱, 𝜎) are the convolution of the Gaussian second order derivative with image I in point x, point xy and point y respectively. The approximated Hessian determinant symbolises the blob response of the image point at 𝐱. A detailed description on SURF can be found at Bay et al. (2006).
25 3.2.2 Harris Detector
The Harris detector algorithm calculates a matrix in relation to the autocorrelation function of the image. The corresponding mathematical representation is given in Eq. (3.2) which results in two eigenvalues of the autocorrelation function from its major curvatures (Harris & Stephens 1988). If one eigenvalue is positive, that indicates an edge while a corner results in positive values for both eigenvalues. Harris points are invariant to the rotation but vary with scaling.
According to the authors (Harris & Stephens 1988), the sum of the squared difference (SSD) is used for calculating the autocorrelation function for corner detection 𝐸(𝑥, 𝑦) of an image. In image 𝐼 which has an image patch (𝑢, 𝑣) over the area and shifted it by (𝑥, 𝑦), which represents the difference in intensity for a displacement in all directions. Similarly,
𝑤 (𝑢, 𝑣) represents the window function and 𝐼(𝑥 + 𝑢, 𝑦 + 𝑣), 𝐼(𝑢, 𝑣)]2 represents the shifted intensities and intensities of the function respectively. A detailed description of the Harris detector can be found in Harris & Stephens (1988).
2,
,
, [ ( , ) , ]u v
E x y w u v I x u y v I u v (3.2)
3.2.3 Features from Accelerated Segment Test (FAST)
The Features from Accelerated Segment Test (FAST) algorithm is mainly a corner detector which is capable of extracting feature points as well. This algorithm is focused on determining a ‘corner’ and is dependent on 16 pixels which form a circle around the candidate point. If there are 12 contiguous pixels, all of which are brighter than or darker than the circle, the candidate point along with the threshold value is accepted as a keypoint. This is carried out by the segment test which is considers a circle of 16 pixels around the corner candidate𝑝. The original classifies 𝑝 as a corner sensor, if there is a set of n contiguous pixels in the circle, which are brighter than the intensity of candidate pixel 𝐼𝑝 plus a threshold 𝑡, or all darker
26 As the name suggests (although perhaps coincidental), this algorithm is significantly faster in comparison to all other feature extraction methods and is therefore becoming popular in robots and AUVs that have limited computing resources (Rosten & Drummond 2006). A detailed description of FAST is found in Rosten & Drummond (2006).
3.2.4 Binary Robust Invariant Scalable Keypoints (BRISK)
[image:43.595.176.447.102.259.2]The Binary Robust Invariant Scalable Keypoints (BRISK) algorithm is a fast feature detection, description and matching algorithm. The main reason behind its speed is a FAST-based scale-space novel detector. Keypoints are detected in octave layers of the scale-space pyramid as shown in Figure 3-2. The octaves are formed by progressively half sampling the original image. Each layer of the pyramid consists of 𝑛 layers, octaves of 𝐶𝑖 and intra-octaves of 𝑑𝑖 for 𝑖 = {0, 1, … … … 𝑛 − 1}, where n is normally considered as 4. This detector is associated with combining a bit-string descriptor for intensity comparing for its sampling pattern in the nearest keypoints (Leutenegger et al. 2011). As per its name, BRISK is capable of rotation as well as scale invariance to an important extent.
27 Figure 3-2. Scale-space keypoints detection of BRISK (Leutenegger et al. 2011) © [2011] IEEE
The BRISK descriptor uses a sampling pattern of neighbourhood of keypoints as illustrated in Figure 3-3. A detailed description of BRISK is given in Leutenegger et al. (2011).
[image:44.595.223.395.558.730.2]
28 3.2.5 Fast Retina Keypoints (FREAK)
The Fast Retina Keypoints (FREAK) algorithm is a binary feature descriptor algorithm inspired by the visual system of humans, which is indeed the retina. Retinal sampling pattern compares image intensities by a cascade of binary string and higher density of sampling points closer to the centre. After sampling, the binary FREAK descriptor is constructed from a one-bit series of Difference of Gaussians (DoG). The Saccadic search algorithm is performed subsequently to identify significant key features (Alahi et al. 2012). Finally, rotation keypoints available from each identified key feature are calculated using the calculation of local gradients over selected pairs. A detailed description of FREAK is available in Alahi et al. (2012).
29
3.3
Methodology
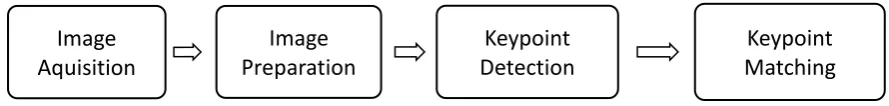
[image:46.595.71.516.236.289.2]In this study, MATLAB 8.5.0 software was used to process the images. Relevant tools that are available in the MATLAB computer vision system library were used to prepare images, and detect and match keypoints. As shown in Figure 3-4, the image processing has four major steps, namely: (1) image acquisition, (2) image preparation, (3) keypoint detection and (4) keypoint matching. These steps are discussed in detail in the following sub-sections.
Figure 3-4. Major steps in image processing
3.3.1 Image Acquisition
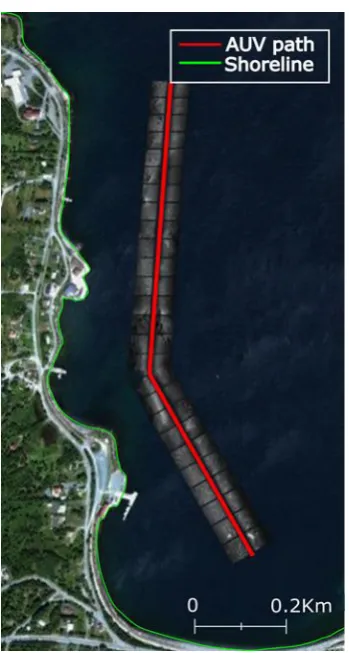
The AUV Explorer deployed at Holyrood Arm, Newfoundland and Labrador, Canada in 2014 was used to acquire images. The AUV was operated in a constant altitude mode of 7 m from the bottom and maintained a constant speed of 1.5 m/s. A map of the surveyed area is shown in Figure 3-5, which is relatively flat containing sand, mud with some exposed rocks (<1 m in height) and source marks from anchors. The raw data were obtained from the AUV’s integrated EdgeTech 2200M side-scan sonar in the native ‘JSF’ format. The sonar was mounted in the forward hull along the longitudinal axis of the AUV and operating with the data collected at 400 kHz.
The collected sonar data consist of a series of records, called ‘pings’. There are 1001 pings in each tile and each tile represents 44 m of travel path along a 1 km line (King et al. 2012). The obtained raw data were processed as shown in Figure 3-6 to generate image files. These data were converted into a single coordinate system with respect to the vehicle’s viewpoint (vehicle heading and speed) which is placed in a global coordinate system relative to true north. These adjustments mean that the path and reference images are always oriented north up (King et al. 2012). A complete description of raw image generation is found in previously conducted work (King et al. 2012). The vehicle’s pitch and roll are assumed to
Image Aquisition
Image Preparation
Keypoint Detection
30 be constant as the Explorer AUV has six large control planes and can change its depth with negligible variation in its pitch and roll while undergoing straight line motions. Previous work conducted using the AUV Explorer has also shown that vehicle’s pitch and roll to have negligible impact on the data quality (King et al. 2012).
[image:47.595.225.400.198.525.2]
Figure 3-5. Survey terrain in Holyrood Arm, Newfoundland and Labrador, Canada (47.388N, 53.1335W) (King et al. 2014)
Figure 3-6. Data flow of sonar image capture
AUV (Sonar) Sonar Files Sonar Data
[image:47.595.101.547.635.689.2]31 An additional survey was carried out in the same area at different time periods on the following day in order to obtain sonar images with variations compared to the images taken on the first day. The surveyed area consists of a wide range of bottom terrain scenarios such as clutter, mud, sand, stones and lack of features; and sonar imaging effects such as scaling, rotation, non-uniform intensity (difference in brightness) and backscatter. The difference in brightness was caused by the sonar beam pattern along with the ever-changing attitude of the tow-fish which create difference seabed images. During the deployment of the AUV, the side-scan sonar simultaneously acquired seabed images, and the acoustic received level in addition to imagery data from the sonar were able to be converted to estimate the backscattering strength of the seabed. Furthermore, a large-range side-scan sonar system is able to generate ‘acoustic brightness’ images of seabed swaths using the acoustic energy returned from the seabed (Chang et al. 2010). The 20 images obtained in this survey are grouped into 10 sets, representing 10 selected locations of survey a day apart and covering a variety of terrain scenarios and image effects as shown in Table 3-1. For example, Images 7 and 8 in Data Set 4 have rotation, scale, difference in brightness, fewer stones on the surface and images are not in the same area. Similarly, Images 9 and 10 in Data Set 5 have rotation, scale and more stones on the surface compared to Data Set 4. Amidst having these variations, the majority of the features found in the images obtained on Day 1 should match with the corresponding features in the images taken on Day 2 as they are taken from the same course of the AUV.
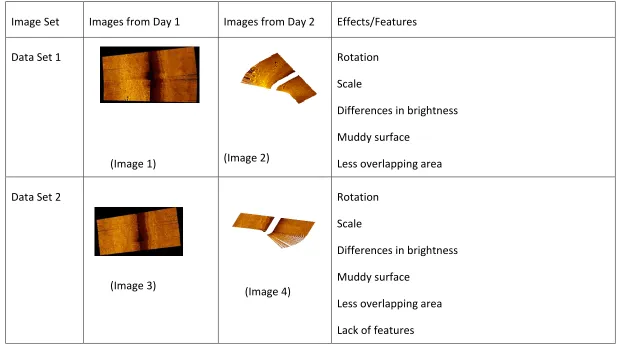
32 Table 3-1. Image data sets
Image Set Images from Day 1 Images from Day 2 Effects/Features
Data Set 1
(Image 1) (Image 2)
Rotation Scale
Differences in brightness Muddy surface
Less overlapping area
Data Set 2
(Image 3) (Image 4)
Rotation Scale
Differences in brightness Muddy surface
33 Data Set 3
(Image 5) (Image 6)
Rotation Scale
Differences in brightness
Muddy surface with stones or sand Less overlapping area
Data Set 4
(Image 7) (Image 8)
Rotation Scale
Differences in brightness
Muddy surface with stones or sand Not in the same area
Data Set 5
(Image 9) (Image 10)
Rotation Scale
34 Data Set 6
(Image 11) (Image 12)
Rotation Scale
Differences in brightness
Muddy surface with stones or sand More overlapping area
Data Set 7
(Image 13) (Image 14)
Scale Tilt Clutter
Muddy surface with stones or sand More overlapping area
Data Set 8
(Image 15) (Image 16)
Scale
35 Data Set 9
(Image 17) (Image 18)
Scale
Mud surface with stones or sand More overlapping area
Data Set 10
(Image 19) (Image 20)
Scale Distortions Clutter
36 In addition to the image sets shown in Table 3-1, another four image sets are created by combining some of the images from Table 3-1 to analyse the effects of scale and changes in the difference of brightness conditions in the environment which is not available in Table 3-1. The corresponding image sets are given in Table 3-2.
Table 3-2. Creation of data sets
Images from Day 1 Images from Day 2 Effects/Features
Data Set 11
(Image 21) (Image 22)
Scale
Differences in brightness Muddy surface with stones or sand
Less overlapping area
Data Set 12
(Image 23) (Image 24)
Slightly different in scale Muddy surface with stones or sand
Less overlapping area
Data Set 13
(Image 25) (Image 26)
Rotation Scale
Differences in brightness Muddy surface with stones or sand
Less overlapping area
Data Set 14
(Image 27) (Image 28)
37 3.3.2 Image Preparation
The acquired images have different features and characteristics such as sand surface, mud surface with sand, mud surface with sand and stones, noise and blur. Therefore, to create uniformity across all the images, they need to be passed through a preparation stage which is divided into four sub-stages, namely: 1) resizing, 2) filtering, 3) contrast enhancement and 4) morphologic filtering. The effects of these stages are illustrated in Figure 3-2 taking Image 15 of Data Set 8 as an example. As shown in Figure 3-7(a), the sonar images acquired by the sensors are 732 x 299 pixels in size. When the acquired image is not the above-mentioned size, the image is resized to 732 x 299 pixel size.
These images are then passed through a Wiener filter to remove any noise generated by electronic or mechanical systems inside the sonar as shown in Figure 3-7(b) (Wiener 1949). Generally, median filters, average filters, Gaussian filters and Wiener filters are used for image enhancement in image processing. Furthermore, non-linear median filters are commonly known for removing ‘salt and paper’ noise. In the same way, average filters or median filters are simple filters that are good for noise removal although they present problems of blurring in the image (Arya and Semwal, 2017). Gaussian filters are known for blurring and suppressing the image. Therefore, the main reason for selecting the Wiener filter for this process is due to its inherent capability of minimising the mean square error in the process of smoothing the noise and inverse filtering. Furthermore, according to the literature, the Wiener filter is capable of holding a high Peak Signal to Noise Ratio (PSNR) value which indicates that the image holds high qualify even after de-noising (Williams et al. 2016).
39
(a) (a) (b)
[image:56.595.67.550.83.410.2](c) (d)
40 3.3.3 Keypoint Detection
As depicted in Figure 3-3, keypoint detection is the third step of the image processing workflow. At this stage, the pre-processed image is passed through the detection algorithm in order to extract keypoints. The algorithm identifies regions of the image that have unique content, such as corners or blobs (image pattern of region which are different from their surrounding intensities), depending upon the algorithm used. The important factor in the determination of the keypoint is to find key features that remain locally invariant so that it is possible to detect these key features even in the presence of rotation or scale change. Depending on the image, the algorithm used and threshold values set in the algorithm, the number of keypoints detected can be as high as 1000 in feature-rich images, which may load the processor heavily in the next stage.
On the other hand, images that lack features may result in zero or a very low number of keypoints. In both cases, the variable used for a given algorithm is the detection threshold. For feature-rich images the threshold can be raised to extract only the prominent keypoints. The obvious disadvantage is the loss of important points that may work well in subsequent stages. Similarly, for lack of features with low-contrast images, the threshold can be lowered to extract more keypoints. The drawback of lowering the threshold is the possibility of false detection. Therefore, choosing the right threshold is important in order to achieve fast and robust matching of features in sonar images (Gonzalez & Woods 2002).
41 3.3.4 Keypoint Matching
The last step of sonar image processing is the feature matching where the detected features are compared against the features in the images stored in a matrix form described in section 3.3.3. In practical implementations, this comparison should be carried out against all the images recorded for the particular area of interest. Nevertheless, as mentioned in section 3.3.1, 14 image sets, each having two images, taken a day apart and of the same area, are chosen for comparison in this study. Therefore, features of the two images in a set should match with each other.
In order to match keypoints detected in one image with those in the other image there should be a unique description for each point. The algorithms developed that generate such descriptions are called ‘descriptors’. The feature descriptors are mainly categorised as Local Binary descriptors, Spectra descriptors and basic space descriptors (Krig, 2014b). In this study, SURF, BRISK and FREAK descriptors were used. The feature descriptor of SURF is based on the sum of the ‘Haar’ wavelet response within the neighbourhood area of a keypoint (Bay et al., 2006). This descriptor basically belongs to the category of Spectra descriptor that is capable of computing light intensities, colour, local area gradients and local area static features. On the other hand, BRISK and FREAK belong to the category of local descriptors that are efficient and competent in computing, storing, and matching features (Krig, 2014b). The BRISK descriptor compares the binary outcome pattern of keypoints as discussed in Section 3.2.4 (Leutenegger et al., 2011). Furthermore, FREAK is a binary descriptor that operates on a cascade of binary strings while calculating the image intensities that end on over retina sampling pattern (Alahi et al., 2012). However, Harris and FAST are feature detectors and not performing as a feature descriptor. Nevertheless, FAST determines the ‘corner’ after comparing all the pixels in a circular pattern against the central pixel using a threshold value. Therefore, the resulting descriptor is stored as a contiguous bit vector in order of 1-16 in a rotational-invariant representation pattern (Krig, 2014b).
42 value. This threshold value can be adopted in different regions of feature space. Therefore, to maintain the unique threshold value for all image data sets, the distance match of the nearest neighbour is used.
43
3.4
Results and Discussion
3.4.1 Keypoint Detection
As discussed in Section 3.3, keypoints have been detected from all the pre-processed Data Set images using SURF, Harris, FAST and BRISK detectors. Figure 3-8 shows the example of the above-mentioned keypoint detection for SURF and FAST algorithms on Image 15 of Data Set 8 (first-day image).
[image:60.595.83.497.288.421.2](a) (b)
Figure 3-8. Keypoints detected in Data Set 8 (Image 15) with the (a) SURF algorithm; (b) FAST algorithm
44 Table 3-3. Number of keypoints detected by each algorithm
Image Data
Set
Image
No. Day SURF Harris FAST BRISK
Without filter With filter Retain (%) Without filter With filter Retain (%) Without filter With filter Retain (%) Without filter With filter Retain (%)
1 1 1 252 107 42 731 280 38 592 228 39 278 121 44
2 2 278 222 80 500 394 79 687 522 76 323 264 82
2 3 1 255 135 53 541 362 67 398 222 56 165 105 64
4 2 364 282 77 872 794 91 900 719 80 265 206 78
3 5 1 472 260 55 1061 657 62 938 430 46 326 192 59
6 2 203 147 72 257 186 72 258 162 63 151 121 80
4 7 1 222 167 75 561 317 57 247 107 43 143 99 69
8 2 169 106 63 302 224 74 284 191 67 161 132 82
5 9 1 148 101 68 233 141 61 212 122 58 147 114 78
10 2 214 148 69 400 343 86 327 235 72 160 151 94
6 11 1 193 124 64 264 178 67 367 211 57 164 101 62
12 2 377 282 75 701 502 72 959 607 63 361 263 73
7 13 1 649 393 61 1002 441 44 995 342 34 558 275 49
14 2 600 411 69 1021 567 56 1031 463 45 558 328 59
8 15 1 438 259 59 545 225 41 658 248 38 330 199 60
16 2 466 267 57 736 342 46 833 315 38 424 223 53
9 17 1 110 66 60 127 90 71 171 103 60 115 94 82
18 2 204 150 74 306 220 72 249 166 67 157 131 83
10 19 1 460 315 68 665 323 49 623 232 37 331 188 57
45 Figure 3-9. Retain percentage of the number of key points
As shown in Table 3-4, the Harris algorithm detects more keypoints followed by the FAST algorithm, which failed to perform in keypoint matching after analysing both tables. The results in Table 3-3 further indicate that SURF is more on the lower side in keypoint detection while BRISK produces the lowest number of keypoints in most of the cases. Although SURF detects fewer keypoints than Harris and FAST, it is able to maintain the highest number of matches. Furthermore, SURF is able to perform better than FAST in Data Sets 7, 8 and 10 due to the cluttering of feature patterns in images.
When two images are taken for matching, the maximum possible number of matches is decided by the lower number of keypoints detected in one of the two images. For example, the SURF algorithm detects 259 and 267 keypoints in Image 15 and Image 16 respectively. The maximum possible number of matches between the two images is 259. Similarly, for each image set, the lower number is taken as the maximum possible number of matches and the corresponding listing is shown in Table 3-4. The same table shows the number of matches and the matching percentage for each set and each algorithm. For example, although the image Data Set 8 has the possibility of having 259 matches, the actual number of matches is 37 which is equal to 14.3% matching. The corresponding matches are shown in Figure 3-10.
0 10 20 30 40 50 60 70 80 90 100
1 2 3 4 5 6 7 8 9 10 11 12 13 14 15 16 17 18 19 20
Ret ain p erce n tage (% )
Data Set number
47 Table 3-4. Maximum possible number of keypoint matches and actual number of matches for each algorithm
Ima ge Dat a Set
SURF Harris FAST BRISK FREAK
Keypo ints Matc hing Percen tage (%) Keypo ints Matc hing Percen tage (%) Keypo ints Matc hing Percen tage (%) Keypo ints Matc hing Percen tage (%) Keypo ints Matc hing Percen tage (%)
1 107 0 0 280 0 0 228 0 0 121 0 0 121 0 0
2 135 0 0 362 0 0 222 0 0 105 0 0 105 0 0
3 147 0 0 186 0 0 162 0 0 121 0 0 121 0 0
4 106 0 0 224 0 0 107 0 0 99 0 0 99 0 0
5 101 5 4.95 141 1 0.71 122 3 2.46 114 0 0 114 2 1.75
6 124 2 1.61 178 0 0 211 1 0.47 101 0 0 101 0 0
7 393 28 7.12 441 1 0.23 342 7 2.05 275 4 1.45 275 3 1.09
8 259 37 14.3 225 6 2.67 248 7 2.82 199 8 4.02 199 5 2.51
9 66 16 24.2 90 3 3.33 103 3 2.91 94 7 7.45 94 3 3.19
48 The number of actual matches and the mapping percentage achieved by each algorithm for different image Data Sets are plotted in Figures 3-11 and 3-12 respectively. As visible to the naked eye, image Data Sets 1–4 and 11–13 do not have matching features, which are confirmed by the results shown in Figure 3-11. Similarly, amidst rotations and scaling, the image Data Sets 5–10 can be seen as matching sets for naked eye with clearly distinguishable features. This is confirmed by the results having a varied number of matches produced by each method. The results in Figure 3-11 further reveal that the SURF algorithm performs well in all the cases, producing the highest number of matches. Figure 3-12 further consolidates the performance of SURF over other methods by plotting the matching percentage.
0 10 20 30 40
1 2 3 4 5 6 7 8 9 10 11 12 13
Tr u e M atc h e s Data Set
Matching all true positive keypoints
SURF Harris FAST BRISK FREAK
0 5 10 15 20 25 30
1 2 3 4 5 6 7 8 9 10 11 12 13
Perc e n ta ge o f Ke yp o in t d etec ti o n a n d map p in g % Data Sets
Number of keypoint matching and detection ratio
[image:65.595.68.515.306.483.2]SURF Harris FAST BRISK FREAK
[image:65.595.72.515.547.741.2]Figure 3-12. Number of keypoints matching percentage
49 After comparing both Data Sets 5 and 6 in Figures 3-11 and 3-12, Data Set 5 is able to keep a higher number of keypoints matching for the SURF descriptor due to rotation and scale without distortion image. These two data sets have fewer sparse arrangement features. Moreover, the FAST detector performs in similar way to SURF. However, Harris and FREAK are unable to perform a single matching in Data Set 6 due to brightness as these algorithms fail to work in the discipline of brightness. Furthermore, BRISK is sensitive to image rotation and fails to work in all rotated images.
Further analysis of Figures 3-11 and 3-12, corresponding to the results of Data Sets 7– 10, reveals not only the presence of features but also the distribution pattern of features affect the matching process. As can be seen by the naked eye, the images of Data Sets 7, 8 and 10 contain more features compared to Data Set 9. Nevertheless, they are cluttered features which can be described as a number of features appearing in a sonar image, where these features are quantified in terms of locally similar features covered untidily at some places in the images as illustrated in Data Sets 7, 8 and 10 in Table 3-1. In contrast, Data Set 9 contains sparse features which are spread throughout the entire image. The effect of clutter and distribution of features is clearly visible in Figure 3-12 where cluttered images produce a relatively lower percentage of matching compared to the high percentage of matching with distributed features. This observation is valid for all the algorithms compared. Nevertheless, SURF performs well in all the cases even with rotation, scale and differences in brightness. FAST and FREAK work well against rotation compared to Harris and BRISK. Harris is the least effective performer for images with rotation.
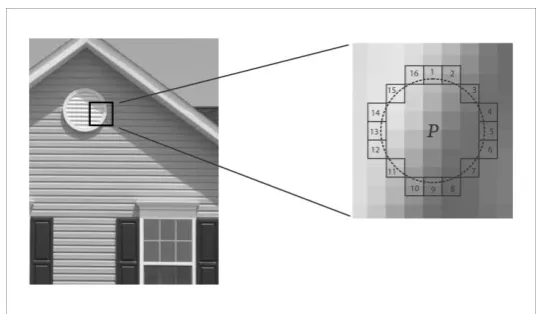
![Figure 3-3. Sampling Pattern of BRISK descriptor (Leutenegger et al. 2011) © [2011] IEEE](https://thumb-us.123doks.com/thumbv2/123dok_us/8401131.325638/44.595.168.422.109.388/figure-sampling-pattern-of-brisk-descriptor-leutenegger-ieee.webp)