Rochester Institute of Technology
RIT Scholar Works
Theses
Thesis/Dissertation Collections
2004
Goal Directed Visual Search Based on Color Cues:
Co-operative Effectes of Top-Down & Bottom-Up
Visual Attention
Vishal S. Vaingankar
Follow this and additional works at:
http://scholarworks.rit.edu/theses
This Thesis is brought to you for free and open access by the Thesis/Dissertation Collections at RIT Scholar Works. It has been accepted for inclusion
in Theses by an authorized administrator of RIT Scholar Works. For more information, please contact
Recommended Citation
Goal Directed Visual Search Based on Color Cues:
Co-operative Effects of Top-Down & Bottom-Up Visual Attention
Thesis report submitted in partial fulfillment of the requirements of the degree
Master of Science in Computer Science
May 2004
Vishal S. Vaingankar
Advisor: Dr. Roger S. Gaborski
Reader: Dr. Roxanne L. Canosa
Name of
author:
V Is H.
A:~
\j
1\.1 N
(
t"\
{oj!C-A~
Degree
:
[V'1@".f ...
b
SC
~U1
CL
Program
:
WVY'\'P~
y
SC'X-l"I.cc.
College
:
fu ti~qM
(
0'
U!2ee
f=(j
Cc
IM
puh'
iU-
j
Ov~
1M
frc
'
YV
\.
cJ\'
M
S(
;
{:
J
1a?
L3
I understand that I must submit a print cop
y
of
my
thesis or dissertation
to the RIT
Archives,
per
current
RIT
guidelines
for the
completion of
my degree.
I hereb
y
grant to
the Rochester Institute
of
Technology
and
its
agents
the non-exclusive license to
archive and
make
accessible
my
thesis or
dissertation in w
hole
or
in part in
all
fonns
of
media in perpetuity. I
retain all other ownership
rights
to
the copyright of the
thesis
or
dissertation. I
also
retain the right to use
in future works
(such
as
article
s or
books) all
or
part
of
this thesis
or
dissertation.
Print Reproduction Permission Granted:
I,
\J
f>
~
V
{u.
!
~ ~
n
t-o.
,y
,
hereby grant permission
to
the Rochester Institute
Technology to reproduce my print thesis
or
dissertati
on in
whole or
in part.
Any
reproduction
will
not be
for
commercial
use
or
profit.
Signature
of
Author
:
Date
:
>/
I:?
k
4:
Print Reproduction Permission Denied:
I,
, hereby deny permission to the RIT Library
of
the
Rochester Institute
of
Technology to reproduce my print thesis
or
dissertation in
w
hole
or in
part.
Acknowledgements
I
wouldlike
to thank
allthe
people whohave
supported methrough
my
master's education.A
special
thanks to
Dr. Roger Gaborski
for providing
me guidance and supportduring
the thesis
process,
andDr. Roxanne Canosa for her
significant contribution withthis thesis
work.I
wouldlike
to thank
Dr.
Gaborski,
my
mentor,
for
inspiring
me withhis insightful
andrefreshing
approach
to
conducting
research.I
wouldlike
to thank
Dr. Canosa for
training
meto
usethe
eye-tracker
andproviding
me withthe
eye-tracking
software.Her
patience and constant guidancehelped
me conductthe
experiments with utmost ease.In
additionI
mustthank
Dr.
Ankur
Teredesai
for
allthe
co-authoredpapers,
andfor
guiding
methrough technical
writing
skillsduring
the
paperwriting
process.Thanks
to
Dr. Jeff
Pelz,
Center
for
Imaging
Science,
RIT
for
granting
methe
accessto the
eye-tracker equipmentin
the
Visual Perception Lab. Also I
appreciate
the
support ofmy
comradesfrom
the
computer vision anddata
mining group
in
the
Abstract
Focus
ofAttention
plays animportant
rolein
perception ofthe
visual environment.Certain
objects stand outin
the
sceneirrespective
ofobservers'
goals.
This form
of attentioncapture,
in
which stimulusfeature saliency
capturesourattention,
is
ofabottom-up
nature.Often
priorknowledge
about objects and scenes caninfluence
our attention.This
form
of attentioncapture,
whichis influenced
by
higher level knowledge
aboutthe objects,
is
calledtop-down
attention.Top-down
attention acts as afeedback
mechanismfor
the
feed-forward
bottom-up
attention.Visual
searchis
a result of a combined effort ofthe top-down
(cognitive cue)
system andbottom-up
(low
level
feature
saliency)
system.In my
thesis
I investigate
the
process of goaldirected
visual searchbased
on colorcue,
which
is
aprocess ofsearching for
objects of a certain color.The
computational model generatessaliency
mapsthat
predictthe
locations
ofinterest
during
a visual search.Comparison between
the
model-generatedsaliency
maps andthe
results of psychophysicalhuman
eye -trackingTable
of
Contents
Acknowledgements
Abstract
List
ofFigures
1 Introduction
1
1.1 Focus
ofattention andVisual Search
1
1
.2Problem definition
2
1
.3Thesis
outline2
2 Background
4
2.1 Human Visual System
4
2.2 Computational modeling
of neuron properties6
2.3 Eye
movementsin Visual
search8
2.4 Focus
ofAttention
10
2.5 Visual Search
13
2.6 Interaction
between
bottom-up
andtop-down
attention16
3 Computational Model
18
3.1
Physiologically
inspired kernels
18
3.2 Computational modeling
21
3.2. 1
Bottom-up
attention21
3.2.2 Top-down
attention27
3.2.3 Attention map
30
4
Eye-Tracking
Psychophysical Experiments
32
4. 1
Introduction
32
4.2
Eye-tracker
& Procedure
33
4.3 Experiment
Design
35
4.4
Visual
Scanpaths
36
5 Results
Analysis
40
5.1 Eye Movement
andSaliency Map
Correlation
40
5.1.1 Effects
oftarget
anddistractor
prototypecolors41
5.1.2 Effects
oftop-down
andbottom-up
attention45
6 Conclusion
andFuture
work50
7 References
54
Appendix
57
List
of
figures
Figure 2. 1 Diagram
ofthe
human brain emphasizing
the
visual cortex area.Figure 2.2 Contrast
Sensitivity
Function
Figure 2.3 Simple
cellactivity for
slit ofdifferent
arrangementsin
the
cell receptivefield.
Figure 2.4 Complex
cellactivity for
slit ofdifferent
arrangementsin
the
cell receptivefield.
Figure 2.5
searchfor "inverted
S"in
a searchimage containing "S".
Figure 3.1 Center Surround Difference
ofGaussian filters
(a)
On-center/Off-surround filter.
(b)
Off-center/On-surround filter.
Figure 3.2 Sine Gabor
orientationfilters. (Bar detection
filters)
Figure
3.3 Color
opponent cells(a)
Red-center/Green-surround
(b)
Green-center/Red- surround(c)
Blue-center/Yellow-surround
(d)
Yellow-center/Blue-surround
Figure 3.4
Block
diagram
ofthesystem.Figure
3.5
(a)
Input
image, (b)
intensity
contrastimage, (c-d)
Color
opponent maps(e-h)
Orientation
mapsFigure
3.6 Summation
ofthe
feature
salience mapsto
generatethe
bottom-up
saliencemap
Figure
3.7
Original
image
andbottom-up
saliency
maps over multipleiterations
of convolution withDifference
ofGaussian filters
Figure
3.8 Color
saliency
response curvefor
theprototype cue colors.Figure 3.9 Top-down
saliencemap for
redas search colorFigure 3.10
Saliency
response curvefor
orangeFigure 3.11
Summation
ofBottom-up
andTop-down
saliencemap
Figure 4.1
Figure 4.1: ASL
model501
eye-trackerFigure 4.2 Subject
with anASL 501 head
mountedeyetracking
gearduring
an experimentFigure 4.4 Search
task
scanpathsduring
searchfor
red objects.Figure 4.5
(a,b)
free
viewscanpathsfor
two
subjects.(c,d)
search scanpathsfor
search ofblue
colorin
the
laboratory
scene.Figure 5.1 Graphs showing
the
effectsoftarget
anddistractor
prototypecolorduring
searchfor
blue
colorin bookshelf image.
Figure 5.2 Graphs showing
the
effectsoftarget
anddistractor
prototype colorduring
searchfor
red colorin
computer generatedimage.
Figure 5.3
:Subject TrC's
search scanpath overlaid onthe
(b)
Bottom-up
saliency
map
(c)
top-down saliency map
(d)
Final
attentionmap for
the
(a)
input image
with searchfor
red objects.Figure 5.4 Graphs showing
effects oftop-down
andbottom-up
attention onindoor
sceneimage.
Chapter 1: Introduction
1.1 Focus
ofAttention
andVisual Search
Why
do
the
red and yellow street signs stand outin
ourfield
of view when we aredriving? We
generally pay
attentionto
only
the
important
objects whiledriving,
such aspedestrians,
oncoming
traffic,
street signs etc. andgenerally ignore
the
non-importantobjects such as stoneslying
onthe
road side.Humans
observetheir
surroundingsby
focusing
onthe
interesting
aspectsand
ignoring
the
non-interesting
ones.We
achievethis
by
making
rapid(saccadic)
eyemovements
that
guidethe
fovea
(region
of maximalacuity in
the
retina)
to the
region ofinterest.
Thus
focus
of attention acts as agating
mechanismto the
higher level
visual processes such asobject
recognition,
categorization etc.The
filtering
theory
of attention(Broadbent, 1958)
statedthe
needfor
attentionfor
processing
requiredinformation
andignoring
the
rest.Focus
ofattention can
be
classifiedinto
two types:
Bottom-Up
andTop-Down
focus
of attention.An
example of
bottom-up
focus
of attentionis
abright light in
adark
room,
whichtends to
standoutdue
to
its
contrast withthe
surrounding
darkness. A
red patch on a green area stands outby
virtue of
its
color contrast.Objects
that
pop-outsolely based
ontheir
stimulusfeatures saliency
or
low-level
(intensity
contrast,
colorcontrast)
feature
conspicuity
capture attentionin
abottom-up
manner alsoknown
as exogenous control of attention.Another
kind
of attention calledtop-down attention(endogenous control)
guides attentionbased
on subject's
intentions
and expectations.An
instance
of endogenous controlis
evidentduring
visual search.
In
visual searchthe
priorknowledge
aboutthe target
object'sfeatures
guidesthe
attention.
Thus
visual searchis
a mechanism ofsearching
for
an objectbased
onthe
previousknowledge
aboutits
features
such asshape, color,
motion etc.Often
during
visualsearch,
ourattention
involuntarily
is
directed
to
some taskirrelevant
conspicuousobjects,
such as abright
object,
regardless ofthe
searchfor
the
cuedobject.Objects
that
share similar characteristics withthe
cued object alsoinfluence
our attention.An
example ofthis
is searching for
a personwearing
a red shirt
in
a crowd.Attention
is
diverted
to
objects similarin
colorto red,
such as redhat,
redtie
etc.Visual
search canbe
saidto
be
a combined effort ofthe top-down
(cognitive
cue)
andStudies
of eye movementsduring
perception ofthe
environment canlead
usto
important
information regarding
strategies usedfor observing
the
environment.The
eye-movements of a subjectduring
a psychophysical experimentis
an externalindication
ofthe
subject's selective visual attention.A
sequence of eye-movements canbe
an efficientindicator
ofthe
strategies usedby
a subject.These
sequences of eye-movements(scan-paths)
aredifferent
for different
scenes.
Analysis
ofthe
scan-paths can resultin
interesting
theories
regarding
sceneinterpretations.
1.2 Problem definition
In my
thesis
I
amproposing
a computational model of color visual search.The developed
framework highlights
the
interaction between
bottom-up
andtop-down
focus
of attention mechanism.Bottom-up
attentionis
computationally
modeledusing
bottom-up
saliency
mechanism
(topographic saliency maps)
andtop-down
attentionis
modeledusing
a neural networktrained
ontarget
color.The
visual spaceis
representedin
the
form
of asaliency
map
that
topographically
codesthe
spatiallocations based
onfeature
saliency.A
bottom-up
saliency
map
representssaliency
of stimulusfeatures
based
onlow-level
feature
competition.A
top-down
saliency map
representssaliency
ofthe
samelocations based
their
relevanceto
thecurrenttaskathand.
The
goal ofthe thesis
is
to
showthe
relativeinfluence
ofthe two
attention systems on visual search.To
provethe
plausibility
ofthe model, the
analysis phase will show a comparativestudy
ofthe
model predictions andeye-tracking
generated observations.This
willhighlight how
wellthe
computationally
predicted spatiallocations
correlate withthe
eye-tracking fixation
data
collectedusing
human
subjects.1.3 Thesis
outlinecomputational models on
bottom-up
focus
of attention and color visual searchis
provided,
whichhave inspired
meto
approachthis
problemfrom
adifferent
perspective.A
description
of some ofthe
mostinfluential
computational models willlay
the
ground workfor explaining
my
contribution
in
chapter3.
Chapter 3
willhighlight
the
computationalmodeling
of visual searchbased
onthe two
attentionsystems.
The
chapterprovides a modeldiagram
highlighting
the
various stepsin
the
model.The
chapter shows examples of
the
resulting
bottom-up,
top-down
andthe
final
attention maps.Chapter
4 discusses
the
human
eyetracking
experiments conductedto
provide apsychophysicalevidence
for
the
proposed computational model.An Applied
Science
Laboratory
eyetracker
is
used
to
monitoreye movements of subjectsduring
scene perception.This
chapter willprovide adetailed
description
ofthe
experimental methods and procedure carried outto
conductthe
experiments.
A brief
introduction
ofthe
eyetracking
equipmentis
provided.Chapter 5
describes
the
results ofthe
analysis conductedto
correlatethe
saliency map
and eyetracking
data.
A
correlation measurebetween
the
computationally
generated attention maps andthe
human eye-tracking
data
will provide a comparative analysis.Graphs
willquantify
the
relative
influence
ofthe
two
attentionsystems on visual search.Chapter
2: Background
2.1 Human Visual System
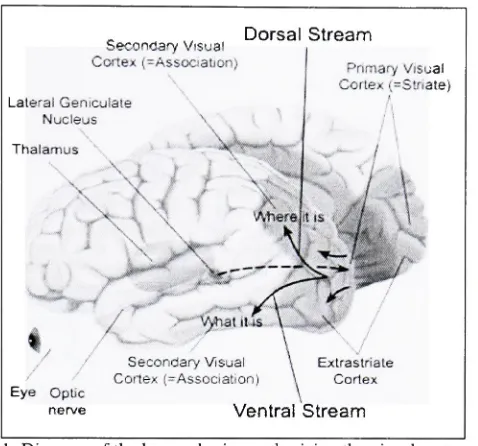
Secondary
Visual Cortex(^Association)Dorsal Stream
LateralGeniculate Nucleus Thalamus
Primary
Visual Cortex(=Striate)
Eye Optic nerve
SecondaryVisual Cortex(-Association)
[image:13.533.115.354.122.345.2]\
Ventral Stream
Figure 2.1: Diagram
ofthehuman brain emphasizing
thevisual cortex area.(Adapted from
http://www.colorado.edu/epob/)
The
visualinformation entering
the
eye passesthrough
several visual areasbefore any
senseis
made about
the
semantics or objects presentin
the
scene.This
visualinformation
undergoestransformations
in
apathway
calledthe
visual pathway.Figure 2.1
showsthe
regions ofthe
human
brain
relatedto
visual perception.The
visualpathway
starts atthe
retina andextends allthe
way
to the
higher
visual cortical areas.Light entering
the
eyes exciteslight
absorbing
photoreceptors on
the
retina.Photoreceptors
are oftwo types:
rods and cones(Brindley,
1970).
Cones
are responsiblefor
color vision andhigh
visual acuity.Rods
are usedduring
low-level
illumination
such asin
the
dark.
Cones
ofthree types
have been
identified,
short,
medium andlong
wavelength receptors.Light
entering
the
eye onits
ownis
notcolored,
ratherthe
photoreceptors
that
absorbthe
light
of various wavelengthshelp
in
color perception.Short
wavelengthcones absorb
light
ofwavelengthsthat
have low
wavelength onthe
visiblespectrum.Similarly
the
medium andlong
cones absorb medium andlong
wavelengths onthe
spectrumrespectively.
Combination
ofthe three
photoreceptors produces a myriad of color perception(Palmer,
1999).
The
input from
these
photoreceptorsfeeds into
the
retinal ganglion cells alsoRetinal
ganglion cells withtheir
center-surround organization of concentric receptivefields,
receive
inputs form
the
receptors.The
center-surround nature of neuronal receptivefield
canbe
seen at multiple
layers in
the
visual cortex.Receptive
field is
aterm
for
cellssensory
patternwhich receives
impulses from
a set of retinal receptorsin
anexcitatory
andinhibitory
fashion.
During
firing
of aneuron,
light is focused
onthe
receptors which produces arise in
the activity,
these
receptorsform
the
excitatory
part ofthe
neuron's receptivefield.
Similarly
light
focused
onreceptors
that
produce a reductionin activity
ofthe
neuron understudy,
form
the
inhibitory
part ofthe
neuron's receptivefield. This mapping
ofthe
excitatory
andinhibitory
receptorsforms
a receptivefield
of a neuron.Cells
with on-center/off-surround receptivefield
organization getexcited when
light
shinesin
the
center of receptivefield
andit is dark
around.Cells
that getexcited when
it is dark in
the
center andlight
shines around are called off-center/on-surroundcells.
Receptive field
acts as atransformation
between
the
retinalimage
andthe
neuron'sresponse.
The
visualinformation
then
passes via an optic nerveto the
optic chiasm.The
opticnerve
is
agroup
of nervesthat
connectsthe
eyeto the
brain.
From
theoptic chiasmthe
optictract
leads
to the
Lateral Geniculate Nucleus (LGN).
From
the
LGN
the
visualinformation
flows
to
the
back
ofbrain
wherethe
visual corticalareas arelocated.
The
visual cortexis divided into
severalareas,
each specializedfor
processing
specific visualinformation.
The
areas arehierarchically
arrangedstarting
withthe
primary
visual cortex(VI,
V2) leading
into
V4,
infero-temporal
regions,
parietal regions etc.The
visual areasVI
andV2
have
been
studiedextensively
in
the
past(Hubel
&
Wiesel,
1962).
Their findings
showedthat
neurons
in
VI
aretunedto
simple orientedline
gratings.The
VI
cells were classified asbeing
simple or complex cells.Simple
cellsincreased
in
activity
when an oriented edgefalls in
theexcitatory
part ofthe
receptivefield.
The
complex cells tunedfor
the
same orientation asthe
simple
cell,
gets excited regardless ofthe
positionofthe
bar in
its
receptivefield. Neurons in
the
striate cortex are
tuned to
spatial propertieslike
edges and spatiotemporal motion.The feature
complexity
(specificity)
increases
asthe
visualinformation
passes throughto the
higher
visualareas
(Poggio
&
Riesenhuber,
2002).
Visual
cortex neuronsincrease in
their
specificity
andfeature
complexity
in
the
higher
visual areas.Humans
areknown
to
achieve object recognitionand categorization
in 300
msfrom
the time the
light
entersthe
eye.Such high
speedprocessing
2.2 Computational modeling
ofthe
neuron propertiesThe
electrophysiologicalstudy
ofthe
catbrain has led
to
insights into
the
structure ofthe
visualcortical
neurons,
brain
regions etc.Microelectrode
recordings ofthe
neuronshave discovered
the
receptivefield
structure ofthese
cells.Through
this
information
various mathematical approximations ofthe
receptivefields have been
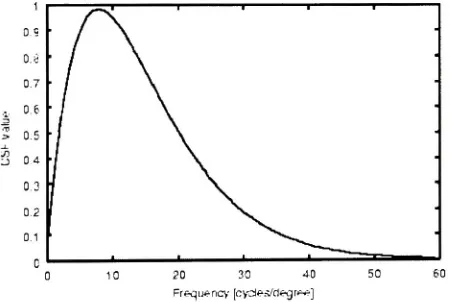
proposed.Ganglion
cells responses exhibita contrastsensitivity
responsecurve as shownin
the
Figure 2.2.
The
cells givethe
highest
responseto
sinusoidalgrating
of4-5
cycles/degree andthe
responsefalls
offgradually
withlower
orhigher
frequency
gratings.The
peakin
the
contrastsensitivity
curve
indicates
the
grating's perfecttuning
withthe
cells receptivefield.
Mathematically
the
basis function
ofthe
receptivefield
structure canbe
modeledusing
afirst derivative
ofGaussian
or
difference between
two
Gaussians.
Young
(1985)
explainsthe
physiologicalfit
of theGaussian
derivative
modelto
the
physiological records ofthe
simple cells spatiotemporalreceptive
field
structure. [image:15.533.120.346.333.484.2]Frequency [cyolei'ctegr^]
Figure 2.2: Contrast
Sensitivity
Function (adaptedfrom Kresimir Matkovic
thesisdissertation)
Simple
and complex cellsin
the
VI
area ofthe
primary
visual cortex aretuned
to
respondto
overview of
using
basis
functions
as a meansfor representing
the
receptivefield
structuresfor
[image:16.533.145.346.294.435.2]natural scenes.
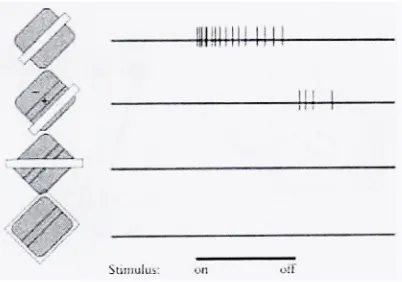
Figure 2.3
and2.4
illustrate
the
activity
ofsimple andcomplex cell when aslitis
arranged onthe
receptive
field. Figure 2.3
showsthe
response ofan on-center simple cell.The
stimulusline
atthe
bottom
ofthe
figure is
the
duration
for
whichthe
stimulus wasturned
on andthen turned
off.The
top
mostrecording
with a slit of perfect(optimum)
size,
orientation evokes ahigh activity
indicated
by
the
bars
onthe
activity
scale.Second
arrangement,
theslitlies
ontheinhibitory
partof
the
on-centercell, this
produces no response andonly
producing
an offdischarge
oncethe
slitis
turned
off.Third
arrangement, the
slit covers a part ofthe
excitatory
andthe
inhibitory
part,
thereby
producing
no cell activity.In
thefourth
experiment the entire receptivefield is
illuminated,
no responseis
produced.mm
Stimulus:
Figure
2.3: Simple
cellactivity for
slit ofdifferent
arrangementsin
thecellreceptivefield.
(Adapted
from
"Eye, Brain,
and Vision"by
Hubel
(1988))
Figure 2.4
showsthe
complex cell responseto the
same slit placed withinthe
receptivefield. The first
three records showthat the
cell exhibitsactivity
for
a slit of optimum orientationregardless of where
it lies in
the
receptivefield.
The
final
recordindicates
that
a slit withnon-optimalorientationproduces noresponse.
The
complex cells arecomparatively larger
in
sizethat
TTit-rt
Figure 2.4:
Complex
cellactivity for
slit ofdifferent
arrangementsin
thecell receptivefield.
(Adapted
from
"Eye,
Brain,
andVision"by
Hubel
(1988))
Color
opponent cellsin
the
retina andLGN
are responsiblefor
color perception.The
coloropponent
theory (Hering,
1964)
statedthat
colorslike
red and green orblue
and yellow cannotbe
perceived atthe
samelocation
atthe
sametime.
This
phenomenon explained whatthe
tri-chromaticity
theory
(Helmholtz,
1925)
failed
to
accountfor.
According
to
tri-chromaticity
theory
the
combination ofthe three
primary
colors(red,
green,
blue)
givesthe
myriad of colorcombinations.
The overlap
between
the
response ofthe three
photoreceptors accountsfor
colorperception.
Color
opponentcellsin
the
LGN
have
the
concentric color center surround receptivefields.
Red-center-on/Green-surround-off,
Red-center-off/Green-surround-on,
Green-center-on/Red-surround-off,
Green-center-on/Red-surround-off
arethe types
of color opponent cells.2.3 Eye
movementsin
Visual Search
Moving
the
eyesto the
objects ofinterest
enables usto
processthe
objectin
detail. High
resolution vision
is only
available atthe
central region ofthe
retina(fovea)
andthe
resolutionprogressively drops
offfurther away from
the
fovea. Thus
we make eye movementsto
processthe
information
atfull
resolutionatthe
location
ofinterest. Our
eye movements areballistic
witha series of
fixations
and saccades.Fixation
is
amomentary
pause at alocation
during
the
scanning
ofa scene.A
saccadeis
amovementfrom
onefixation
to the
other.Recent
researchhas
emphasized
the
use of eye movementsin
inferring
underlying
cognitiveprocessing (Pelz
et al.2000). The
eyes cannot perceiveduring
a saccade andthe
retinalimage
appears as ablur. It is
only
during
the
fixation
that
a stableimage
ofthe
sceneis formed. This
succession of a stablethe
stable perception ofthe
world emergesfrom
this
chaotic process(Rayner,
1978). What
information is integrated
acrossfixations? What
part ofthe
sceneis
memorizedin
the
previousfixation
andintegrated
withthe
information
obtainedin
the
successivefixations?
Research
by
Palmer
andAmes
(1992)
showedthat
subjects were ableto
correctly discriminate between
the
different
shapes oftwo
objects whenthe
objects were viewedin completely different fixations.
Another
observationby
Hayhoe,
Lachter
andFeldman
(1991)
indicated
that
the
spatialinformation
about pointsis held in
a map-like representation whichis formed
over a number offixations. Their
experimentsshowedthat
subjects couldcorrectly
identify
whether points viewedin different fixations formed
the
percept of atriangle.
Such
amap like
representationis
similarto
the topographic
representationtechniques
widely
usedto
representthe
scene.Information
integration
acrossfixations
shedslight
onthe topic
ofmemory
during
visual search.Visual
search experiments with searchitems
trading
spacesevery 110ms in
the
display by
Kristjansson
(2000)
provedthe
presence of memory.The
searchtimes
were slower when atarget
item
was relocatedto
alocation
previously
taken
by
adistracter item. This behavior indicates
that the
already
visiteddistracter locations
are remembered and areleast
likely
to
be
revisited.Contrary
to this understanding,
Horowitz
andWolfe
(1998)
showedthat
visual searchlacks any
memory.
Their
experimental methods also used a scenein
whichthe
items
wererandomly
relocated
regularly
during
the
search sothat
it
wouldbe
difficult
to track
searchitems based
ontheir
location
and appearanceduring
the
search.But
their
resultsdid
not show adrop
in
searchefficiency
despite
the relocation,
indicating
that
visual searchdoes
make explicit use of memory.According
to the
previousbeliefs
(Klein, 1988),
during
searchthe
already
visitedlocations
aretagged
sothat
they
areinhibited from
being
visited again.For
a scene with constant relocation ofitems,
this
approach oftagging
would resultin
the
degradation
of search efficiency.During
afixation,
whichapproximately
lasts
for 150
to
350
ms, the
nextfixation location is
decided.
Attending
to
objects without eye-movementsis
called covert attention.Focusing
ofattention
by
eye movement orhead
movementis
called overt attention.Liversedge &
Findlay
(2000)
analyzedhow
this
covert attentioninteracts
withthe
overt eye movements.Could
multiple covert visual scans precede an overt eyemovement?
The
rate ofredeployment ofcovertduring
fixation duration
of300
millisecond.The proximity
ofthe target to the
currentfixation
location vastly
affectsthe
searchtimes.
It is
provedthat the
probability
oflocating
the target
is
higher if
the target
lies
closeto the
currentfixation
(Findlay
etal,
2001). This
emphasizesthe
possible role of covert attention
for correctly
locating
the target
if it lies
within closeproximity
than
locating
atarget
whichis further
away.From
the
review ofthe
literature
on visualsearch,
the
factors like
attention,
memory
acrossfixations,
semanticinformation
affectthe
searchtimes.
The study
ofthe
patterns ofeye movementswhileviewing
ascenehas lead
to
someinteresting
observations.
The
finding
by
Parkhurst
etal.(2002)
showedthat the
early fixations
of a scan areinfluenced
moreby
the
bottom-up
features saliency in
the scene,
but
asthe
scene scantime
increases,
the
later fixations
arefocused
more onthe
semantically
meaningful regionsthat
is
mediated
by
the top-down
processes.Their
research explainsthis
effectbased
on studiesusing
human
subjectsobserving
natural,
synthetic,
fractal
scenes.2.4 Focus
ofAttention
Given
the
enormous amount ofinformation
flowing
down
the
opticnerve,
it is
not possiblethat
every bit
ofthis
information
canbe
processedby
the
visual systemin
a short amount oftime.
The
visual systemhas
to
decide
onthe
locations
to
selectively
attendto
based
on stimulusfeature
saliency
or volitional control.Selective
attentionhas
a significantimportance
in
sceneunderstand and
interpretation. Change blindness
studieshave
provedthe
importance
of selectiveattention
for
detecting
changesin
a scene(Rensink,
2002). Change blindness
experimentsexplain
the
inability
to
detect
major changesin
a sceneif
the
changing
objectis
notselectively
attended.
Without
attention,
subjectstake
along
time
before
they
candetect
the
changesin
the
scene.
Change
detection
is
widely
used as atesting
paradigmin
the
psychophysics experiments.A
typical
changedetection
experiment showsthe
originalimage
andthen
after abrief
delay
shows
the
sameimage
with an objectdisappeared. The
goalis
to
spotthis
disappearance
ofthe
object.
Subjects
whohaven't focused
onthis
changed objecthave
difficulty
spotting
this
change.Physiologically
the
visual cortexis divided into
two pathways, the
dorsal
and ventral visualpathway.
The
dorsal pathway
alsoknown
as"Where"
pathway is
responsiblefor spatially
recognition.
Neural
correlates of visual attentionhave been
studiedextensively in
the
past(Desimone
&
Duncan,
1995). Their findings
suggestthat
attention causes anincrease in
sensitivity
ofthe
neurons ofthe
V4
andIT
(inferotemporal)
cortex area.Visual
attentionmodulates cells
in
almost all visual areasincluding
the
primary
visual cortex.Selective
attentionat
the
celllevel is
influenced
by
the
competitionbetween
stimulilying
withinthe
cellreceptivefield. Their study indicates
that
asingle stimulus withinthe
receptivefield increases
the
firing
rate.
With
two
stimuli withinthe
receptivefield,
the
cell will responddifferently depending
onits
selectivity.In
case of a goodand poorstimulus,
if
attentionis directed
to good, the
responseto the
combination willincrease
to
alevel
comparableto the
single stimulusresponse.The
samecell's responsewill
decrease if
the
attentionis focused
onthe
poorstimulus.Here
the
goodandpoor state of stimuli
is
withrespectto the
selectivity
ofthe
cell.Computational modeling
of selective attentionhas
been
successfully
approachedin
the
past.Work
ofKoch & Ullman
(1985)
representsthe
relativeimportance
orconspicuity
of objectsbased
ontheir
surroundingsin
topographical
map
calledthe
saliency
map.A
winnertake
allnetwork
then
selectsthe
location
withthe
highest saliency in
the
saliency
map.The basic
theory
behind
this
implementation is
that the
competitionbetween
the
different saliency
mapsbased
onlateral inhibition eventually
comesup
with awinning location. This
theory
is entirely
bottom-up
in
nature withoutany higher
level
knowledge feedback.
This
bottom-up
saliency
mechanismwaslater computationally
modeledby
Itti
& Koch (2001). Their
model representsthe
input
scenewith multi-resolution
feature
maps obtainedfrom
spatialfiltering
in
parallelfor
eachfeature.
The
feature
channels areintensity
contrast,
color opponentfeature
maps,
and orientationfeature
maps.
These
multi-resolutionfeature
maps are normalized withinthe
respectivefeature
channelsandadded
to
form
three
final saliency
maps.These
three
saliency
maps arethen
normalizedandadded
together,
this
final saliency map
representsthe
salientlocations
ofthe
scene.The
normalization process simulates
the
long
rangeinhibition
with eachmap
and assigns non-linearweights
to the
individual
maps.The map
withlarge
amount ofinformation
getthe
lowest
weights and maps with sparse
but
highly
localized
regions are assignedhighest
weights.This
kind
of non-linear summation assuresthat the
features
that
are activein only
afew
mapsdo
notget subdued
due
to
summation andfeatures
which are presentin
multiple mapsdo
not getfocusing. This winning location is
then
processedfor higher level
visualtasks.
The
inhibition-of-return network
first
selectsthe
most salientregionform
the
saliency
map.Once
selected, this
location
is inhibited
andthe
nexthighest
salientregionis
selectedfor focusing. This
procedureacts as
memory
during
scanning
the
scene,
because
by
inhibiting
a region andthen
focusing
onother salient regions
is
representative ofsaying
that the
location
oflast focused
regionis
remembered and not attended again.
Their
model capturesthe
characteristics of an exogenousattention
based
system.The
theory
offocus
of attention cannotbe
complete withoutmentioning
the
covert and overtattention mechanisms.
The
importance
of covert and overt attentionis
evidentin
psychophysicaltasks
using dual
task paradigm andRSVP
(rapid
serial visual presentation).In dual
task
paradigm, the
subjects are requiredto
perform an attentiondemanding
task
in
the
central regionof
the
display
such asto
find if
allthe
letters
arethe
same or not.At
the
sametime
whilefocusing
onthe
centraltask,
perform another peripheraltask
such as scene categorization etc.The
subjects performthe
peripheraltask
using
covert attention whileovertly
fixating
at thecentral task.
In
rapidserial visualpresentationtask
a sequence ofimages
areflashed
one afterthe
other on
the screen,
eachimage
being
visibleonly
for
afew
milliseconds.The
subjects arerequired
to
categorizethe
displayed
images into
natural orindoor
images. With
such shortdurations,
subjects canonly infer
the
gist ofthe
sceneby
covertly
attending
to
certainlocations.
The dual
task
paradigm analysesthe
thresholds of attentionrequired when complete attentionis
available
to
atask
and whenthe
attentionis
divided between
two tasks.
One
ofthe
inherent
problemsin
objectrecognitionhas
been
that
offeature binding.
When
there
are multiple objects present
in
the
visualfield,
the
problemofassociating
orbinding
the
features
of
individual
objectsis
called asthe
binding
problem(Schoenfeld,
2003).
Selectively
attending
to the
objects canhelp
in
solving
this
problem.This issue
leads
us tothe
domain
offeature
2.5 Visual Search
One
ofthe
earliesttheories
offeature
integration
was proposedby
Triesman & Gelade (1980).
Their
work categorized visual searchinto
two
types;
singlefeature
search(disjunctive
search)
and
feature
conjunction search.In
adisjunctive
searchthe
visualsearch requires searchfor only
one
feature,
like
a searchfor
yellowin distracters
ofredand green.Conjunctive
searchinvolves
search
for
a combination offeatures,
example color/motionorcolor/orientation objects.Feature
searches are
fairly
simple and occurin
parallel,
i.e.
the target
features pop
out ofthe
scene.The
time taken to
searchthe target
object amongstthe
distracters is
calledthe
reactiontime.
In
parallel searches
the
reactiontime
is independent
ofthe
number ofdistracters
presentbecause
the
target
objecttends to
pop
out ofthe
scenein
a pre-attentive manner.In
serial searchesthe
reaction
time
linearly
increases
with anincrease in
the
number ofdistracters in
the
scene.According
to
Triesman & Gelade
(1980),
searchis
serialfor
target
defined
by
the
conjunctionoffeatures from different feature dimensions. Serial
searches requirethe
analysis ofthe
searcharray
to
spotthe target.
Their
modelalso predictsthe
use oftopographic
mapsto
focus
attentionon
the target
objects.Buracas & Albright
(1999)
conducted comparative psychophysical studies onhumans
andmacaque monkeys
to
comparethe
performance ofhuman
and non-human primatesin disjunctive
and conjunctive visual search
tasks.
The
experiment consisted ofbriefly
presenting
a samplestimulus
followed
by
the
search array.The
subjects were expectedto
spotthe target
stimulusfrom
the
search array.The
stimuli presented were a combination ofcolor,
orientation and motiontargets.
As
expected, the
human
and rhesus monkeysboth
gave serial and parallel searches asstated
before. The feature integration
modelhas
met with some criticismlately
regarding
the
serial searches
for
conjunction offeatures. Nakayama
andSilverman
(1986)
provedthat
parallelsearches are possible even
in
the
case offeature
conjunctions ofcolor/stereoscopicdisparity
ormotion/stereoscopic
disparity. For
combination of color/motionfeature
their
experimentsdid
giveserial searches similar
to that
predictedby
Triesman & Gelade (1980).
Another
computational model ofvisual searchthat
capturesthe
interaction
between
the
bottom-up
andtop-down
attention systemsis described in
the
Guided Visual Search
model(Wolfe,
1994). The
model extracts a set of stimulusfeatures
(color,
orientation,
motion)
in
the
different
bottom-up map
enhancesthe
features
which are unique comparedto the
surrounding features. Given
ascene with one
horizontal
line between
multipleverticallines,
the
horizontal feature map
will getthe
maximumbottom-up
activation comparedto the
vertical.If
this
difference in
activationis
large
enough,
feature
pop-outeffect willtake
placeresulting in
a parallel search.The
top-down
map
activatesonly
the target
objectfeatures. This map
topographically
representsthe
input
spacewith
high
activationfor
target
features. The
bottom-up
andtop-down topographic
maps arethen
summedtogether to
form
an activationmap.The
activationmap has
regions ofhigh activity
that
will
be
focused
onduring
the
visual search.Each locus
onthe
activationmap is
visitedsequentially
to
detect if
the
target
is
present.The
selection offeatures for
top-down
activationin
their
systemis
rulebased. The
rule selectsfeatures
that
give maximumdiscrimination between
the target
anddistracter
ratherthan
just
the
feature
which givesthe
maximum response.The
technique
usedfor
each channelis
to take the
difference
between
average responses ofthe
channelto the target
from
the
channel's responseto the
distracter. In my
contributionin
this
thesis,
a responsefrom
the
neural network whichhas learnt
the
features
ofthe target
is
usedto
create
the top-down
map. [image:23.533.156.319.359.506.2]2.5:
searchfor
"invertedS"in
asearchimage containing "S".
Figure 2.5
shows an example of serial searchfor
target "S"amongst
the
distracters
ofinverted S.
Since
the target
anddistracters
share some similarproperties,
deploying
the
bottom-up
attentionwill produce
high
activation all overthe
visualfield.
Only
withthe
help
of slowtop-down
Color Visual Search:
Work
by
D'Zmura
(1991),
explainsthe
serial/parallel nature of color visual search whensearching for
target
colorsamongstdistracter
colors.The
research reports onthe
reactiontime
ofhuman
subjectsto
discriminate between
target
anddistracter
objects ofdifferent
colorsin
the
scene.
Color
visual search canbe
classified asbeing
serial orparallel,
depending
onthe
amountof color
difference between
the target
andthe
distracter
object.Search in
whichthe target
colorpops out of
the
scenedue
to
large
colordifferences between
the target
anddistracter
coloris
known
as parallel search.Parallel
searches areindependent
ofthe
number ofdistracters
presentin
the
scene.In
serial searchthe
reactiontime
increases
with anincrease in
the
number ofdistracter
objectsin
the
scenedue
to
small colordifference
between
the target
anddistracter
colors.
Their
contributiondiscusses
in length
the
variousfactors
such as color saturation etc.that
canaffect
the
search.Nagy
& Sanchez
(1990)
reported resultssuggesting
that
longer
searchtimes
areobserved
if
the
colordifference
is
small and shorter searchtimes
are seen withlarger
colordifference between
target
anddistracter.
The
searchtimes
werefound
to
increase
linearly
withthe
number ofdistracters
whenthe
colordifferences
weresmall,
whereasthe
searchtimes
remained constant when color
differences
werelarge.
Work
by
(D'Zmura, 1991)
showedthat
searchfor intermediate
colors,
such as orange can resultin
a parallel search amongstdistracter
madeup
of redand green.Their
result emphasizedthat
in
this case, the
observers used a mechanismtuned to
yellow eventsin
the
visualfield.
Similarly
orange
targets
popped outin
the
presence ofyellowandblue
distracters.
The
observers relied onthe
redness componentto
detect
this
orangein
parallel.The
reactiontime
graphs showed noincrease in
reactiontime
for
the
abovetwo test
cases.Serial
searches were observedfor
orangetargets
amongstred and yellowdistracters.
Here
sincethe
colordifference between
the target
anddistracter
is
very
small,
serialscanning
ofvisualfield
wouldbe
required.For
the
above parallelsearch
cases,
the
color saturation ofthe
target
color was changedto
observeif different
saturations
did
affectthe
search.For
three
levels
of saturationsthe
searchfor
orange amongst2.6 Interaction between
bottom-up
andtop-down
attentionModel
by
Hamker
(2000)
proposedthe
use offeedback between
successive stages ofthree types
of
neurons,
object selectivecells,
feature
selective cells andlocation
selective cells.The
feedback
connectionsfrom
the
higher levels
to
lower level
cells optimizesthe
weights andmakesthe
cellsin
the
lower level
selectiveto the
features
ofthe
objects.The distributed
competitionbetween
the
IT
(inferotemporal)
cortical neurons enable parallel search even withfeature
conjunctions.
Given
the
fact
that the
visual cortical areas areinfluenced
by
the
reciprocalconnections
between
two
corticallayers,
this
modelis physiologically
plausible.An
iconic based
visual search modeldeveloped
by
Rao
et al(2002)
representsthe
visual sceneusing
oriented spatio-chromaticfilters
at multiple scales.The
target
objectis
also represented with a set ofthese
filters.
The
search process proceedsfrom
coarseto
fine,
comparing
the target
objects'
feature
template
at coarse resolution withthe
scene.On
finding
a match at a coarselevel,
the
searchis
terminated
otherwisethe
nextfine
level
is
usedfor
matching.The
task
relevant
locations
are representedin form
of asaliency
map,
whichthen
guidesthe
saccades.The
spatiochromatic
basis functions
are constructed atthree
scales.Each
scale contains ninefilters
which arethe
first,
second andthird
orderderivative
of2D Gaussian. The feature
templates
ofthe target
are usedto
measurethe
correlation withindividual
objectsin
the
scene.Since
the
saliency map
representsthe
locations based
onthe task relevance, the
region withhighest
saliency is
used as alocation
for
shifting
the
gaze.The
model's approach ofcomputing
the
saliency
mapsby
first
using
the
lower
resolution spatialfilters,
finding
the
correlation andproceeding
to
higher
resolution,
concurs withthe
studiesthat the
coarse resolutionhave priority
overhigher
resolutionduring
the
search(Schyns
&
Olivia,
1994).
Human
attention variesconsiderably
depending
on nature ofthe task
as shownby
Yarbus
(1967). The
locations
focused
uponin
a scene canvary
based
onthe task
athand. One
such modelthat
capturesthis task
relevanceguiding
ofattentionis
described
in
Navalpakkam
& Itti
(2002).
Their
architecture usesfour
components,
a visualbrain,
long
term memory,
working
memory
containsthe
knowledge
ofthe
real world entitiesthat
are part ofthe
given scene.The
agent relays all
this
information
between
the
above modules.The
relevance offixations is
decided
by
traversing
through the task
graph.The working memory
checksif
a path existsbetween
the
currentfixation entity
to the
otherentitiesin
the
graph.If
a pathexists, the
fixation
relevance value
is
calculatedbased
onthe
distance between
the two
entitiesin
the
graph.The
relevance value
decreases
as afunction
ofthe
distance. The final
attention guidancemap
is
apixelwise product of
the
bottom-up
saliencemap
andthe
task
relevance map.This
map
topographically
representsthe
salience and relevance of each objectbased
onits
relevanceto the
task
athand.
Top-down
knowledge
about a scene canbe
a prior semanticknowledge
aboutthe
scene.For
example when asked
to
searchfor
a printerin
anoffice, the
locations
like
officetable
or somestable surface are
the
regions of attention.Whereas
the
ceiling
oftheroomis
highly
unlikely
tobe
searchedfor
a printer.Thus here
the
prior semanticknowledge
that
printers canbe
located
ontables
and not on ceilings can guide search process.The
attention guidance model proposedby
(Oliva
etal,
2003)
modifies attentionbased
onthe
overall scene configurations.Observations
from
the
human
eye movements correlate well withthe
regions predictedby
top-down modelChapter
3:
Computational
Modeling
An
image processing
systemthat
attemptsto
simulatethe
mechanismsof a visual system shouldbe
ableto
modelthe
various stages oftransformations
animage
undergoesin
the
visualpathway
before
any meaning is
extracted aboutits
structure.These
transformations
shouldtake
into
account
the
processing
stage atthe
retina whereluminosity
and colorinformation is
extracted.The image
representation atlateral
geniculate nucleus(LGN)
is
where center-surround cellsenhance
processing
of color perception.The
next stageis
the
modeling
of neural properties ofthe
cellsfound in
the
visual cortexthat
extractthe
contours andbuilds
ahigher level
objectrepresentation
from
this
contourimage.
In
the
domain
of computationalmodeling,
image
processing
kernels have been
proposedin
the
pastthat
simulatethe
responsefunctions
ofthe
neurons
in
the retina,
LGN
and visual cortex.Gabor
orientationfilters,
difference
ofGaussian
filters,
hermite
functions
are all mathematical approximations ofthe
neural receptivefields
andtheir
response.The
edgedetecting
filters
are seen as principal components requiredto
representanatural
image
withoutinducing
redundancy.The
goalis
to
find
as smaller number of units as possibleto
representthe
input
space withoutlosing
the
important information.
3.1
Physiologically
inspired
kernels
Receptive fields in
the
visual cortex arelocalized
andhave
frequency
band
pass properties.These
cells exhibit spatial as well asfrequency
overlap
withthe
neighboring
neurons.This is
evident
from
the
orientationselectivity
of neuronsin
a singlehypercolumn
ofstriate cortex.The
adjacent neurons within a
hypercolumn
have
overlapping
orientationtuning
curves.Neurons
in
the
primary
visual cortexsparsely
codethe
image
properties.Sparse coding
statesthatthe
visualcortex neurons are
selectively
tuned
to
aparticularstimulusanddo
not respondto
every
stimulusin its
receptivefield. Thus
computationally modeling
these
selective neuronsis
the
goal ofimage
processing filters.
Bell
&
Sejnowski
(1997)
showedthat
edgefilters
areindependent
componentsof natural
images. The filters
developed
by
their
approach ofindependent
component analysisshow responses similar
to
the
responses of orientationtuned
simple cell neurons.Another
approach
for
building
the
edgefilters
which resemblesthe
sparsecoding
in
the
cortexis
by
Olshausen
&
Field (1996).
They
useaminimumentropy
approachto
build
aset of small numberband-passedsimilar
to the
Gabor basis functions. Sparse coding
reducesthe
redundancy
during
image
representation.
It is known
that
a population of active cellsin
the
visual cortexselectively
represents
the
stimulus.This
population of active cells can representthe
stimulusin
alocal,
dense
or sparse manner(Foldiak &
Young, 1995),
depending
onthe
number of neuronsthat
areactive.
Activity
ratiois
the
number of neuronsin
a population ofneuronsthat
are activefor
astimulus representation.
In
alocal
code,
each stimulusis
encodedby
one unit or neuron.Local
code
has
the
lowest activity
ratio.In
a sparse codethe
number of active unitsis relatively
low,
allowing
efficientcoding
andavoiding
the
problems of alocal
code.The Gabor
wavelets anddifference
ofGaussian filters
canbe
used asbasis functions
to
encodethe
stimulusin
sparsemanner.
The
filters described
usedin
this
focus
of attention model are alldesigned
at multiple resolutions.This
is in
agreement withthe
fact
that
receptivefields
in
the
retina and cortexhave
multiplespatial resolutions.
The
retinal ganglion cellsin
andimmediate surrounding
ofthe
fovea
are ofhigh
resolution(smaller
spatialsize)
andprogressively
reducein
resolution(larger
spatialsize)
around
the
periphery.The
modeldescribed
here filters
the
input image
uniformly
all overthe
image
with eachfilter,
withoutattempting
to
processhigh
resolution atthe
point offixation
andwith
lower
resolutionsaround.Receptive
field
ofthe
retinal ganglion cells andthe
lateral
geniculate nucleus exhibit a centersurround
behavior.
These
cells are oftwo
types,
on-center/off-surround andoff-center/on-surround.
The
Difference
ofGaussian filter
(DoG)
is
usedto
modelthe
receptivefield
propertiesshown
in Figure 3.1.
DoG
filter is
obtainedby
taking
adifference between
the
response oflarge
width
Gaussian
andGaussian
of a smaller width.The
same receptivefield
structure canbe
obtained
from
afirst
derivative
ofGaussian.
On-center
Off-surround [image:28.533.43.455.556.640.2]Off-center
On-surround
Gabor
filters
are usedto
modelthe
edge andbar
detecting
cellsfound in
the
visual cortexVI.
Sine
and cosineGabor
filters form
aquadrature pairfilters
to
detect
orientations of edges andbars in
the
input
scene.Figure 3.2
showsthe
sineGabor
wavelets. [image:29.533.82.387.152.228.2]0 degree.
45
degree.
90 degree.
135 degree.
Figure 3.2:
sineGabor
orientationfilters. (Bar detection
filters)
The
0 degree Gabor filter
when convolved withthe
input image
extracts allthehorizontal
edgesfrom
the
image.
Similarly
the
90 degree filter
extractsvertical edges.The
Gabor filters
simulatethe
processing
ofthe
orientationtuned
simple cellsin
the
primary
visualcortex.Image
processedat
the
retinathe
LGN is
the
input
to the
visual cortex.Therefore
the
input image
to the
cortexis
the
intensity
contrastimage
whichis
a result ofthe
center surround retinal ganglion cells andLGN. The
Gabor
filters
are convolved withthe
intensity
contrastimage.
Color
opponentcellsThe
outputs ofthe short,
medium andlong
wavelength cones are combinedin
an opponentfashion. This is
based
onthe
opponenttheory
by Hering
(1878),
that certain color combinationsdo
not appeartogether.These
color combinationstend to
cancel each other.The
cellsin
retinaand
LGN
color are codedby
color opponent cells.Figure
3.3
illustrate
the
different
coloropponent cells.
o
/ \
o
(a)
(b)
(c)
(d)
Figure 3.3
:Color
opponentcells(a)
Red-center/Green-surround(b)
Green-center/Red-surround(c)
[image:29.533.53.451.490.593.2]Red-center/Green-surround
cells willproduce maximumactivity if
the
cellin
excitedby
redin
the
center and no green around.The
oppositeis
true
for
the green-center/red-surround
cellsthat
show
activity for
green regions ofthe
scene.The
samebehavior is
observedfor
Blue-Yellow
center surroundopponent cells.
3.2 Computational
modelFigure 3.4
showsthe
block diagram
ofthe
model.The processing
ofthe
systemis divided into
two
processing
channels.First
channelis
calledthe
bottom-up
attention.Within
this
processing
domain
spatialfiltering
is
applied onthe
image in
the color,
intensity
and orientation channels.This
forms
the
part ofbottom-up
attention.Another processing
channel calledthe top-down
attentionchannel processes
image in
atop-down
fashion. Neural
networkis
usedto
generatethe
task
relevant salientimage
regions.3.2.1
Bottom-Up
Attention
The
multi-resolutionGabor
filters,
difference
ofGaussian
and color opponentkernels
are usedfor
convolutions.The
outputfeature
maps within each channel encodethe
feature
properties.The
feature
maps generated within each channel are all ofthe<