i
Quantitative Structure-Retention
Relationships for Rapid Method
Development in Reversed-Phase
Liquid Chromatography
Yabin Wen
M.Sc.
Submitted in fulfilment of the requirements for the degree of
Doctor of Philosophy
School of Physical Sciences
University of Tasmania
ii
This thesis contains no material which has been accepted for a degree or diploma by the University or any other institution, except by way of background information and duly acknowledged in the thesis, and to the best of my knowledge and belief no material previously published or written by another person except where due acknowledgement is made in the text of the thesis, nor does the thesis contain any material that infringes copyright.This thesis may be made available for loan and limited copying and communication in accordance with the Copyright Act 1968.
The publishers of the papers in this thesis hold the copyright for that content, and access to the material should be sought from the respective journals. The remaining non published content of the thesis may be made available for loan and limited copying and communication in accordance with the Copyright Act 1968.
iii
The following people and institutions contributed to the publication of work
undertaken as part of this thesis:
Candidate: Yabin Wen, ACROSS, School of Physical Sciences, UTAS
Paul R. Haddad, ACROSS, School of Physical Sciences, UTAS
Ruth I.J. Amos, ACROSS, School of Physical Sciences, UTAS
Mohammad Talebi, ACROSS, School of Physical Sciences, UTAS
Robert Shellie, ACROSS, School of Physical Sciences, UTAS
Eva Tyteca, ACROSS, School of Physical Sciences, UTAS
Maryam Taraji, ACROSS, School of Physical Sciences, UTAS
Soo Hyun Park, ACROSS, School of Physical Sciences, UTAS
Roman Szucs, Pfizer Global Research and Development, Sandwich, United Kingdom
John W. Dolan, LC Resources, McMinnville, Oregon, United States
Chris A. Pohl, Thermo Fisher Scientific, Sunnyvale, California, United States
Author details and their roles:
Paper 1, “Towards a chromatographic similarity index to establish localised quantitative structure-retention models for retention prediction: use of retention factor ratio”, located in Chapter 3.
E. Tyteca (50%), M. Talebi (7%), R.I.J. Amos (7%), Y. Wen (Candidate, 5%), S.H. Park (5%), M. Taraji (5%), R. Szucs (2%), C.A. Pohl (2%), J.W. Dolan (2%), P.R. Haddad (15%).
• E. Tyteca was the primary author with P.R. Haddad, M. Talebi, and R.I.J. Amos
contributed to the idea, its formulation and development.
• P.R. Haddad, M. Talebi and R.I.J. Amos assisted with refinement and presentation.
• Y. Wen (Candidate), S.H. Park, and M. Taraji offered retention data and molecular
descriptors for the modelling, along with preliminary results for the pilot study, and offered some descriptions in the experimental section of the manuscript.
• R. Szucs, C.A. Pohl and J.W. Dolan established the need of study and provided
iv
M. Talebi (50%), Robert A. Shellie (7%), R.I.J. Amos (7%), Y. Wen (Candidate, 5%), S.H. Park (5%), M. Taraji (5%), R. Szucs (2%), C.A. Pohl (2%), J.W. Dolan (2%), P.R. Haddad (15%).• M. Talebi was the primary author with P.R. Haddad, Robert A. Shellie, and R.I.J.
Amos contributed to the idea, its formulation and development.
• P.R. Haddad, Robert A. Shellie and R.I.J. Amos assisted with refinement and
presentation.
• Y. Wen (Candidate), S.H. Park, and M. Taraji offered retention data and molecular
descriptors for the modelling, along with preliminary results for the pilot study, and offered some descriptions in the experimental section of the manuscript.
• R. Szucs, C.A. Pohl and J.W. Dolan established the need of study and provided
feedback on the work.
Paper 3, “Retention prediction in reversed phase high performance liquid chromatography using quantitative structure-retention relationships applied to the Hydrophobic Subtraction Model”, located in Chapter 4.
Y. Wen (Candidate, 50%), M. Talebi (15%), R.I.J. Amos (15%), R. Szucs (2%), C.A. Pohl (1%), J.W. Dolan (2%), P.R. Haddad (15%).
• Y. Wen was the primary author with P.R. Haddad, M. Talebi, and R.I.J. Amos
contributed to the idea, its formulation and development.
• P.R. Haddad, M. Talebi and R.I.J. Amos assisted with refinement and presentation.
• M. Talebi provided general laboratory assistance and GA-PLS algorithm for the
modelling.
• R. Szucs, C.A. Pohl and J.W. Dolan established the need of study and provided
feedback on the work.
Paper 4, “Retention index prediction using quantitative structure-retention relationships for improving structure identification in Non-Targeted Metabolomics”, under revision after favourable review, located in Chapter 5.
Y. Wen (Candidate, 50%), R.I.J. Amos (15%), M. Talebi (15%), R. Szucs (2%), C.A. Pohl (1%), J.W. Dolan (2%), P.R. Haddad (15%).
• Y. Wen was the primary author with P.R. Haddad, M. Talebi, and R.I.J. Amos
v
• M. Talebi provided general laboratory assistance and GA-PLS algorithm for the
modelling.
• R. Szucs, C.A. Pohl and J.W. Dolan established the need of study and provided
feedback on the work.
Signed:
Paul R. Haddad
Supervisor
School of Natural
Sciences
University of Tasmania
Signed:
Ruth I.J. Amos
Co-Supervisor
School of Natural
Sciences
University of Tasmania
Signed:
Jason Smith
Head, Discipline of
Chemistry
School of Natural
Sciences
vi
Publications:1. Y. Wen, R.I.J. Amos, M. Talebi, R. Szucs, C.A. Pohl, J.W. Dolan, P.R. Haddad. “Retention index prediction using quantitative structure-retention relationships for improving structure identification in Non-Targeted Metabolomics”, Anal. Chem. 90.15 (2018): 9434-9440. (Chapter 5)
2. Y. Wen, M. Talebi, R.I.J. Amos, R. Szucs, C.A. Pohl, J.W. Dolan, P.R. Haddad. “Retention prediction in reversed phase high performance liquid chromatography using quantitative structure-retention relationships applied to the Hydrophobic Subtraction Model”, J. Chromatogr. A 1541 (2018): 1-11. (Chapter 4)
3. E. Tyteca, M. Talebi, R.I.J. Amos, S.H. Park, M. Taraji, Y. Wen, R. Szucs, C.A. Pohl, J.W. Dolan, P.R. Haddad. “Towards a chromatographic similarity index to establish localised quantitative structure-retention models for retention prediction: use of retention factor ratio”, J. Chromatogr. A 1486 (2017) 50-58. (Chapter 3)
4. M. Talebi, S.H. Park, M. Taraji, Y. Wen, R.I.J. Amos, P.R. Haddad, R.A. Shellie, R. Szucs, C.A. Pohl, J.W. Dolan. “Retention time prediction based on molecular structure in pharmaceutical method development: a perspective”, LCGC North America 34 (8) (2016): 550-558.
Presentations:
5. P.R. Haddad, Y. Wen, R.I.J. Amos, M. Talebi, R. Szucs, C.A. Pohl, J.W. Dolan. “Quantitative structure-retention relationships for retention prediction in RPLC and their application to early stage drug development and non-targeted metabolomics”, ISCC 2018, Riva del Garda, Italy. (Oral)
6. Y. Wen, R.I.J. Amos, M. Talebi, R. Szucs, C.A. Pohl, J.W. Dolan, P.R. Haddad. “Retention prediction in reversed-phase high performance liquid chromatography using quantitative structure-retention relationships applied to the Hydrophobic Subtraction Model”, RACI R&D Topics 2017, Hobart, Australia. (Oral)
7. Y. Wen, R.I.J. Amos, M. Talebi, R. Szucs, C.A. Pohl, J.W. Dolan, P.R. Haddad. “Retention prediction in reversed phase HPLC using Quantitative Structure-Retention Relationships applied to the Hydrophobic Subtraction Model”, HPLC 2017, Prague, Czech Republic. (Oral)
vii
9. P.R. Haddad, S.H. Park, M. Taraji, Y. Wen, E. Tyteca, M. Talebi, R.I.J. Amos, R.A. Shellie, R. Szucs, C.A. Pohl, J.W. Dolan. “Prediction of chromatographic retention times based on chemical structures of analytes”, ASASS2 2016, Hobart, Australia. (Oral)10. P.R. Haddad, S.H. Park, M. Taraji, Y. Wen, M. Talebi, R.I.J. Amos, R.A. Shellie, R. Szucs, C.A. Pohl, J.W. Dolan. “Role of Structural Similarity in Prediction of Retention in Reversed-Phase, Ion-Exchange and Hydrophilic Interaction Liquid Chromatography Modes Using Quantitative Structure-Retention Relationships”, HPLC 2016, San Francisco, USA. (Oral)
11. P.R. Haddad, S.H. Park, M. Taraji, Y. Wen, E. Tyteca, M. Talebi, R.I.J. Amos, R.A. Shellie, R. Szucs, C.A. Pohl, J.W. Dolan. “Prediction of retention times in reversed-phase, ion-exchange and HILIC modes based on chemical structures”, ISC 2016, Cork, Ireland. (Oral)
viii
First of all, I would like to offer this thesis to my unborn child, the biggest surprise in my life. I predicted my 33rd year would be a powerful one, now you are the answer. Hope that one day you will be proud of your father.Especially, I would like to sincerely thank my primary supervisor, Prof. Paul Haddad, for his guidance and support throughout my study and my life. Being his last PhD student is an honour, and I will never forget his professionalism, humility, and kindness. This thesis would not have been possible without his support and patience.
Additionally, to my beloved wife, Wei Ma, thanks for supporting me and always believing in me. She sacrificed a lot to fulfil my dreams and I will always be grateful. I am also glad to see the achievements you have made for your new career, lovely educator, and I am so proud of you.
I would like to acknowledge my co-supervisors, Dr. Ruth Amos, Dr. Mohammad Talebi, and Assoc/Prof. Robert Shellie, for their excellent guidance, encouragement, and advice on my thesis, publications, and research throughout my PhD. I would also like to acknowledge Dr. Roman Szucs, Dr. John Dolan, and Mr. Chris Pohl, for their helpful discussions upon my publications. Also, many Thanks to Dr. Maryam Taraji and Dr. Soo Hyun Park, for the friendship, discussions, and encouragement.
I also acknowledge the Australian Research Council for the financial support of this research by an ARC Linkage Projects grant (LP120200700) and the Australian Commonwealth Government for providing me the International Postgraduate Research Scholarship (IPRS).
To my dear friends and colleagues, Dr. Min Zhang, Dr. Yan Li, Dr. Feng Li, Shing Chung (John) Lam, Mingxin Liu and Liang Chen. Thanks for sharing the wisdom and experience of life, the good old time will always be in my memory. To the students, post-docs, and staff at ACROSS for offering their assistance and friendship. Also to the members of the old driver football team for organizing the games.
ix
Reversed-phase liquid chromatography (RPLC) is the most commonly used chromatographic technique in the pharmaceutical industry. In RPLC, a computer-assisted approach is capable of accelerating the process of method development by predicting the retention behaviour of compounds of interest, this would then be followed by an optimisation step to improve chromatographic performance. These objectives can be achieved using a combination of analytical routines and chemometric techniques, and quantitative structure-retention relationship (QSRR) modelling is a promising solution from a variety of chemometric methods. QSRR aims to find meaningful relationships between chromatographic parameters and the molecular descriptors of the compounds of interest. QSRR has been applied for the characterisation of columns, the interpretation of retention mechanisms, the prediction of retention, and the identification of unknown compounds.x
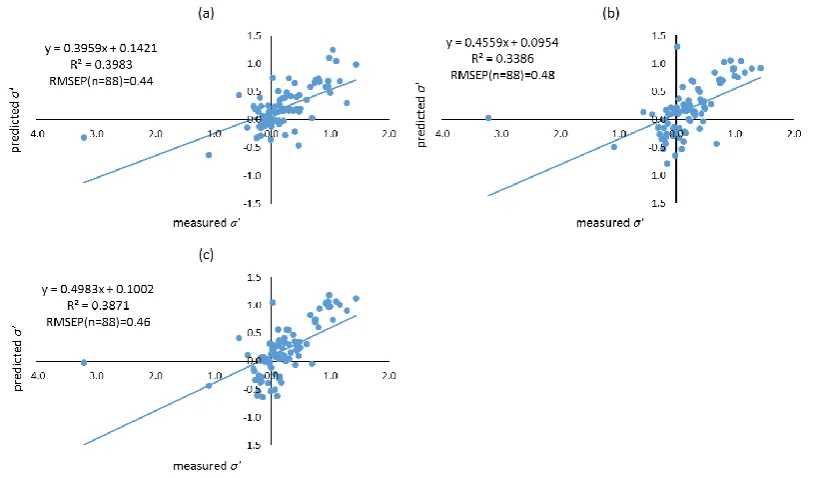
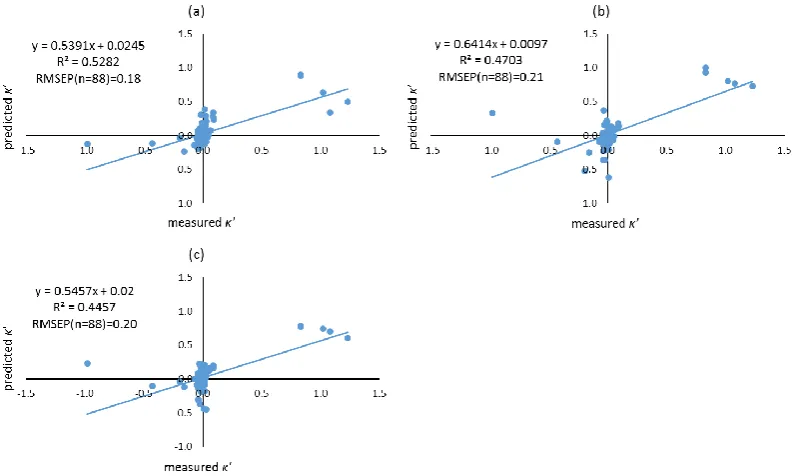
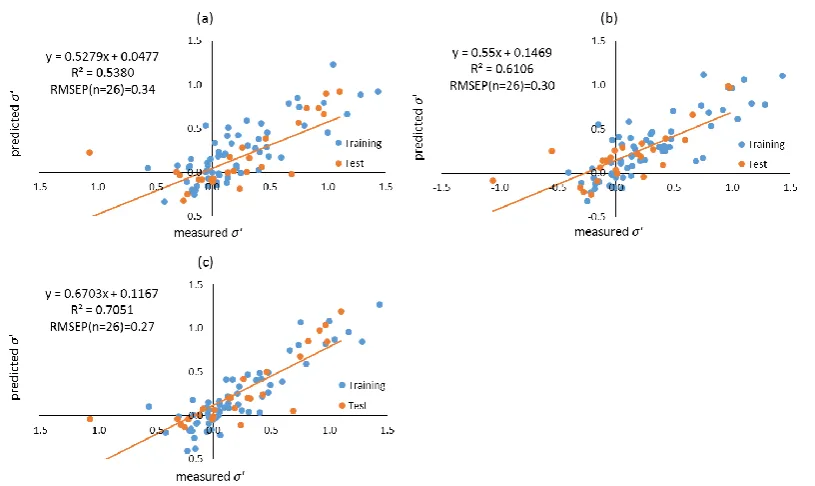
formed using different filtering approaches. Molecular descriptors of compounds were calculated using both Dragon, and VolSurf+. Filtering approaches including leave-one-out (LOO), training-test, local compound type (LCT), and local second dominant interaction after hydrophobicity (LSDI) were utilised to allocate compounds to training sets prior to deriving local QSRR models. Instead of predicting retention times directly, retention was predicted indirectly in this chapter by modelling the five solute coefficients of the Hydrophobic Subtraction Model (HSM). Among these four filtering approaches, the LSDI approach showed the best prediction for the five solute coefficients, followed by the LCT approach, demonstrating that approaches embedded with compound classification yielded better prediction of solute coefficients and hence, retention. In terms of the comparison of descriptor resources, no significant difference was observed given the comparable results obtained. The HSM is capable of indirectly providing sufficient accuracy of retention prediction by fitting the predicted solute coefficients and column parameters together.xii
Declaration ... ii
Statement of co-authorship ... iii
List of publications and presentations ... vi
Acknowledgements ... viii
Abstract ... ix
Table of content ... xii
List of abbreviations ... xv
1 Introduction ... 1
1.1 Thesis overview ... 1
1.2 Reversed-Phase Liquid Chromatography ... 1
1.2.1 High-Performance Liquid Chromatography ... 2
1.2.2 Retention mechanism in RPLC ... 4
1.2.3 Stationary phases in RPLC ... 5
1.2.4 Mobile phases in RPLC ... 8
1.3 Method development in RPLC ... 9
1.3.1 Method development ... 9
1.3.2 Column selection ... 11
1.3.3 Method optimisation ... 12
1.4 Quantitative Structure-Retention Relationships ... 13
1.4.1 Theory and background ... 13
1.4.2 Molecular descriptors ... 14
1.4.3 Feature selection and regression analysis ... 16
1.4.4 Model validation ... 17
1.4.5 QSRR accuracy ... 17
1.4.6 Molecular similarity... 18
1.5 Hydrophobic-Subtraction Model ... 18
1.5.1 Theory and background ... 18
1.5.2 Column selectivity using the HSM ... 19
1.5.3 Retention prediction using the HSM ... 20
1.6 Non-Targeted Metabolomics ... 20
1.6.1 Concept and background ... 20
1.6.2 Metabolite identification in NTM ... 21
1.7 Aims of project ... 22
1.8 References ... 23
2 Experimental Section and Data Collection ... 31
xiii
2.2 Data collection ... 42
2.2.1 Sample preparation ... 42
2.2.2 Instrumentation ... 42
2.2.3 Retention data collection ... 48
2.3 QSRR model generation ... 49
2.3.1 Software ... 49
2.3.2 Calculation of molecular descriptors... 49
2.3.3 Genetic algorithm ... 50
2.3.4 Partial least square ... 51
2.3.5 Types of QSRR model... 52
2.3.6 Model validation ... 52
2.4 References ... 53
3 Direct Prediction of Retention using Quantitative Structure-Retention Relationships in Reversed-Phase Liquid Chromatography ... 57
3.1 Introduction ... 57
3.2 Materials and methods ... 59
3.2.1 Database ... 59
3.2.2 Calculation of molecular descriptors... 59
3.2.3 Similarity ranking ... 60
3.2.4 QSRR modelling ... 61
3.2.5 Statistics ... 61
3.3 Results and discussion ... 61
3.3.1 Role of chromatographic similarity (k-ratio filter) ... 61
3.3.2 QSRR modelling using Tanimoto similarity ... 65
3.3.3 QSRR modelling using Physico-chemical parameter similarity (represented by log D and log P) ... 68
3.3.4 QSRR modelling using dual filter ... 72
3.3.5 The importance of high Tanimoto score for QSRR modelling ... 75
3.4 Conclusions ... 76
3.5 References ... 77
4 Retention Prediction in Reversed-Phase Liquid Chromatography using Quantitative Structure-Retention Relationships: Application to the Hydrophobic Subtraction Model ... 80
4.1 Introduction ... 80
4.2 Materials and methods ... 83
4.2.1 Datasets ... 83
4.2.2 Calculation of the molecular descriptors ... 88
xiv
4.3 Results and Discussion ... 92
4.3.1 QSRR Prediction for Dataset 1 ... 92
4.3.2 Performance comparison of filtering approaches ... 103
4.3.3 Significance of hydrophobicity term in the HSM ... 106
4.3.4 QSRR prediction for the combined dataset using the approximate HSM ... 109
4.3.5 Regression Error Characteristics ... 115
4.3.6 Sum of Ranking Difference analysis ... 116
4.3.7 Molecular descriptors ... 117
4.3.8 Co-elution prediction using the proposed QSRR method ... 119
4.3.9 Retention prediction for new compounds using the proposed QSRR method ... 121
4.4 Conclusions ... 122
4.5 References ... 123
5 Retention Index Prediction to Improve Structure Identification in Non-Targeted Metabolomics ... 126
5.1 Introduction ... 126
5.2 Materials and methods ... 128
5.2.1 Datasets ... 128
5.2.2 Calculation of the molecular descriptors ... 129
5.2.3 Dual-filtering ... 129
5.2.4 QSRR modelling ... 130
5.2.5 Statistics ... 130
5.3 Results and Discussion ... 130
5.3.1 Prediction of retention index using a dual-filtering approach ... 130
5.3.2 Retention index prediction filter ... 133
5.3.3 Elimination of false positives ... 133
5.3.4 Interpretation of selected descriptors ... 138
5.4 Conclusions ... 139
5.5 References ... 140
6 General Conclusions ... 143
xv
Acronym Representation2D Two-dimensional 3D Three-dimensional ACN Acetonitrile
ADME Absorption, distribution, metabolism, and excretion ANN Artificial neural networks
B3LYP Becke 3-parameter (exchange) with correlation by Lee Yang and Parr CT Compound type
CV Cross validation DAD Diode array detector DFT Density functional theory
Fs Similarity factor
G126 Global 126 G34 Global 34
GA Genetic algorithm GC Gas chromatography
GETAWAY Geometry, Topology and Atoms-Weighted AssemblY HILIC Hydrophilic-interaction liquid chromatography HMDB Human Metabolome Database
HPLC High-performance liquid chromatography HRMS High resolution mass spectrometry HSM Hydrophobic-Subtraction Model IC Ion chromatography
k Retention factor
k-ratio Retention factor ratio LC Liquid chromatography
LC-MS Liquid chromatography-mass spectrometry LCT Local compound type
xvi
LSS Linear solvent strengthLTS Local Tanimoto similarity LVs Latent variables
MAE Mean absolute error MD Molecular descriptor MIFs Molecular Interaction Fields MLR Multiple linear regression MOPAC Molecular Orbital PACkage MP Mobile phase
MS Mass spectrometry
NMR Nuclear magnetic resonance spectroscopy NPLC Normal phase liquid chromatography NTM Non-Targeted Metabolomics
OVAT One-variable-at-a-time PDA Photodiode array PLS Partial least squares
PM7 Semi-empirical Parametric Method number 7 PQRI Product Quality Research Institute
QbD Quality-by-design
QSAR Quantitative structure-activity relationship QSPR Quantitative structure-property relationships QSRR Quantitative structure-retention relationship R2 Coefficient of determination
RDF Radial distribution function REC Regression Error Characteristic RI Retention index
RMSE Root-mean-square error
RMSEP Root-mean-square error of prediction
RMSEP% Percentage root-mean-square error of prediction RPLC Reversed-phase liquid chromatography
xvii
SFC Supercritical fluid chromatographySMILES simplified molecular-input line-entry system SP Stationary phase
SRD Sum of ranking difference
tR Retention time
t0 Void time
TS Tanimoto similarity
USP United States Pharmacopeia Convention VIP Variable importance to projection H Stationary phase hydrophobicity S Stationary phase resistance
A Stationary phase hydrogen-bond acidity B Stationary phase hydrogen-bond basicity C Stationary phase ionic interaction
η Solute hydrophobicity
σ Solute bulkiness
β Solute hydrogen-bond basicity
α Solute hydrogen-bond acidity
1
1 Introduction
1.1 Thesis overview
Reversed-phase liquid chromatography (RPLC) has been widely used in the separation science community, especially in the field of the pharmaceutical industry. The availability of a broad range of RPLC stationary phases provides opportunities for meaningfully different retention and separation selectivity. With ever more diverse stationary phases available in RPLC, now it is more challenging for chromatographers to choose the most suitable columns for a given set of compounds, or even a starting point for method development. Traditional method development using trial-and-error methods is usually time-consuming and labour-intensive. One option to speed up the process of chromatographic method development is using computer-based methods to predict the retention behaviour of the compounds of interest with good accuracy mainly based on their chemical structure. With the aid of a variety of chemometric approaches, like the quantitative structure-retention relationship (QSRR) methodology, chromatographers have devoted a great deal of effort to propose possible strategies to accelerate method development in RPLC. This thesis aims to explore strategies for the acceleration of method development in RPLC using QSRR methodology to perform computational retention prediction for compounds based solely on their structures. The developed QSRR strategy was successfully used for the retention prediction of new compounds that have never been used in the modelling process, and the elimination of false positives in non-targeted metabolomics (NTM) to improve the confidence of metabolite identification.
This thesis comprises the development of QSRR models for retention prediction and the application of the proposed QSRR in NTM. The retention prediction was performed using three retention databases extracted from the literature, combined with a separate retention database generated from five new compounds and five new columns. The application of the developed QSRR in NTM was conducted on a database of 1882 compounds with known retention indices and molecular weight. To enhance the predictive ability of the QSRR models, the concept of molecular similarity was employed where different filtering approaches were created and utilised as compound classification filters to yield training sets for the construction of QSRR models. The proposed QSRR methodology has been used in column scoping and co-elution prediction in RPLC, as well as the elimination of false positive in NTM.
1.2 Reversed-Phase Liquid Chromatography
2
chromatography in numerous quantitative and qualitative analysis applications in the last twenty years [1-3]. In comparison to other methods, a great advantage of HPLC is that it provides a quick, automated and highly accurate method to identify certain chemical components in a sample, combined with over hundreds of stationary phases that are available commercially, enabling the realisation of optimal separation for analytes of interest [4-6]. Additionally, liquid chromatography can be integrated with many types of detector systems like diode detectors, and electrochemical detectors, as well as integration with other systems such as Liquid Mass Spectrometry (LC-MS) and Liquid Chromatography-Nuclear Magnetic Resonance (LC-NMR), another reason for the widespread applicability of this technique [7-10]. RPLC is by far the most popular mode of all types of chromatography which is shown by the fact that nearly 90% of small molecule separations are carried out using RPLC [3, 5, 9, 11].1.2.1 High-Performance Liquid Chromatography
HPLC, as a technique in the area of analytical chemistry, aims to identify, quantify and separate the components of a mixture [1, 12, 13]. As an integral and major analytical tool in the modern pharmaceutical industry, HPLC has been applied in all stages of method development, drug discovery and high-throughput screening [1-3]. Chromatography, which can be described as a mass transfer process usually involving adsorption, has been given intensive study for decades. HPLC relies on pumps to deliver the mobile phase liquid and the sample mixture through a column filled with adsorbent, leading to the separation of the components of the mixture. The adsorbent, as the active component of the column, is referred to as a "stationary phase", is typically a granular material made of particles of a porous solid (e.g. silica, polymers, etc.) [1, 14, 15]. Because of the different degrees of interactions with the adsorbent particles, components of the mixture can be separated from each other, leading to the elution of the components as they flow out the column. The pressurised liquid in the HPLC system is typically a mixture of solvents (e.g. water, acetonitrile and/or methanol) and is referred to as a "mobile phase" [13, 16]. During the separation process, the temperature and the composition of the mobile phase play a major role by influencing the interactions taking place between the analytes and stationary phase. These interactions are physical in nature, such as hydrophobic (dispersive), dipole–dipole and ionic interactions, and most often, a combination of interactions contributes to the separation [16, 17].
3
carries the components of sample into the column, while the pumps are used to deliver the desired flow and composition of the mobile phase. Various commercially available detectors are in common use now, such as ultraviolet/ visible absorption (UV/Vis), photodiode array (PDA) or detectors based on mass spectrometry. The detector generates a signal proportional to the number of components of the mixture emerging from the stationary phase, hence allowing the quantitative analysis of the analytes [1, 13]. In addition, with the development of the digital microprocessor and embedded software, the control of the HPLC instrument and data processing has been greatly simplified, making the HPLC system more user-friendly even for less experienced chromatographers [18, 20-22].When separating a given mixture, since there are many combinations of stationary and mobile phases that can be employed, the nature of those phases can be used to classify several types of HPLC techniques [23-25]. Normal-Phase Liquid Chromatography (NPLC), with a solid polar stationary phase and non-polar mobile phase, is usually used to separate polar samples according to the polarity difference of analytes, leading to the least polar components being eluted first, while the most polar components separate last [26, 27]. RPLC, which is the opposite to NPLC, uses a polar liquid mobile phase with a non-polar stationary phase to separate analytes. The most polar components are eluted first, followed by components with lower polarity [1, 6]. Mixtures of water, methanol, and acetonitrile are commonly used as mobile phase, and the non-polar stationary phase can be made by coating silanised silica gel with a non-polar liquid such as a silicone or various hydrocarbons. As an alternative to this type of column, a bonded hydrophobic phase also can be used as the stationary phase, where a hydrophobic molecule is chemically bonded to the polar silica gel. Ion-Exchange or Ion Chromatography (IC), including anion-exchange and cation-exchange, is based on the affinity of the ions and polar molecules to the ion exchanger to separate and determine ions on columns carrying charged functional groups [12, 18]. Other varieties of liquid chromatography such as size exclusion chromatography (SEC) and hydrophilic interaction chromatography (HILIC),
etc. also have been given intensive study.
4
1.2.2 Retention mechanism in RPLC
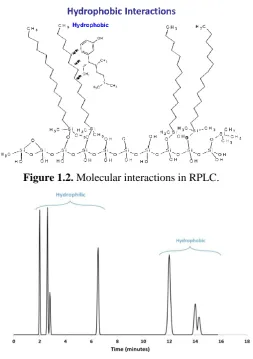
[image:21.595.212.466.348.708.2]The term “reversed-phase” arises as this mode of chromatography was developed after normal phase chromatography in which a less polar mobile phase is used with a polar stationary phase, thus the mobile phase in RPLC is more polar than the stationary phase [7, 28]. RPLC involves the separation of analytes based on hydrophobicity [29, 30]. In its simplest interpretation, the separation in RPLC mainly depends on the hydrophobic interaction between the hydrophobic nature of the molecule (e.g. the carbon backbone) and the non-polar stationary phase ligand (e.g. C18) [31, 32]. The hydrophobic interaction is a weak and transient binding force which includes hydrophobic and van der Waals interactions; the more hydrophobic a molecule is, the more retention it has in RPLC [3, 14, 32]. A schematic diagram showing the binding of an analyte to a reversed-phase surface is shown in Figure 1.2. Accordingly, it is reasonable to estimate the elution order based on the solute property of hydrophobicity or hydrophilicity. Figure 1.3 illustrates the general elution order of hydrophilic and hydrophobic analytes.
Figure 1.2. Molecular interactions in RPLC.
5
Figure 1.4. Simplified representation of retention processes that correspond to various typesof interactions in RPLC. Modified from [32].
It is nowadays generally accepted that the retention of analytes within a RPLC system is caused mainly by hydrophobic interactions between the analyte and the stationary phase [29]. With the intensive study of column characterisation and selectivity in RPLC for decades, other types of interactions between the analytes and the stationary phases which can significantly affect the retention behaviour of solutes have also been found [30, 33-36]. For example, a study performed for a group of alkyl silica phases (i.e., C3-C18) has shown that the retention of compounds on these columns are mainly governed by five different interactions, namely hydrophobicity, steric resistance, hydrogen-bond acidity, hydrogen-bond basicity, and ionic interactions between solute and stationary phase [29, 32, 34-36]. Figure 1.4 provides a simplified representation of these types of interactions.
Given these types of interactions contribute to retention in RPLC, the relative importance of each interaction to solute retention has also been investigated [29, 30, 33]. Wilson and co-workers explored the contribution of each type of interaction in terms of the average change in retention (δlog k) as a result of a maximum change in the column using a retention database which contained 67 compounds [29, 32]. As expected from the nature of RPLC separation, the hydrophobic interaction contributed most to changes in retention as a result of change in the column. The contribution of the remaining interactions was dependent on the particular compounds and columns [29, 34-36]. Although the remaining types of interaction contribute less than hydrophobicity to overall retention, for column selectivity these terms are still important [29, 37, 38].
1.2.3 Stationary phases in RPLC
6
capillary, or monolithic column) and what desired characteristics of the column are needed (base material, bonded phase, and bonding density), as even the same types of columns can differ widely in the power of separation across a wide range of manufacturers [6, 7, 19]. In an HPLC system, the most commonly used packing materials are porous particles with average diameters between 3 and 10 μm, and it is highly recommended that 3 μm particle sizes are applied for most pharmaceutical applications. In the middle of the 1900s, small nonporous spherical particles were introduced to increase the efficiency by eliminating dual column porosity [16, 24, 40]. Another attempt to improve the column permeability was achieved by applying a monolithic column. The monolithic column is able to facilitate the accessibility of the adsorbent surface inside the mesopores of the skeleton as it is only 1 μm thick compared to the 5 or even 3 μm particles in conventional packed columns [16, 21].In RPLC, separations are mainly performed on chemically-modified adsorbents, and analyte interactions with the stationary phase are the primary factors in the process of separation [41, 42]. Silica (SiO2), the most common substance on the earth, is the most
7
Chemical modification is used in the preparation of reversed-phase base materials for the purpose of converting the polar surface into a hydrophobic surface that results in dispersive interactions with the analytes [1, 23, 43]. The conversion of polar silica into a hydrophobic surface needs dense bonding of a thick organic layer, so that the surface of base silica can be shielded effectively [1, 51]. A wide range of different ligands such as C1, C4, C8, C18, Phenyl, Phenyl-hexyl, Nitrile (cyano), and so forth have been tested and bonded on the silica surface [51]. The silanols on the surface can react with different functional groups to form the bonded phase. Practically, almost all of the chromatographic phases that are commercially available are manufactured using a silanisation modification process [14, 15, 47, 50]. There are several types of bonded phases available commercially including alkyl-type phases (C1–C18, C30), phenyl-type phases, and polar embedded stationary phases [1, 15, 31].Alkyl-type phases are well known to chromatographers since almost 90% of reversed-phase columns are based on these reversed-phases [43, 52]. Also, a large number of publications are devoted to the standardisation, characterisation, classification, and comparison of this kind of bonded phase. Among all the investigations, Snyder and co-workers’ research attracted a lot of attention and laid the foundation for the future work of column development and application [29-36]. In the book Practical HPLC Method Development, Snyder indicates that the retention of non-polar and non-ionic solutes follows the retention pattern: C1 < C4 < C8 ≈ C18 in
RPLC [16]. Also, dramatic variation of retention for polar and non-polar solutes has been found on the same C18-type columns from different manufacturers even at the same conditions [16, 24, 42, 44].
Phenyl-type bonded phases also have been studied for a long time, since the structure of a phenyl ring on the surface can introduce π–π interactions with some analytes [1, 13, 53]. Compared to alkyl-type bonded phases, phenyl phases show lower methylene selectivity, which means the separation of members of homologous series will be more selective on alkyl phases than phenyl phases [1, 13, 49].
8
been introduced to the bonded ligands is that these polar groups will inactivate the interactions between silanols and basic analytes by reacting with the residual silanols [1, 57-59].1.2.4 Mobile phases in RPLC
Hydro-organic mixtures are commonly used as the mobile phases in RPLC [1, 13, 16]. Organic modifiers, such as methanol, acetonitrile and/or combinations of these two are most frequently used [60]. In reversed-phase separation, it is generally accepted that the retention of analytes is governed by the concentration of the organic modifier in the eluent [1, 60, 61]. Therefore, considerations like the compatibility between solvents, the solubility of the sample in the eluent, light transmission, etc. need to be taken into account when selecting an appropriate mobile phase for the separation of analytes of interest [1, 59, 62]. For example, methanol and acetonitrile are miscible so this mixture could be used as the mobile phase, while water and dichloromethane are immiscible at most compositions, therefore this mixture should not be used. Similarly, it is well known that a high level of organic solvents should not be used with a high concentration of phosphate buffer since eventually a precipitation will be produced. Additionally, HPLC grade solvents are highly recommended to minimise the contamination of stationary phases and reduce the background absorbance, because impurities exist if the solvent is not purified. Another important consideration for the choice of mobile phase is the light transmission when using UV detection in RPLC. One of the contributing factors to the wide use of acetonitrile as the solvent in reversed-phase separation is because of its low absorbance cut-off wavelength (< 190 nm) [1, 16, 63]. Solvents like acetone and ethyl acetate cannot be used for the separation of analytes at low wavelengths like 210 nm as their UV cut-offs are 330 nm and 256 nm, respectively [1-3]. Like acetonitrile, solvent methanol, ethanol and isopropanol have relatively low UV cut-offs (< 205 nm), but it is always recommended to work at a suitable wavelength with these solvents, for example 210 nm [1-3].
9
proportion of the organic part of mobile phase, allowing early elution of some species of a mixture [1, 64, 67, 68].Apart from the concentration of the organic solvent in mobile phase, the solvent strength also depends on the type of organic modifier used for the separation [1, 13, 64]. Therefore, the correlation between the concentrations of different organic solvents which are supposed to give similar retention of the analytes of interest has been given intensive study. For the most common organic solvents in RPLC, the ranking based on the solvent strength at the same volume percentage (v/v%) is: tetrahydrofuran > acetonitrile > methanol [1, 13, 64]. According to the different solvent strengths, some general rules have been applied in the process of method development. For example, in order to achieve a similar separation (or elution) on the same stationary phase for a given mixture, compared to an acetonitrile/water eluent, an increased proportion of methanol/water is needed in the mobile phase (a higher concentration of methanol is needed, about 10v/v% more of methanol for every 1v/v% of acetonitrile). Those rules only serve as an approximation as there are more parameters involved in the interactions between the analytes, the solvents, and/or the stationary phases.
Water is usually the base solvent in a reversed-phase application, while other polar solvents such as acetonitrile, methanol, etc., are added in varying proportions [1, 13, 16]. An ideal eluent composition should not affect the selectivity between two species if their ionisation state is independent of the increased organic composition [64, 68, 69]. As we know, for neutral solutes, the selectivity will not be affected by increasing the organic composition. But the ionisation state of ionisable components might be affected when different proportions of organic solvent are used, leading to variations in selectivity [70]. Therefore, buffers are usually utilised to adjust the pH of the aqueous solvent to modify separations, because most pharmaceuticals contain ionisable functionalities such as amino, or carboxylic groups [1, 70]. In fact, the retention of most ionisable compounds is controlled by adjusting the composition and pH of the mobile phase to optimise the separation [16, 24]. It is noticeable that the pH specified for a particular separation is that of the aqueous solvent, and that the addition of organic solvent to the aqueous mixture results in a change in final pH of the mobile phase [1, 13, 16].
1.3 Method development in RPLC
1.3.1 Method development
10
can be used for the analysis of small-molecule pharmaceuticals, such as liquid chromatography (LC), gas chromatography (GC), supercritical fluid chromatography (SFC) and electrokinetic separations. In addition, the selection of the specific chromatographic technique within one of the above classes is also involved [38, 72]. As we know, within the broad classification of liquid chromatography, RPLC is the most widely used separation technique, but other complementary techniques include hydrophilic-interaction chromatography (HILIC) and ion chromatography (IC) [38, 72-74]. The second stage of method development is column scoping, which aims to identify the most suitable column (stationary phase, SP) offering adequate resolution for the separation of given analytes. This is often found through intensive experimentation [38, 72]. The final stage of method development is to optimise the precise details of the separation conditions, including parameters that are believed to affect the separation, such as the exact mobile phase (MP) composition, column length and temperature, and the flow-rate, etc [38, 72]. Basically, according to the properties of the desired analytes and the comparison across the available chromatographic techniques, one would be able to select a starting point to develop a chromatographic method. As the primary phase of method development, the selection of the preferred technique, the stationary phase (or column class) and type of mobile phase (especially the preferred type of organic modifier) is called “scoping” (Stages 1 and 2). Furtheroptimisation of details of conditions can be performed via a subsequent phase called “optimisation” (Stage 3) by implementing some form of experimental design approach [6, 24,
38, 40].
11
1.3.2 Column selection
Developing a robust and effective chromatographic method is a diverse and complex process [1, 13]. A comprehensive approach to explore the optimal combination for a separation would be the main investigation of the design space for any proposed analyte mixture and would include the stationary phase, mobile phase, flow-rate, temperature, etc [77, 78]. Within the framework of chromatographic method development, choosing an appropriate technique which is expected to provide the desired separation selectivity is the first step, followed by the selection of a suitable stationary phase and the optimisation of details for the separation conditions including mobile phase composition, pH of aqueous solvent, flow-rate, temperature, and so forth [39, 78, 79]. At present, method development in chromatography is still mainly carried out by trial-and-error experimentation, which is not only time-consuming but also inefficient. Moreover, it has become one of the overriding issues in pharmaceutical industry given the fact that a much greater number of drug candidates than at any time in the past have been designed and synthesised [9, 27, 38, 80]. Accordingly, chromatographic method development must evolve to support the needs of the high throughput of drug discovery.
12
Besides the still repeatedly applied trial-and-error methods, more chromatographic method development is performed by statistical and/or computer-assisted tools [21, 22, 82, 83]. It is well known that time and expenditure could be greatly reduced using an in silicoapproach to investigate chromatographic space [84, 85]. Various types of software packages that assist less experienced chromatographers to understand the mechanisms of separation and to optimise the separation conditions are becoming more attractive [25, 77]. Commercial method development software products such as ACD/LC Simulator (ACD/Labs), DryLab, ChromSword and Osiris, are typically built on initial experimentation with embedded databases to build models either based on molecular-structure-related simulations, retention modelling, or some statistical modelling [38, 72]. While the optimisation phase of method development can be accelerated using software tools, we are still left with the quandary of which column is most suitable for the specific separation of our desired analytes.
Some open resources are very helpful in reducing column choice when replacing a used column for a particular separation. The United States Pharmacopeia Convention (USP) database was designed to assist chromatographers to find HPLC columns equivalent to those that had been used to develop and validate a particular chromatographic procedure [86]. The Product Quality Research Institute (PQRI) database, is capable of selecting an alternative or orthogonal column to a used column by comparing column coefficients [86]. Similarly, a Column Selectivity Database developed by Dwight Stoll and co-workers [87] which contains column parameters for nearly 700 reversed-phase HPLC columns, makes it possible to compare any columns in the database. With the benefit of these open resources, chromatographers can narrow down column selection across a wide range of stationary phases by choosing equivalent and/or orthogonal columns to the column of interest, however choosing the most suitable column for the separation of desired analytes is still not a straightforward process even for experienced chromatographers [4, 78, 81].
1.3.3 Method optimisation
13
experimental conditions, which generates significant waste of resources (both human and instrumental) as well as excessive consumption of organic solvents [2, 19, 24, 38]. To maximise the efficiency of scientific discovery and minimise the waste and cost, researchers are keen to perform the fewest experiments that give the most information possible for method optimisation.Computer-assisted chromatographic optimisation has been intensively used as an alternative [1, 2]. The software packages for optimisation are the most common software tools used for chromatographic method development. These packages run on a premise that the retention of a compound of interest will change in a predictable manner as a function of virtually any continuous chromatographic variable [1, 11]. The most common application of this chromatographic optimisation method is eluent composition, commonly called solvent strength optimisation. For example, with at least two experiments varying the gradient slope for gradient separations or concentration of organic modifier for isocratic separations at a certain temperature, the system then can be used to model any gradient or concentration of organic modifier. Typically, the output from method optimisation package is a resolution map which shows the resolution of the critical pair (two closest eluting peaks) as a function of the parameter(s). The behaviour of certain parameters, including temperature or solvent strength is easily modelled, while other parameters such as the pH or buffer concentration are much more difficult. But, recently there has been renewed interest in automated chromatographic method development [1, 3]. This automated system directly interfaces with the instrument to run or suggest new experiments based on the prior results. Obviously, the advantage of that is the achievement of time-saving in relation to the method development time. However, the lack of maturity of automated optimisation limits its wide application, because this kind of method in principle should follow the logic of chromatographic theory and the mechanism of retention, which unfortunately is not yet fully developed to provide a logical guide [1, 10].
1.4 Quantitative Structure-Retention Relationships
1.4.1 Theory and background
14
the characterisation of columns by quantitative comparison of separation properties or utilised to provide information for the interpretation of retention mechanisms for various chromatographic conditions (stationary phase, mobile phase, etc.) [72, 91, 92]. Additionally, the QSRR method can also offer unique opportunities to predict retention of solutes or to identify analytes [67, 92]. In chromatography, the typical QSRR study comprises several steps: the compilation of a retention database of compounds with known chemical structures, the calculation of molecular descriptors for each structure, a descriptor selection method, QSRR model building, and validation [93, 94]. A scheme of the QSRR methodology is shown in Figure 1.5.Figure 1.5. Scheme of the QSRR methodology in chromatography.
1.4.2 Molecular descriptors
There are several common ways to represent structures [95], including whole molecule 1D descriptors (sometimes known as 0D), 2D descriptors, and 3D descriptors. 1D descriptors express simple chemical information of a solute such as molecular weight or number of oxygen atoms in the structure, where 2D descriptors are computed from the chemical structure of the solutes of interest when represented by a connection table or a molecular graph. 3D molecular descriptors provide molecular information about the 3D arrangement of structural features and general molecular surfaces and volumes [95-97].
15
of chromatographic retention on a molecular level [89, 93] but the correlation to the retention of solutes is often weak, and the calculation is also time-consuming. Topological descriptors are easily generated with present computing tools, but they are not necessarily related to retention phenomena [10, 89].Computing software like Dragon and VolSurf+ is widely used to generate molecular descriptors based solely on their chemical structures [98-100]. These generated descriptors have been used to evaluate QSRR, quantitative structure-property relationships (QSPR) or quantitative structure-activity relationships (QSAR), as well as for similarity analysis and high-throughput screening of molecule databases [101, 102]. Typically, over 4000 molecular descriptors can be generated using Dragon 6.0 software [98, 103]. The 29 categories of Dragon molecular descriptors are detailed in Table 1.1.
Table 1.1. The categories of molecular descriptors from Dragon and VolSurf+ software
Block ID Dragon VolSurf
1 Constitutional descriptors Size and shape descriptors
2 Ring descriptors Descriptors of hydrophilic regions
3 Topological indices Descriptors of hydrophobic regions
4 Walk and path counts INTEraction enerGY (= INTEGY) moments
5 Connectivity indices Descriptors of H-bond donor / acceptor regions
6 Information indices Mixed descriptors
7 2D matrix-based descriptors Charge State descriptors
8 2D autocorrelations 3D pharmacophoric descriptors
9 Burden eigenvalues ADME model descriptors
10 P_VSA-like descriptors
11 ETA indices
12 Edge adjacency indices 13 Geometrical descriptors
14 3D matrix-based descriptors 15 3D autocorrelations
16 RDF descriptors
17 3D-MoRSE descriptors
18 WHIM descriptors
19 GETAWAY descriptors
20 Randic molecular profiles
21 Functional group counts 22 Atom-centred fragments 23 Atom-type E-state indices
24 CATS 2D
25 2D Atom Pairs
26 3D Atom Pairs
16
Unlike Dragon, where a large number of molecular descriptors are calculated, VolSurf+ software can only generate 128 descriptors for the compounds of interest [99, 100, 104]. VolSurf+ can produce and explore the physico-chemical property space of a molecule (or library of molecules) starting from 3D maps of interaction energies between the molecule and chemical probes (GRID based Molecular Interaction Fields, or MIFs) [99, 105, 106]. One advantage of using VolSurf+ is that it compresses the information present in 3D maps into numerical descriptors optimised for ADME (absorption, distribution, metabolism, and excretion) models and virtual screening, making them are simple to understand and easy to interpret [105, 107]. Those 128 molecular descriptors can be classified into nine categories [100, 108]. The 9 categories of VolSurf+ molecular descriptors are also listed in Table 1.1. In QSRR modelling, chemometric methods are commonly utilised to identify the most suitable subset of molecular descriptors which shows the strongest ability to predict retention times and to build the mathematical relationships [109, 110].1.4.3 Feature selection and regression analysis
The objective of utilising variable selection methods in QSRR modelling is to use the smallest number of molecular descriptors commensurate with a valid prediction of retention times from among a large number of generated molecular descriptors [38, 67, 72, 92]. A lot of variable selection methods have been elaborated and the proper feature selection is a key to building successful QSRR models. A reason that a proper feature selection method is important in QSRR modelling is because in a given data set some variables may be redundant, irrelevant or represent noise [38, 72]. An good feature selection method is capable of helping to avoid overfitting, reducing the model dimensions, and improving the performance of models [109, 111]. As reported, many feature selection methods like genetic algorithms (GA) and artificial neural networks (ANN) [112, 113] combined with multiple linear regression (MLR) [114] or partial least squares (PLS) [71, 111, 115], have been given intensive attention to build final model in QSRR studies.
17
𝑦 = a1LV1+ a2LV2+··· +amLVm 1.1
where y is the dependent variable, a1, a2, ···, am are the regression coefficients, and LVi is
the i-th latent variable. As can be seen from Eq. 1.1, PLS summarises the variation in the independent variables into a small set of linear, orthogonal, and latent variables (LVs) by maximising the covariance between descriptors and the dependent variable [111, 115, 118]. In addition, over-fitting in the models can be minimised by optimising the number of LVs.
1.4.4 Model validation
In QSRR modelling, a training set is used to build QSRR models, and a test set is needed for validation. For this purpose, the measured retention data of the test compounds is extracted and compared with the predicted retention data calculated from the derived QSRR models [67, 72, 73, 102]. The statistical reliability of the formed QSRR models needs to be validated, and this can be performed by several approaches. The coefficient of determination (R2), the slope
of the regression with no forced intercept, the mean absolute error (MAE) and the root-mean-square error of prediction (RMSEP) are commonly used to evaluate the fitness and the predictive ability of the constructed QSRR models [72, 73, 91]. Additionally, the percentage root-mean-square error of prediction (RMSEP%) of retention time for the test set is also a frequently used error reporting method for external validation of the accuracy of QSRR models generated from the training sets.
1.4.5 QSRR accuracy
In many cases, the precision and accuracy of the QSRR models is low, but may still be useful for the interpretation of the retention mechanisms, or the optimisation for the separation of complex mixtures, or the preparation of experimental designs [10, 89, 90, 93]. The predictive accuracy of the QSRR models can be influenced by a number of factors: (i) the feature selection method employed to choose the most informative descriptors, (ii) the modelling approach used to build QSRR models, (iii) the model validation approach utilised, (iv) the number of molecular descriptors incorporated into the QSRR models, (v) the geometry optimisation method used, (vi) the size of the dataset employed in the study, and (vii) the range of diversity or similarity of the molecular structures or characteristics.
co-18
workers [120], using a compound-classification-based QSRR methodology to improve the retention time predictability compared with the global models.1.4.6 Molecular similarity
As the name suggests, structurally similar molecules are more likely to exhibit similar properties [121, 122]. From this, the interest has been increased for the prediction of properties for compounds based on molecular similarity [123, 124]. Compared to a diverse training set, a much more structurally similar subset of compounds in a training set could be generated using this concept and is likely to produce better prediction results. The degree of structural similarity between two compounds can be calculated with the assistance of some chemometric tools, allowing a similarity coefficient to be obtained [125].
The Tanimoto coefficient, as the most commonly used similarity measurement of compounds, appears to be the gold standard in computing the fingerprint-based similarity used in QSRR or QSAR modelling [74, 91, 122, 125]. The Tanimoto coefficient for molecules A and B can be calculated using Eq. 1.2:
𝑆𝐴,𝐵=
𝑐
𝑎 + 𝑏 − 𝑐 1.2
Where, a and b are the bit sets in the fingerprints for A and B, and c is the bit set in common between the two fingerprints. The Tanimoto coefficient takes values between zero and unity, with 0 corresponding to no bits in common and 1 to identical fingerprints [121, 126]. In this thesis, the Tanimoto similarity was employed as a basic filter to select structurally similar compounds to the target compound to form a training set to be used for the subsequent construction of the QSRR models.
1.5 Hydrophobic-Subtraction Model
1.5.1 Theory and background
The Hydrophobic-Subtraction Model (HSM) was originally developed to describe column selectivity in RPLC [29, 30, 33]. Wilson and co-workers used a retention database of 67 diverse compounds on 10 different C18 columns to derive a six-term equation for the
correlation of retention as a function of solute and column [29, 30, 33]. As can be seen from the equation below (Eq. 1.3), the relative retention of a given compound is defined through a linear combination of five terms which represent the hydrophobicity (𝜂′𝐇), steric resistance (𝜎′𝐒∗), hydrogen-bond acidity (𝛽′𝐀), hydrogen-bond basicity (𝛼′𝐁), and ionic interactions (𝜅′𝐂), respectively.
log 𝛼 log (𝑘𝑘
EB) = 𝜂
19
Where α is the chromatographic selectivity, k is the retention factor of the solute, and kEBis the retention factor of the ethylbenzene. Each term in this equation corresponds respectively to each of the interactions mentioned above. Values of column coefficients for RPLC phases do not vary much under changing mobile phase composition, except that the C term increases with an increase in mobile phase pH. According to Wilson and co-workers, the HSM assumes that the major contribution of hydrophobicity to RPLC retention is subtracted first, in order to better see the remaining contributions to retention from other solute-stationary phase interactions [31, 32, 37].
The relative importance of each type of interaction in the HSM to retention has also been investigated. Results have shown that the contribution of the hydrophobicity term in retention is the largest, as expected from the nature of RPLC separation [29, 30, 33]. The relative importance of other types of interaction is dependent on the particular solutes [29, 30, 33]. Given this fact, the Eq. 1.3 can be transferred into an approximate HSM (see Eq. 1.4),
log 𝛼 log (𝑘𝑘
EB) ≈ 𝜂
′𝐇 1.4
Where only the hydrophobicity is considered as the primary contribution to the retention of compounds in RPLC. The HSM was originally developed for column selectivity, now it has been intensively used to select the equivalent or orthogonal columns for the separation of compounds of interest.
1.5.2 Column selectivity using the HSM
One of the most important applications of the HSM is column selectivity in RPLC. In the original work, the contribution of the various terms of Eq. 1.3 to column selectivity was investigated [29, 30, 33]. The hydrophobicity term is the least important contribution to changes in column selectivity, as the term of hydrophobicity is highly correlated with the retention [29, 30, 33]. Apart from hydrophobicity, each of the remaining terms of Eq. 1.3 can be important in determining column selectivity [31, 32, 37]. Until now, the HSM has been used in many fields with different applications in chromatography. However, it is worth pointing out that the most important focus of the HSM is mainly on the selection of “equivalent” columns to obtain the same separation through the use of a column comparison function based on the values of H, S, A, B, and C for two columns, or the selection of columns with very different selectivity for the development of orthogonal RPLC methods and two-dimensional (2D) separation [32, 127]. For example, an on-line column selectivity database for column comparison has been created based on the HSM. By using a calculated similarity factor (Fs)
20
𝐹𝑠= √(𝑤𝐻(𝐻1− 𝐻2))2+ (𝑤𝑆(𝑆1− 𝑆2))2+ (𝑤𝐴(𝐴1− 𝐴1))2+ (𝑤𝐵(𝐵1− 𝐵2))2+ (𝑤𝐶2.8(𝑐2.81− 𝑐2.82))2 1.5Where the H, S, A, B, and C are the column coefficients in the HSM for the column 1 and column 2, w is the weighting factor for the difference in each term of column coefficients for column 1 and column 2 [32, 87].
1.5.3 Retention prediction using the HSM
As mentioned previously, the HSM was not originally aimed to facilitate retention prediction, but a prediction accuracy of ±1-2% in k is claimed using this model suggesting that it has great potential for the purpose of retention prediction as well [29, 32]. Additionally, such a high level of accuracy indicates that the major contributors to the retention mechanism in RPLC have been considered. At this time, column coefficients for nearly 700 commercial C8 and C18 silica-based columns characterised using this HSM are available through an open-access database hosted by the U.S. Pharmacopeia Convention (USP) website [38, 72, 86]. Therefore, there is a unique opportunity for predicting the retention of potentially any given compound on all of the characterised columns, provided that the compound coefficients of the HSM are available.
1.6 Non-Targeted Metabolomics
1.6.1 Concept and background
Metabolomics studies can be targeted and non-targeted [128-130]. For targeted metabolomics, predefined metabolite-specific signals are often used for the quantitative measurement of a select group of known metabolites [129, 130]. In contrast, NTM involves high-throughput and comprehensive analysis of all the measurable analytes present in a given sample, thus it must be coupled to additional methods for subsequent interpretation by means of in silico or experimental routines [90, 130].
21
As Figure 1.6 shows, for targeted metabolomics, the identity of the metabolites of interest is the first step, followed by data acquisition where multiple simultaneous fragmentations are generated and analysed [130, 131]. The last step is data analysis and data interpretation. The process in NTM is quite different (Figure 1.6). Steps include sample selection and pre-treatment, sample analysis using NMR or MS coupled with separation techniques, data treatment and statistics, and finally, the identification and interpretation of metabolites using a commercial database or other analytical tools [132, 133].In NTM, the ultimate goal is the identification of metabolites, allowing analytical data to be converted into meaningful biological knowledge [134-136]. However, a confident and unequivocal structure identification requires significant effort, which is multiplied dramatically in NTM where metabolites cover a diverse chemical space [130, 137]. Although integrated strategies like MS/NMR can provide much information for the identification of metabolites, authentic pure chemical standards of the metabolites of interest are still needed for unequivocal identification [28, 41, 134, 135]. At present, structure identification in NTM has remained costly, time-consuming, and frequently unsuccessful. This is because the process is complex and highly dependent on the robustness of the analytical platform and methods applied, as well as the databases and resources used for mass-based searching [132, 133, 138]. Metabolomics samples are typically complex and there are multiple interactions between metabolites in biological states, therefore, confident identification is still the bottleneck in NTM analysis.
1.6.2 Metabolite identification in NTM
22
differently in biological systems but similarly in analytical platforms with respect to mass, which increases the probability of misidentification [28, 141, 142]. In this thesis, retention prediction QSRR models are explored that offer useful predictive ability for compounds having the same molecular weight, allowing false positives to be removed during the interpretation of structure identification in NTM.1.7 Aims of project
The first goal of this project is to develop predictive QSRR strategy, enabling rapid method development in RPLC to speed up the scoping phase of chromatographic method development. The second goal is using the proposed QSRR strategy to remove false positives in NTM, enhancing the confidence and accuracy of metabolite identification. The research comprised a series of highly integrated research topics which cover the areas of structure-retention relationships for the RPLC mode, selection of the stationary phases based on predicted retention, co-elution prediction using the proposed strategy, and elimination of false positive identifications in NTM.
Aim 1: To build QSRR models based on molecular descriptors computed from chemical structures utilising a combination of GA and PLS, allowing the scoping phase of method development in RPLC to be accelerated for target analytes.
Aim 2: To develop strategies to improve the accuracy and predictivity of QSRR models using a combination of the concepts of structural similarity and chromatographic similarity. The employed strategies are to be based on different similarity filters combined with several approaches for compound classification to yield training sets for the construction of local QSRR models.
Aim 3: To establish QSRR models by predicting five solute coefficients (η’, σ’, β’, α’, and
κ’) in the HSM using the proposed QSRR strategy, allowing the retention of compounds of interest to be accurately predicted. The great advantage of QSRR modelling for the solute coefficients of analytes, is that nowadays over 700 columns in RPLC have been characterised by the HSM, and the parameters (H, S, A, B, and C) for all of those columns are available on an open database. So, there is a unique opportunity for predicting the retention of potentially any given solute on all of the characterised columns, albeit under only one isocratic condition, provided that the HSM solute coefficients can be accurately predicted for that solute.