EFFECT OF THE GREEN TEA
POLYPHENOL, EGCG, ON INSULIN
SENSITIVITY
by
Huei Leng Helena Ng, BBiotech (Hons)
A thesis submitted in fulfilment of the requirements for the degree of
Doctor of Philosophy (Medical Research)
Menzies Research Institute Tasmania
University of Tasmania
April 2014
i | P a g e
Table of contents
Table of contents ... i
List of Figures... vi
List of Tables ... viii
Statement.. ... ix
Authority of Access ... ix
Abstract…... x
Acknowledgement ...xii
Abbreviations ... xiii
Preface... ... xvi
Chapter 1 Introduction ... 1
1.1 Insulin ... 2
1.1.1 Signalling pathway of insulin ... 3
1.1.2 Haemodynamic actions of insulin ... 3
1.1.2.1 Insulin signalling in vascular endothelium ... 3
1.1.2.2 Insulin-mediated vasodilation ... 6
1.1.2.3 Vascular distribution in skeletal muscle ... 7
1.1.2.4 Insulin-mediated microvascular recruitment ... 10
1.1.3 Metabolic actions of insulin ... 12
1.2 Insulin resistance ... 13
1.3 Tea derived from Camellia sinensis ... 16
1.3.1 Health benefits of polyphenols ... 17
1.3.2 Green tea ... 19
1.4 Green tea and type 2 diabetes ... 21
1.4.1 Epidemiology studies ... 21
1.4.2 Clinical studies ... 22
1.4.2.1 Oolong Tea ... 22
1.4.2.2 Green tea ... 22
1.4.3 Animal studies ... 24
1.4.3.1 Studies in healthy animals ... 25
1.4.3.2 Studies in insulin resistant animals... 26
ii | P a g e
1.5.1 Metabolic actions of EGCG ... 30
1.5.2 Vascular actions of EGCG ... 31
1.6 Study aims ... 33
Chapter 2 Methods & materials ... 34
2.1 Materials ... 35
2.2 Animal care ... 35
2.3 Isolated constant-flow perfused rat hindlimb procedure ... 36
2.3.1 Perfusion buffer ... 36
2.3.2 Animal surgery ... 37
2.3.3 Perfusion apparatus ... 37
2.4 In vivo experiment in anaesthetized rats ... 40
2.4.1 Animal surgery ... 40
2.4.2 Hyperinsulinaemic euglycaemic clamp ... 43
2.4.3 Glucose and lactate determination... 43
2.4.4 Plasma insulin determination ... 43
2.4.5 Plasma free fatty acids determination... 44
2.4.6 Determination of plasma EGCG levels ... 45
2.4.7 Measurement of muscle microvascular perfusion ... 45
2.4.8 Muscle-specific glucose uptake ... 50
2.5 Akt Western blot... 51
2.6 Statistical analysis ... 52
Chapter 3 Direct metabolic and vascular effects of EGCG in rat skeletal muscle ... 53
3.1 Introduction ... 54
3.2 Methods ... 55
3.2.1 Animals ... 55
3.2.2 Constant-flow perfused rat hindlimb: Metabolic studies ... 56
3.2.2.1 Protocol 1... 56
3.2.2.2 Protocol 2... 57
3.2.2.3 Hindlimb glucose uptake ... 59
3.2.2.4 Muscle-specific glucose uptake (R’g) ... 59
3.2.3 Constant-flow perfused rat hindlimb: Vascular studies ... 59
3.2.4 Statistical analysis ... 61
iii | P a g e
3.3.1 Metabolic effects of EGCG in perfused rat hindlimbs ... 61
3.3.2 Vascular effects of EGCG in perfused rat hindlimbs ... 67
3.3.2.1 Low dose NE (0.6 µM, Type A vasoconstrictor) ... 67
3.3.2.2 High dose NE (5 µM, Type B vasoconstrictor) ... 67
3.3.2.3 5-HT (Type B vasoconstrictor) ... 68
3.4 Discussion... 70
3.4.1 Metabolic studies ... 70
3.4.2 Vascular studies ... 71
Chapter 4 Mechanism of EGCG-induced vasodilation in muscle vasculature ... 75
4.1 Introduction ... 76
4.2 Methods ... 79
4.2.1 Animals ... 79
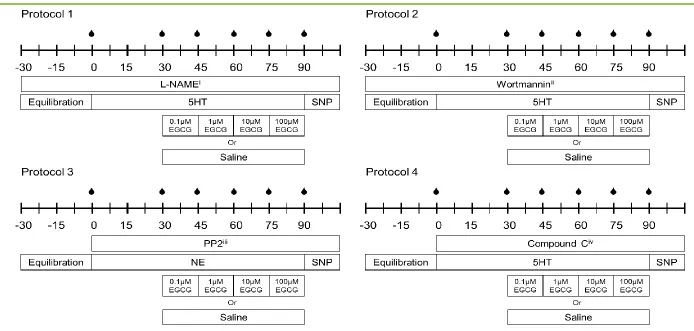
4.2.2 Experimental protocols ... 79
4.2.3 Metabolic actions of wortmannin in constant perfused rat hindlimbs ... 83
4.2.4 AMPK Western blot ... 85
4.2.5 Statistical analysis ... 85
4.3 Results ... 86
4.3.1 Effects of NOS inhibition on EGCG-mediated vasodilation ... 86
4.3.2 Effects of PI3-K inhibition on EGCG-mediated vasodilation ... 86
4.3.3 Effects of SFKs inhibition on EGCG-mediated vasodilation ... 87
4.3.4 Effects of AMPK inhibition on EGCG-mediated vasodilation ... 88
4.4 Discussion... 95
Chapter 5 Acute effects of EGCG in healthy rats in vivo... 98
5.1 Introduction ... 99
5.2 Methods ... 100
5.2.1 Animals ... 100
5.2.2 Experiment protocol ... 101
5.2.3 Pharmacokinetics of intravenously administered EGCG ... 103
5.2.4 Statistical Analysis ... 103
5.3 Results ... 105
5.3.1 Animal characteristics ... 105
5.3.2 Whole body insulin sensitivity ... 105
iv | P a g e
5.3.4 Microvascular blood volume ... 110
5.3.5 Muscle insulin sensitivity ... 110
5.4 Discussion... 114
Chapter 6 Acute effects of EGCG in insulin resistant rats in vivo ... 117
6.1 Introduction ... 118
6.2 Methods ... 119
6.2.1 Animals ... 119
6.2.2 Experimental protocol ... 120
6.2.2.1 Constant-flow perfused rat hindlimb ... 120
6.2.2.2 In vivostudy ... 122
6.2.3 Statistical Analysis ... 123
6.3 Results ... 123
6.3.1 Animal characteristics ... 123
6.3.2 Vascular actions of EGCG in the perfused rat hindlimb ... 124
6.3.3 Acute effects of EGCG in insulin resistant rats in vivo ... 126
6.3.3.1 Whole body insulin sensitivity ... 126
6.3.3.2 Haemodynamic parameters ... 128
6.3.3.3 Muscle microvascular perfusion... 131
6.3.3.4 Muscle insulin sensitivity ... 133
6.4 Discussion... 135
Chapter 7 Chronic effects of EGCG in insulin resistant rats in vivo ... 139
7.1 Introduction ... 140
7.2 Methods ... 141
7.2.1 Animals ... 141
7.2.2 Experimental protocol ... 142
7.2.3 Western blot ... 145
7.2.4 Statistical analysis ... 145
7.3 Results ... 146
7.3.1 Animal characteristics ... 146
7.3.2 Chronic effects of EGCG on whole body insulin sensitivity in insulin resistant rats ... 150
7.3.3 Chronic effects of EGCG on haemodynamic parameters in vivo... 152
7.3.4 Chronic effects of EGCG on muscle microvascular perfusion in vivo. ... 155
v | P a g e
7.4 Discussion... 159
Chapter 8 Discussion ... 164
8.1 Summary of findings ... 165
8.2 Vascular actions of EGCG in skeletal muscle ... 165
8.3 Metabolic actions of EGCG in skeletal muscle ... 169
8.4 Implications ... 174
8.5 Limitations and future directions... 178
8.6 Conclusion ... 180
vi | P a g e
List of Figures
Figure 1.1 Insulin signalling pathway. ... 5
Figure 1.2 Schematic diagram of nutritive and non-nutritive flow routes in muscle ... 9
Figure 1.3 Natural history of type 2 diabetes. ... 15
Figure 1.4 Polyphenol classification. ... 18
Figure 1.5 Major flavan-3-ols and their chemical structure in green tea. ... 20
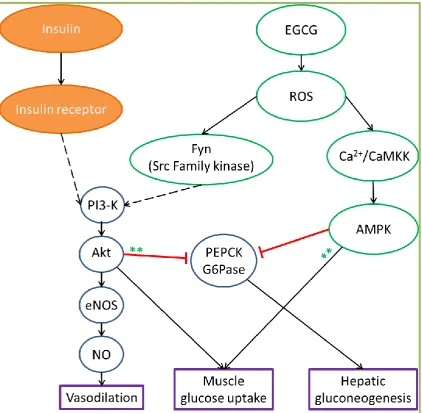
Figure 1.6 Mechanism of action of EGCG in various tissues ... 32
Figure 2.1 Schematic diagram of surgically isolated flow to rat single hindlimb. ... 38
Figure 2.2 Perfusion apparatus. ... 39
Figure 2.3 Schematic diagram of the surgical cannulations for in vivo experiments. .... 42
Figure 2.4 Example of (A) ultrasound and (B) contrast enhanced ultrasound images of the upper thigh of the rat hindlimb in short axis ... 47
Figure 2.5 Contrast enhanced ultrasound images at different time points of microbubble infusion. ... 48
Figure 2.6 Representative microbubble replenishment curve. ... 49
Figure 3.1 Experimental protocols of perfused rat hindlimb metabolic studies ... 58
Figure 3.2 Experimental protocol of perfused rat hindlimb vascular studies ... 60
Figure 3.3 Dose-response effects of EGCG on hindlimb glucose uptake in 9FD rats ... 63
Figure 3.4 Effect of EGCG on 3H-2-DG muscle glucose uptake in 9FD rats ... 64
Figure 3.5 Effect of 10 µM EGCG on hindlimb glucose uptake in 5FD rats ... 65
Figure 3.6 Effect of 10 µM EGCG on 14C-2-DG muscle glucose uptake in 5FD rats ... 66
Figure 3.8 Schematic illustration of the two blood flow circulations in skeletal muscle – the nutritive and non-nutritive blood flows ... 72
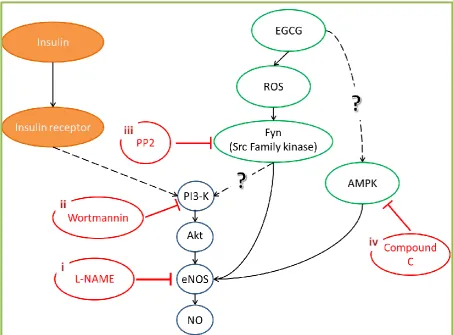
Figure 4.1 Potential pathways of EGCG mediated vasodilation in vascular endothelium of skeletal muscle ... 78
Figure 4.2 Experimental protocols ... 81
Figure 4.3 Schematic illustration of potential mechanism of EGCG-mediated vasodilation in skeletal muscle ... 82
Figure 4.4 Effects of wortmannin on muscle glucose uptake ... 84
Figure 4.5 Dose-response effects of EGCG on % vasoconstriction in 5-HT pre-constricted hindlimb during NO synthase inhibition in the presence of L-NAME ... 89
vii | P a g e
Figure 4.7 Effects of PI3-K inhibition by 100 nM wortmannin on muscle glucose
uptake ... 91
Figure 4.8 Dose-response effects of EGCG on % vasoconstriction in high dose NE pre-constricted hindlimb during SFK inhibition in the presence of PP2 ... 92
Figure 4.9 Dose-response effects of EGCG on % vasoconstriction in 5-HT pre-constricted hindlimb during AMPK inhibition in the presence of Compound C ... 93
Figure 4.10 Ratio of pAMPK/AMPKtotal in common iliac arteries following 10 µM compound C treatments ... 94
Figure 5.1 Experimental protocol for in vivo study in healthy animals ... 102
Figure 5.2 Plasma EGCG concentrations following the administration of 50 mg.kg-1 EGCG bolus... 104
Figure 5.3 (A) Glucose infusion rate and (B) blood glucose levels during hyperinsulinaemic euglycaemic clamp ... 106
Figure 5.4 Mean arterial blood pressure during hyperinsulinaemic euglycaemic clamp ... 108
Figure 5.5 Femoral artery blood flow at the end of experiment ... 109
Figure 5.6 Microvascular blood volume before and during hyperinsulinaemic euglycaemic clamp ... 111
Figure 5.7 Muscle 3H-2-DG uptake after hyperinsulinaemic euglycaemic clamp ... 112
Figure 5.8 Western blot of pAkt and total Akt in skeletal muscle ... 113
Figure 6.1 Experimental protocol of perfused rat hindlimb vascular studies ... 121
Figure 6.2 Experimental protocol for in vivo study in insulin resistant animals ... 122
Figure 6.3 Dose-response effects of EGCG on % vasoconstriction during 5-HT infusions in insulin resistant rat hindlimbs ... 125
Figure 6.4 Acute effects of EGCG on whole body insulin sensitivity in insulin resistant rats ... 127
Figure 6.5 Effects of EGCG on haemodynamic parameters in insulin resistant rats ... 129
Figure 6.6 Femoral artery blood flow at the end of experiment in insulin resistant rats ... 130
Figure 6.7 Microvascular blood volume before and during hyperinsulinaemic euglycaemic clamp in insulin resistant rats ... 132
Figure 6.8 Muscle 14C-2-DG uptake at the end of hyperinsulinaemic euglycaemic clamp in insulin resistant rats ... 134
Figure 7.1 Experimental protocol for in vivo study in chronic EGCG-treated animals ... 143
viii | P a g e
Figure 7.3 Rat body weight during dietary intervention ... 147
Figure 7.4 Food (A) and energy (B) intake of rats during dietary intervention ... 148
Figure 7.5 Water (A) and EGCG (B) intake of rats during dietary intervention... 149
Figure 7.6 Chronic effects of EGCG on whole body insulin sensitivity in insulin resistance rats... 151
Figure 7.7 Chronic effects of EGCG on haemodynamic parameters ... 153
Figure 7.8 Chronic effects of EGCG on femoral artery blood flow at the end of hyperinsulinaemic euglycaemic clamp in insulin resistant rats ... 154
Figure 7.9 Microvascular blood volume during hyperinsulinaemic euglycaemic clamp ... 156
Figure 7.10 Muscle 14C-2-DG uptake after hyperinsulinaemic euglycaemic clamp .... 157
Figure 7.11 Western blot of insulin signalling in skeletal muscle ... 158
Figure 8.1 Vascular and metabolic actions of EGCG in vivo. ... 177
List of Tables
Table 1.1 Composition of major polyphenols in green tea ... 20Table 1.2 Summary of acute and chronic effects of EGCG in human and animal studies ... 29
Table 2.1 Macronutrient content of experimental diets... 36
Table 6.1 Animal characteristics following 3 – 4 weeks of HFD treatment ... 124
ix | P a g e
Statement
The work in the present thesis has exclusively been for the use of a Ph.D. in the area of biomedical research. The data in this thesis has not been used for any other higher degree or graduate diploma in any other university. All experimental and written work is my own, except which has been referenced accordingly and all experimental work abides by the Australian ethical conduct codes regarding animal experimentation.
Helena Ng Huei Leng
Authority of Access
This thesis may be made available for loan and limited copying and communication in accordance with the Copyright Act 1968
x | P a g e
Abstract
Insulin resistance contributes to and precedes the development of type 2 diabetes.
Insulin-stimulated microvascular perfusion and glucose uptake in skeletal muscle are
important components of glucose homeostasis, and are impaired during insulin
resistance. Epidemiological studies suggest that regular green tea consumption may
lower the risk for developing type 2 diabetes. Whether green tea or its components
could be used as an alternative treatment for type 2 diabetes is not known. The primary
aim of this thesis was to investigate the effects of epigallocatechin gallate (EGCG), a
green tea polyphenol, on vascular function and glucose metabolism in skeletal muscle.
The direct vascular and metabolic actions of EGCG in skeletal muscle were assessed in
situ using the isolated, constant-flow perfused rat hindlimb. In this study, four different
doses of EGCG were studied: 0.1, 1, 10, and 100 µM. EGCG (1 – 10 µM) caused nitric
oxide synthase (NOS)-dependent vasodilation against 5-hydroxytryptamine (5-HT).
However, EGCG-mediated vasodilation was independent of PI3-kinase or AMP-kinase
activation. EGCG had no direct effects on muscle glucose uptake in the presence or absence of insulin at any of the doses tested. This indicates that EGCG has direct
vascular, but not metabolic, actions in skeletal muscle.
Since EGCG had direct vascular effects in muscle its effects on microvascular
perfusion and insulin-mediated glucose metabolism in vivo were then investigated. The
acute and chronic effects of EGCG on vascular function and glucose metabolism were
investigated in normal healthy and diet-induced insulin resistant rats in vivo under
anaesthesia. Hyperinsulinaemic euglycaemic clamp was used to determine the acute
and chronic effects of EGCG on whole body insulin sensitivity. In the acute studies,
EGCG was infused intravenously to increase plasma EGCG to 10 µM. Acute EGCG
stimulated muscle microvascular perfusion in both healthy and insulin resistant rats, but
was not additive to insulin-stimulated microvascular perfusion. Acute EGCG did not
stimulate muscle glucose uptake or enhance insulin-stimulated muscle glucose uptake.
However, acute EGCG treatment improved whole body insulin sensitivity (glucose
xi | P a g e
In the chronic studies, high fat-fed rats were given EGCG in their drinking water (200
mg.kg-1.d-1) for 4 weeks to determine whether EGCG could prevent the development of
insulin resistance. Chronic EGCG treatment improved whole body insulin sensitivity
(GIR) by 21% and insulin-stimulated muscle glucose uptake by 67%. However, chronic
EGCG treatment had no effect on muscle microvascular perfusion. This suggests that
chronic EGCG treatment improved glucose metabolism, without altering vascular
function of insulin resistant rats.
The data from this thesis demonstrate that acute and chronic EGCG treatment exhibit
distinct vascular and metabolic effects in vivo in rats. Acute EGCG treatment
stimulated microvascular perfusion, but not glucose uptake in skeletal muscle. Chronic
EGCG treatment improved whole body and muscle insulin sensitivity, but not muscle
microvascular perfusion. Together these data provide a mechanistic insight into the
potential anti-diabetic effects of chronic EGCG treatment, and support its development
as a promising new therapeutic agent for prevention of insulin resistance and type 2
xii | P a g e
Acknowledgement
First of all, I would like to extend my sincere thanks to my primary supervisor Dr.
Michelle Keske for her continual encouragement and advice in these 4 years. This
thesis would not have been possible without her help and support. I feel very fortunate
to have the opportunity to work with her.
I would also like to thank Prof. Stephen Rattigan for his technical assistance and advice,
especially at the beginning of my PhD candidature when Michelle was on maternity
leave. I would like to thank Dr. Stephen Richards for his advice and all the help with
editing the work in this thesis. “Michelle Keske is awesome! So does Steve(s)!”
I would also like to thank many past and present members of the muscle research group,
including Eloise Bradley, Dino Premilovac, Renee Dwyer, Carol Bussey, Hamish Scott,
James Peters, Katherine Roberts-Thomson, Sarah Blackwood, Aascha Brown, and
Barbara Arnts for their helpful suggestions and friendship. Special thanks also go to the
collaborators of this project, Prof. Michael Quon and Dr. Ranganath Muniyappa for
their advice and sponsorship of the EGCG. I wish to thank all the staff at the animal
facility for their hardwork. Special thanks to Diabetes Tasmania for their support in the
past 4 years.
Last but not least, thanks to my family and friends for their never-ending love, support
xiii | P a g e
Abbreviations
AMP Adenosine monophosphate
AMPK Adenosine monophosphate-activated protein kinase
ANOVA Analysis of variance
APS Adapter protein with pleckstrin homology and Src homology 2 domains
CAM Complementary and alternative medicine
CAMK Calmodulin-dependent protein kinase
CAMKK Calmodulin-dependent protein kinase kinase
CEU Contrast enhanced ultrasound
dpm Disintegration per minute
EGCG Epigallocatechin gallate
ELISA Enzyme-linked immunosorbent assay
eNOS Endothelial nitric oxide synthase
ET-1 Endothelin 1
FBF Femoral artery blood flow
GIR Glucose infusion rate
GLUT4 Glucose transporter 4
G6Pase Glucose-6-phosphatase
HbA1c Haemoglobin A1c
HDL High density lipoprotein
HFD High fat diet
HOMA-IR Homeostasis model assessment of insulin resistance
HPLC High performance liquid chromatography
IGF-1 Insulin-like growth factor 1
IRS Insulin receptor substrate
xiv | P a g e
L-NAME Nω-nitro-L-arginine-methyl ester
L-NMMA NG-monomethyl-L-arginine
MAP Mean arterial blood pressure
MAPK Mitogen-activated protein kinase
MBV Microvascular blood volume
mcad Medium chain acyl coA decarboxylase
NADPH Nicotinamide adenine dinucleotide phosphate
NE Norepinephrine
nrf nuclear respiratory factor
NO Nitric oxide
NOS Nitric oxide synthase
OLETF Otsuka Long-Evans Tokushima Fatty
PEPCK Phosphoenolpyruvate carboxykinase
PI3-K Phosphatidylinositol 3-kinase
PPARγ Peroxisome proliferator-activated receptor γ
PP2 4-Amino-3-(4-chlorophenyl)-1-(t-butyl)-1H-pyrazolo[3,4-d]pyrimidine
QUICKI Quantitative insulin sensitivity check index
R’g Rate of glucose uptake
ROS Reactive oxygen species
SEM Standard error of mean
SFK Src family tyrosine kinases
SHRs Spontaneously hypertensive rats
SNP Sodium nitroprusside
TNFα Tumour necrosis factor α
ucp Uncoupling protein
VD Volume of distribution
xv | P a g e
1-MX 1-methylxanthine
2-DG 2-deoxyglucose
xvi | P a g e
Preface
Some of the data obtained in the present thesis has been published or presented at
scientific meetings and are listed below.
Publications
Premilovac D, Bradley EA, Ng HLH, Richards SM, Rattigan S and Keske MA. Muscle insulin resistance resulting from impaired microvascular insulin sensitivity in Sprague
Dawley rats. Cardiovascular Research. (2013) 98, 28-36 (Chapter 3)
Premilovac D, Ng HLH, Richards SM, Bradley EA, Dwyer RM, Rattigan S, and Keske MA. Role for the microvasculature in glucose uptake in skeletal muscle, in Glucose
Uptake: Regulation, Signaling Pathways and Health Implications. Nova Science
Publishers, Inc., Hauppauge, NY, USA. (2013) 109-139 (Chapter 3)
Oral presentations at conferences
Invited talk at the “International Conference on Clinical Research”. San Francisco, CA,
USA. July 2011. Keske MA, Premilovac D, Ng HLH and Rattigan S. Imaging skeletal muscle microcirculation with contrast-enhanced ultrasound: diagnostic and therapeutic
approaches to insulin resistance.
Australian Diabetes Society/Australian Diabetes Educators Association Annual
Scientific Meeting, Perth, WA, Australia. September 2011. Premilovac D, Ng HLH, Richards SM, Bradley EA, Rattigan R and Keske MA. Moderate increases in dietary fat impair microvascular and metabolic actions of insulin in skeletal muscle of Sprague
xvii | P a g e
Posters at conferences
Australian Diabetes Society/Australian Diabetes Educators Association Annual
Scientific Meeting, Sydney, NSW, Australia. September, 2010. Keske MA, Ng HLH, Scott HW, Richards SM, Muniyappa R, Quon MJ and Rattigan S. Vascular actions of
EGCG, a green tea polyphenol, in the constant-flow perfused rat hindlimb.
Experimental Biology, San Diego, CA, USA. April 2012. Richards SM, Premilovac D,
Ng HLH, Bradley EA, Rattigan S and Keske MA. Moderate increases in dietary fat impair microvascular but not myocyte actions of insulin in skeletal muscle of Sprague
Dawley rats.
Sharing Excellence in Research, Sandy Bay, TAS, Australia, September 2012. Ng HLH, Rattigan S and Keske MA. Acute metabolic and vascular actions of the green tea polyphenol EGCG in rat skeletal muscle.
Drug Discovery & Therapy World Congress 2013, Boston, MA, USA. June 2013. Ng HLH, Keske MA. Effects of the Green Tea Polyphenol Epigallocatechin 3-Gallate (EGCG) on Insulin Sensitivity.
American Diabetes Association 73rd Scientific Sessions, Chicago, IL, USA. June, 2013.
Ng HLH, Rattigan S, Richards SM, Muniyappa R, Quon MJ, and Keske MA. Chronic, but not Acute, Treatment with the Green Tea Polyphenol Epigallocatechin 3-Gallate
1 | P a g e
Chapter 1
2 | P a g e
Diabetes is a chronic disease affecting more than 371 million people globally (1).
Diabetes is characterised by high circulating glucose levels, which can lead to damage
to blood vessels, heart, eyes, kidneys, and nerves. There are three major types of
diabetes, including type-1 diabetes, type 2 diabetes, and gestational diabetes. Of all the
cases of diabetes, 85 – 95% are type 2 diabetes (1). Type 2 diabetes is associated with
older age, physical inactivity, obesity, hypertension, hypercholesterolaemia,
hyperlipidaemia, and cardiovascular disease (2). In 2012, the International Diabetes
Federation estimated as many as 183 million people worldwide with type 2 diabetes
were unaware of their conditions and therefore remained undiagnosed (1). This is
mainly due to diabetes being asymptomatic until the later stages of the disease.
Appropriate blood glucose management using lifestyle and pharmaceutical approaches
in the early stage of diabetes is vital to prevent complications that arise from this
disease.
1.1 Insulin
Insulin is a 51-amino acid hormone synthesized and secreted by pancreatic β-cells in
response to elevated blood glucose levels. It is responsible for post-prandial fuel storage,
which increases glucose uptake into insulin sensitive tissues (skeletal muscle and
adipose tissue) and reduces glucose output from liver into bloodstream. Besides its role
in regulating glucose and lipid metabolism, insulin also has important haemodynamic
3 | P a g e
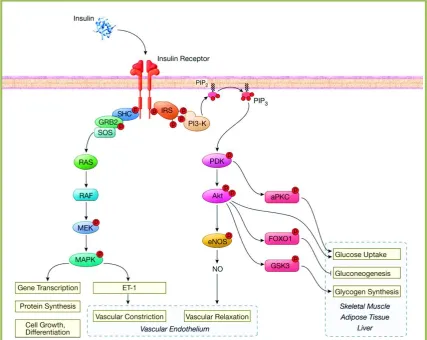
1.1.1 Signalling pathway of insulin
The insulin receptor is a transmembrane receptor with an extracellular ligand binding
domain and an intracellular tyrosine kinase domain. Upon activation by binding of
insulin, the insulin receptor phosphorylates insulin receptor substrate (IRS) family
members, leading to the activation of phosphatidylinositol 3-kinase (PI3-K) signalling
pathway (3). Another important action of insulin is the activation of SHC, which in turn
activates the mitogen-activated protein kinase (MAPK) branch of insulin signalling
pathway (3) (Figure 1.1).
The downstream signalling molecules of the PI3-K branch include PDK and Akt. This
PI3-K branch pathway is responsible for the metabolic actions of insulin in liver,
adipose tissue, and skeletal muscle, as well as nitric oxide (NO) production by
phosphorylation of endothelial NO synthase (eNOS) in endothelial cells to mediate
vasodilation. The MAPK branch of the insulin signalling pathway includes RAS, RAF,
MEK, and this pathway regulates mitogenesis, differentiation, and cell growth, as well
as the endothelin-1 (ET-1) production in endothelial cells to mediate vasoconstriction.
1.1.2 Haemodynamic actions of insulin
1.1.2.1 Insulin signalling in vascular endothelium
The vascular endothelium is the first tissue that insulin encounters after it is secreted by
pancreatic β-cells (4). Vascular endothelium acts primarily as a semi-permeable barrier
4 | P a g e
Furthermore, in the presence of insulin, the endothelium stimulates the production of
NO (4; 5), a potent vasodilator, and ET-1 (6), a potent vasoconstrictor (Figure 1.1). It
has been proposed that a healthy endothelium has a balanced production of NO and
ET-1 for maintaining a healthy vascular tone, and a disruption in this balance is associated
with insulin resistance, hypertension and type 2 diabetes (4; 6; 7).
In the early 2000s, Quon and colleagues elucidated the insulin signalling pathway in
vascular endothelial cells leading to NO production. To activate NO production in
vascular endothelial cells, insulin binds to the insulin receptor, which in turn
phosphorylates Tyr kinase (Figure 1.1). Activation of the insulin receptor resulting in
stimulation of the signalling cascade, involves IRS, PI3-K, PDK, and Akt. Activated
Akt phosphorylates human eNOS at Ser1177 (or Ser1179 in bovine eNOS), stimulating the
activity of eNOS and production NO from vascular endothelium (4; 5; 8-10).
In addition to the NO production, insulin stimulates 1, a potent vasoconstrictor.
ET-1 production from the vascular endothelium opposes the vasodilator actions of NO. To
date, little is known about the mechanisms of insulin-stimulated ET-1 production from
the vascular endothelium. Quon and colleagues have reported that ET-1 stimulation by
insulin in vascular endothelium is mediated via a distinct pathway from that of the
insulin-stimulated NO pathway (11-13). ET-1 stimulated by insulin is MAPK-, but not
PI3-K-dependent (11-13). Inhibition of MAPK has been reported to reduce the
5 | P a g e
[image:23.595.99.527.87.427.2]6 | P a g e
1.1.2.2 Insulin-mediated vasodilation
The vascular actions of insulin have been documented since the late 1930’s (15).
Insulin is reported to dose-dependently increase total blood flow in skeletal muscle and
this is paralleled by an increase in insulin-mediated muscle glucose uptake (16). NO
plays an important role in mediating insulin-stimulated vasodilation in skeletal muscle.
Both insulin stimulated increases muscle blood flow and muscle glucose uptake were
inhibited when NOS and NO production were inhibited by NOS inhibitors, Nω-nitro-L
-arginine-methyl ester (L-NAME) or NG-monomethyl-L-arginine (L-NMMA) (17; 18).
Therefore it has been postulated that insulin increases blood flow to skeletal muscle to
enhance the delivery of insulin and glucose to skeletal muscle, thereby increasing
glucose uptake into the skeletal muscle. Roy et al. (19) showed that NOS inhibition by
L-NAME reduced whole body glucose disposal rate and muscle glucose uptake by 16%
and 50% respectively in rats in vivo. It is important to note that NOS inhibition,
however, had no effects on basal or insulin-stimulated muscle glucose uptake in vitro in
both isolated soleus (red fibre type) and extensor digitorum longus (white fibre type)
muscles (19), indicating NOS does not play a role in myocyte insulin action.
The importance of vasodilation on glucose uptake was questioned when some
vasodilators increased total blood flow to skeletal muscle but did not enhance muscle
glucose uptake. These include adenosine (20), epinephrine (21), bradykinin (22; 23),
sodium nitroprusside (24), and low dose insulin-like growth factor 1 (IGF-1) (25). To
date, the only known vasodilator, besides insulin, that increases both total blood flow to
skeletal muscle and muscle glucose uptake was methacholine (23; 26). Baron and
colleagues (26) proposed that site-specific vasodilation may be related to the
7 | P a g e
On the other hand, other studies showed that a physiological dose of insulin (3
mU.min-1.kg-1) stimulated muscle glucose uptake without increasing total blood flow in
muscle (18; 27). Baron and colleagues proposed that insulin, besides increasing total
blood flow, could also increase capillary flow and density of perfused capillaries in
skeletal muscle, which in turn increase the perfused muscle mass that was involved in
glucose metabolism (28). The increases in capillary flow and density of perfused
capillaries have since been known as microvascular (or capillary) recruitment (Figure
1.2). However, microvascular recruitment could not be measured directly in Baron’s
study due to the lack of available techniques.
1.1.2.3 Vascular distribution in skeletal muscle
It has been generally established that, groups of capillaries, not individual blood vessels,
are the fundamental functional unit within the skeletal muscle (29; 30). Terminal
arterioles in the skeletal muscle are responsible for regulation of the blood flow
distribution of the capillaries unit (instead of each individual capillary) within the
muscle microvasculature (31; 32). It has been postulated that larger arterioles (≥ 50 µm
diameter) control the resistance, hence flow through the skeletal muscle, while distal
arterioles (~ 10 ‒ 40 µm diameter) function similar to pre-capillary sphincters that
regulate flow distribution within the muscle microvasculature (30). It is understood that
not all capillaries in a resting muscle are perfused (33; 34), instead the muscle
microvasculature undergo vasomotion (35; 36), in which the blood vessels constrict
periodically to evenly distribute blood flow through various capillary modules in
8 | P a g e
circulatory systems in skeletal muscle (37-41), which are known as the nutritive flow
route and non-nutritive flow route.
The flow distribution between the nutritive and non-nutritive flow routes in the skeletal
muscle is tightly regulated to meet the metabolic demands. The nutritive flow route is
in close contact with the myocytes, and plays an important role to supply nutrients to
the myocytes for metabolic needs (42) (Figure 1.2). The non-nutritive flow route
supplies the connective tissues in muscle (43) as well as adipocytes (44), and this flow
route has been proposed to serve as a functional reserve for the myocytes (41; 45)
(Figure 1.2). In the basal or resting states, the blood is shunted through the non-nutritive
flow route, during increased metabolic demand it now goes through the nutritive flow
route. Flow re-distribution from non-nutritive to nutritive flow routes during an
9 | P a g e
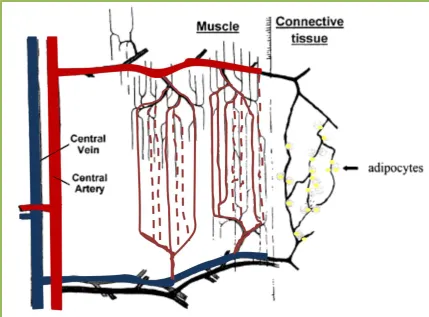
Figure 1.2 Schematic diagram of nutritive and non-nutritive flow routes in muscle.
Nutritive flow route is thought to be in close contact with the skeletal muscle cells, while non-nutritive flow route is thought to be closely associated with connective tissues such as intramuscular septa and tendons.
[image:27.595.100.530.71.388.2]10 | P a g e
1.1.2.4 Insulin-mediated microvascular recruitment
Insulin appears to increase recruitment of microvascular vessels by either maintaining
microvascular perfusion or increasing flow and thus overall increasing microvascular
perfusion. In the late 1990s, collaborating researchers from the Universities in
Tasmania and Virginia developed two major techniques to assess microvascular
perfusion in vivo in skeletal muscle (21; 42; 47): metabolism of exogenously infused
1-methylxanthine (1-MX) by xanthine oxidase (21; 27; 48-51), and contrast enhanced
ultrasound (CEU) (18; 27; 47; 48; 52; 53).
The metabolism of 1-MX, developed by Rattigan and colleagues (21), was the first
technique available for measuring microvascular perfusion. The metabolism of
exogenously infused 1-MX was used to measure the perfused capillary surface area in
muscle (also known as microvascular perfusion) (21). In the constant-flow perfused rat
hindlimb, 1-MX has no vasoactive activity (51). 1-MX is metabolised by the
endogenous enzyme xanthine oxidase present in the muscle microvasculature into
1-methylurate (54; 55). Xanthine oxidase is only present in the micro- but not
macro-vasculature, therefore higher microvascular perfusion will result in higher 1-MX
extraction. However, clearance of 1-MX from blood by other tissues (eg. liver) is very
rapid, so it is necessary to partially inhibit the endogenous xanthine oxidase activity.
Allopurinol is a specific xanthine oxidase competitive inhibitor which is metabolized to
form oxypurinol which in turn partially inhibits the xanthine oxidase activity.
Oxypurinol also lowers the KM of xanthine oxidase for 1-MX (56), allowing saturation
of xanthine oxidase even at the levels that occur with the arteriovenous difference in
1-MX across the leg muscle vascular bed, thus making 1-1-MX metabolism independent of
flow and only dependent on surface area (exposure to xanthine oxidase amount).
11 | P a g e
readily measured by reverse-phase high performance liquid chromatography (HPLC).
The disappearance (or metabolism) rate of the 1-MX is an indication of the perfused
capillary surface area in skeletal muscle.
Later, studies reported that myocardial (57) and renal (58) capillary blood volume can
be measured using CEU technique. This technique involves the simultaneous
ultrasound imaging and intravascular administration of gas-filled microbubbles. These
microbubbles have similar rheology to that of erythrocytes, and they generate an
acoustic signal during their microvascular transit through an ultrasound beam (59).
Microbubbles are infused intravenously to reach an arterial steady state concentration
before images are acquired. When steady state is achieved, microbubbles within the
imaged region are destroyed with pulses of high power acoustic energy. Following this
destructive pulse, replenishment of microbubbles provides the information about the
capillary flow rate and capillary blood volume (57; 60). This myocardial CEU
technique was then adapted for measurement of microvascular flow rate and
microvascular blood volume within the skeletal muscle microvasculature (47; 48; 61).
The use of CEU for measurement within the muscle microvasculature is described in
detail in Chapter 2.
Using these techniques, Rattigan and colleagues have reported that the insulin-mediated
microvascular recruitment in skeletal muscle is independent of the increase in total
blood flow (21) and occurs before augmentation of total blood flow (48). Furthermore,
insulin-mediated microvascular recruitment precedes the activation of insulin signalling
pathway in muscle myocytes for its metabolic action as well as insulin-mediated
muscle glucose uptake (18). One study (27) also showed that insulin dose-dependently
(1 – 10 mU.min-1.kg-1) stimulated muscle glucose uptake, however insulin-stimulated
-12 | P a g e 1
.kg-1). Epinephrine increased total blood flow similar to that of the insulin but did not
increase 1-MX metabolism and muscle glucose uptake (21). Bradykinin and
methacholine both are potent vasodilators, but only the latter increased
insulin-mediated microvascular recruitment and muscle glucose uptake (23). These findings
indicated that microvascular recruitment was potentially an important event for
stimulation of muscle glucose uptake. Studies (18; 53) have shown that when
insulin-mediated microvascular recruitment was blocked by a systemically infused nitric oxide
synthase inhibitor, L-NAME, there was a 40% reduction of muscle glucose uptake.
Taken these together, this research has shown that insulin-mediated microvascular
recruitment is NOS-dependent, and it is independent to insulin-mediated vasodilation in
larger blood vessels. Insulin-mediated microvascular recruitment significantly
contributes to insulin-stimulated muscle glucose uptake.
1.1.3 Metabolic actions of insulin
Skeletal muscle is the largest tissue in the human body and is responsible for 80 – 90%
of glucose storage in the postprandial states in healthy humans (62; 63). In order for the
muscle to store glucose as glycogen, glucose is required to be transported into muscle
cells. In the 1950s, insulin’s metabolic actions on muscle became evident when insulin
was reported to increase the rate of glucose uptake into muscle and adipose tissues (64;
65). Of all the subtypes of glucose transporters, glucose transporter type 4 (GLUT4) is
the major isoform expressed in skeletal muscle and adipose tissue, and is responsible
for the uptake of glucose molecules into these tissues (66-70). In the basal state,
GLUT4 is pooled and stored within the cell, often referred to as GLUT4 storage
13 | P a g e
is activated, which includes the activation of downstream signalling pathway PDK1 and
Akt. Following the activation of Akt, AS160 is phosphorylated and released from the
GLUT4 vesicles, resulting in docking of GLUT4 to the cell membrane (72). In addition
to promoting glucose uptake in skeletal muscle and adipose tissues, insulin regulates
glucose metabolism by decreasing gluconeogenesis and glycogenolysis in liver. Similar
to insulin action on muscle and adipose tissue, insulin action on liver is mediated via
the PI3-K signalling pathway. Following the activation of PDK1 and Akt, the
CREB/CBP/Torc2 complex is disrupted (73-75), leading to the inhibition of liver
gluconeogenic enzymes phosphoenolpyruvate carboxykinase (PEPCK) and
glucose-6-phosphatase (G6Pase) (76), resulting in inhibition of liver gluconeogenesis.
Interestingly, the pathway by which insulin mediates its metabolic actions overlaps the
insulin-mediated vasodilation pathway, suggesting there is an important association
between the insulin’s vascular and metabolic actions.
1.2 Insulin resistance
In the 1960-70s, the term “insulin resistance” was introduced and defined as a condition
where insulin loses its efficiency to stimulate glucose disposal into tissues, in particular
skeletal muscle (77). Insulin resistance is characterised by impaired glucose tolerance,
in which insulin-sensitive tissues including liver and muscle fail to response to insulin.
Insulin fails to suppress liver glucose production, and fails to increase muscle glucose
uptake. Insulin resistance is a fundamental characteristic of type 2 diabetes, and insulin
resistance usually precedes the development of type 2 diabetes (Figure 1.3).
As mentioned previously, insulin possesses important haemodynamic actions, where by
14 | P a g e
Research Institute Tasmania has reported that insulin resistance is associated with
diminished insulin-mediated microvascular perfusion (or microvascular dysfunction).
Acute insulin resistance induced by α-methylserotonin (50) and tumour necrosis factor
α (TNFα) (78; 79) reduces insulin-mediated hindleg glucose uptake and this is strongly
associated with a reduced microvascular perfusion, and is independent of femoral artery
blood flow changes. Furthermore, animal models of insulin resistance, including high
fat diet (HFD)-induced insulin resistance rats (80), obese Zucker rats (81), and Zucker
diabetic fatty (ZDF) (52) rats display impaired insulin-mediated microvascular
recruitment and muscle glucose uptake. More recently, it was reported that impaired
insulin-mediated muscle glucose uptake during mild insulin resistance states can result
from impaired insulin-mediated microvascular perfusion (82), and impairment in
insulin-mediated microvascular perfusion can be developed independently of myocyte
insulin resistance (82). Furthermore, it was showed that impaired insulin-mediated
microvascular perfusion precedes the development of macrovascular (resistance blood
15 | P a g e
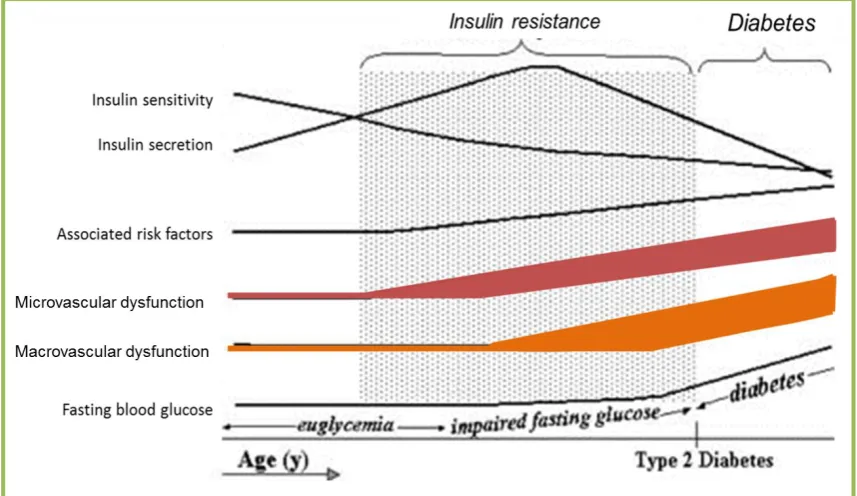
Figure 1.3 Natural history of type 2 diabetes.
Insulin resistance precedes the development of diabetes. During the early insulin resistance state, there is an elevated plasma insulin concentration to maintain normoglycaemia. However, pancreatic β-cells eventually fail to secrete an adequate amount of insulin to maintain normoglycaemia, which results in increased fasting plasma glucose concentrations. Untreated, this will progress to uncontrolled hyperglycaemia and be diagnosed as type 2 diabetes. Microvascular dysfunction is an early event in insulin resistance, and develops before macrovascular dysfunction
16 | P a g e
1.3 Tea derived from
Camellia sinensis
Currently, there are several types of medications and treatments available for blood
glucose management in diabetics. Besides the injections of incretin mimetics, in
Australia, there are six classes of oral medications used for treating type 2 diabetes,
including biguanides, sulphonylureas, thiazolidinediones, meglitinides, α-glucosidase
inhibitors, and dipeptidyl peptidase-4 inhibitors (84). However, these medications lose
their effectiveness over time, and often the doses are increased and/or used in
combination, and eventually insulin injections may be required. More recently,
complementary and alternative medicine (CAM) has increased in popularity among the
community to prevent or treat a broad range of diseases, including cardiovascular
disease, depression, stress, diabetes, etc. Tea has been used to prevent and treat a
variety of cancers, including breast (85), liver (86), and prostate (87) cancers. However,
whether or not tea should be used as a CAM for diabetes treatment remains debatable.
Tea is one of the most widely consumed beverages in the world, second only to water.
There are three major classes of tea, including green, black, and oolong, which are all
derived from the plant Camellia sinensis. Green tea and oolong tea are widely
consumed in Asian countries, while black tea is predominantly consumed in Western
countries. Since ancient times, green tea consumption has been lauded for its
health-promoting effects. Increasing evidence shows that the health-health-promoting effects of green
17 | P a g e
1.3.1 Health benefits of polyphenols
Polyphenols are found in plants, mainly in fruits (grape, blueberry, cherries, plums,
strawberries, cocoa, etc), vegetables (potato, tomato, lettuce, onion, etc) and also tea
(88; 89). Polyphenols are essential for plant morphology, growth and reproduction,
protection against ultraviolet radiation, and resistance to pathogens (90). There are a
number of factors that are known to affect the plant polyphenol content, such as plant
variety, soil composition, geographic location, weather condition, and storage
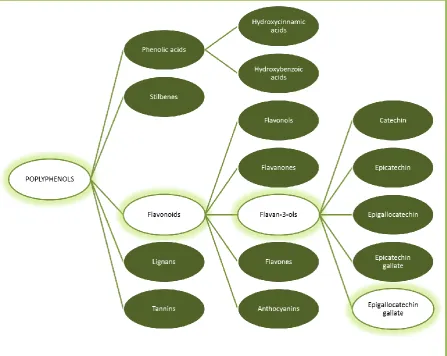
conditions (91). Polyphenols are classified according to the number of phenol rings in
their chemical structure. The five major classes of polyphenols include phenolic acids,
stilbenes, flavonoids, lignans, and tannins (88) (Figure 1.4). Accumulating evidence
shows that polyphenol-rich plants possess health-promoting effects, including cancer
prevention (92-95), neuroprotection (96; 97), improve cardiovascular and metabolic
health (98-100), and lower the risk of type 2 diabetes (101-106). Among all the
polyphenol-rich plants, green tea and its flavan-3-ols has been most extensively studied
18 | P a g e
19 | P a g e
1.3.2 Green tea
Tea is categorised into different classes based on the degree of tea fermentation (or leaf
oxidation) during processing. During tea fermentation, flavan-3-ols, the bioactive
polyphenols in tea leaves, undergo polyphenol oxidase-dependent oxidative
polymerisation, resulting in the formation of theaflavins and thearubigins (107). Green
tea is unfermented and contains the highest concentration of flavan-3-ols. Oolong tea is
a partially fermented product and therefore contains a mixture of flavan-3-ols,
theaflavins, and thearubigins. Black tea is the most fermented tea, and as a result,
contains abundant theaflavins and thearubigins, and limited or no flavan-3-ols. There
are five major types of flavan-3-ols in green tea (Figure 1.5), including catechin,
epicatechin, epicatechin gallate, epigallocatechin, and epigallocatechin gallate (EGCG).
Table 1.1 outlines the composition of the main polyphenols in green tea, where EGCG
is the most abundant polyphenols accounting for 33-50% of green tea polyphenols (107;
108).
For decades, research has been focused on the potential anti-cancer activities of green
tea and green tea polyphenols (93-95; 109; 110), where encouraging in vitro and in vivo
data have been established. Additionally, much evidence shows that green tea has
anti-inflammatory (111; 112), anti-viral (113; 114), and neuroprotective (96; 115) effects. In
recent years, extensive research has been carried out to investigate the potential
health-promoting effects of green tea in cardiovascular and metabolic health (98; 116-120).
Research suggests that the aforementioned health-promoting effects of green tea are
20 | P a g e
Figure 1.5 Major flavan-3-ols and their chemical structure in green tea. Modified from Lin et al. (107)
Table 1.1 Composition of major polyphenols in green tea.
Polyphenols % of total polyphenol
Catechin 2
Epicatechin 6
Epicatechin gallate 6-12
Epigallocatechin 20-30
[image:38.595.101.553.71.399.2]21 | P a g e
1.4 Green tea and type 2 diabetes
1.4.1 Epidemiology studies
Recently, emerging evidence from epidemiological studies show that tea (including
both green tea and black tea) consumption is associated with reduced risk for type 2
diabetes (101-106). However, this is debated as not all studies have found this
association (121; 122).
In 2009, two meta-analysis by Huxley et al. (123) and Jing et al. (124) suggested that,
compared to non-tea drinkers, tea (green and black tea) consumption of 3 – 4 cups (or
more) per day was associated with 17 – 35 % lower risk for type 2 diabetes.
Furthermore, a study in a British cohort (102) showed that tea (green and black tea)
consumption of > 3 cups per day was associated with a 34% lower risk of diabetes.
Among Japanese adults, Iso et al. (106) reported an inverse association between green
tea consumption and risk for type 2 diabetes. This study suggested that high green tea
consumption (≥ 6 cups.d-1
) lowers their risk for type 2 diabetes by 33% compared to
those who drink < 1 cup per week. Recently, a meta-analysis by Zheng et al. (125)
reported that green tea catechins treatment for ≥ 12 weeks, but not shorter term (< 12
weeks), was associated with lower fasting blood glucose. On the other hand, Oba et al.
(121) failed to uncover an association between green tea consumption and reduced risk
of diabetes in Japanese. Furthermore, the Singapore Chinese Health Study (122) did not
find an association between green tea consumption and the reduced risk for type 2
diabetes. However, these studies are correlative and do not directly address the effect of
22 | P a g e
1.4.2 Clinical studies
1.4.2.1 Oolong Tea
Some studies have assessed the metabolic effects of oolong tea in patients with type 2
diabetes. A study by Shimada et al. (126) reported that oolong tea treatment for 4
weeks significantly increased plasma adiponectin levels by 9.9% and lowered
haemoglobin A1c (HbA1c) levels by 3.3% in patients with various coronary risk factors.
There was a slight, but not significant, decrease in the plasma glucose levels. In this
study, each patient received 45.4 mg.day-1 of EGCG from the oolong tea for 4 weeks.
Hosoda et al. (127) used a higher dose of oolong tea treatment (EGCG 386 mg.d-1) for
4 weeks and reported that plasma glucose was significantly lowered in type 2 diabetes
patients compared to the control group. The mechanism of the anti-hyperglycaemic
effects of the oolong tea is unclear. However, oolong tea seemed to have a
concentration-dependent effect on glycaemic control.
1.4.2.2 Green tea
Since the 2000s, numerous clinical studies (116; 128-149) have been undertaken to
investigate the metabolic effects of green tea or green tea extracts. In healthy subjects,
acute green tea consumption was reported to enhance insulin sensitivity (148) and
glucose tolerance (147). However, Josic et al. (139) reported that acute green tea
consumption (containing 32.4 mg EGCG) did not have glucose and insulin lowering
effects. Compared to the previous 2 studies, the EGCG and total polyphenol content in
dose-23 | P a g e
dependent effect of green tea (or EGCG) on glycaemic control. Conversely, chronic
green tea extract (EGCG 150 mg.d-1) supplementation for 3 weeks lowered the total
cholesterol: HDL ratio, but had no other metabolic effects in healthy subjects (135).
Most (116; 130-134; 140-143), but not all (128; 129; 137; 149; 150), studies reported
that body weight was reduced following chronic green tea or green tea extract treatment
(range from 1 – 6 months of treatment) in overweight and obese subjects. Some studies
have reported that following green tea or green tea extract treatment, there were
reductions in plasma LDL levels (116; 130; 137; 141; 149; 150) and increased in
plasma HDL levels (134; 137; 142; 149; 150). In postmenopausal women with
impaired glucose tolerance, EGCG treatment (300 mg.d-1) for 12 weeks reduced plasma
glucose by 5% (132). Recent studies have shown that green tea extract treatment
(EGCG 208 mg.d-1) for 12 weeks reduced blood glucose (149) and insulin (150) levels
significantly in obese subjects. In contrast, EGCG treatment (800 mg.d-1) for 8 weeks
had no effects on insulin sensitivity and glucose tolerance in overweight and obese men
in another study (129).
In patients with type 2 diabetes, green tea extract (polyphenols 240 mg.d-1, EGCG
content not reported) treatment for 8 weeks increased plasma adiponectin levels
significantly (144). Another study (138) used a much higher dose of green tea extracts
(EGCG 856.8 mg.d-1 for 16 weeks) and reported the homeostasis model assessment of
insulin resistance (HOMA-IR), HbA1c, and fasting insulin levels were reduced
significantly in type 2 diabetic patients. Furthermore, waist circumferences in the
subjects treated with green tea extracts were reduced by 3%. Conversely, Ryu et al.
(146) showed that metabolic markers including blood lipids, glucose, insulin, and
adiponectin levels were not altered following 4 weeks of green tea treatment
24 | P a g e
treatment (544 mg.d-1 polyphenols, EGCG content unknown) for 2 months had no
apparent effects on metabolic markers such as fasting serum glucose and insulin,
HbA1c, and HOMA-IR.
Overall, the outcomes from the different clinical trials have not been conclusive. The
discrepancies between results are likely due to small study populations, poor diet
control during the study period, poor oral bioavailability of catechins (151-155), and/or
poor study design. Nonetheless, Brown et al. (129) suggested that EGCG
supplementation may play a more important role in prevention of insulin resistance and
type 2 diabetes rather than as a therapeutic treatment for these conditions. Table 1.2
summarizes the acute and chronic effects of EGCG in human. Taken together, these
data indicate that animal studies are essential in order to effectively assess the dosage
and mechanism of actions of EGCG to optimally design clinical trials.
1.4.3 Animal studies
Several studies have investigated the anti-diabetic effects of green tea in rodents,
including normal healthy (156-158), and insulin-resistant models, such as fructose fed
rodents (159; 160), high-fat fed mice (98; 158; 161-163), diabetic (db/db) mice (147;
164; 165), ZDF rats (164), spontaneously hypertensive rats (SHRs) (120), and Otsuka
Long-Evans Tokushima Fatty (OLETF) rats (166; 167). Table 1.2 summarizes the acute
25 | P a g e
1.4.3.1 Studies in healthy animals
In healthy rats, green tea treatment for 3 weeks significantly reduced both the
epididymal and abdominal adipose tissue weight (157). Besides that, plasma lipid
profile, including free fatty acids, total cholesterol, HDL and LDL were significantly
lowered by chronic green tea treatment. Interestingly, this study showed that following
green tea treatment, muscle glucose uptake and GLUT4 translocation were significantly
enhanced (157). In this study, total plasma EGCG levels reached ~40 nM, however, the
amount of catechins provided to the rats were not detailed. Another study by Wu and
Colleagues (156) showed that following 12 weeks of green tea treatment (mixed
catechins 56 mg.d-1, EGCG 37.5 mg.d-1) in rats, significantly lowered fasting plasma
glucose, insulin, free fatty acid, and triglyceride levels . In addition, glucose tolerance
and insulin sensitivity in these rats were enhanced following the green tea treatment,
and this might be in part attributable to the increased insulin sensitivity in adipocytes
(156). Interestingly, Ashida et al. (157) showed that glucose uptake in adipose tissue
was reduced by 80% following green tea treatment, while the former study (156)
showed a 40% increase in glucose uptake in adipocytes. In mice fed green tea (EGCG
610 mg.L-1) for 14 weeks, fasting blood glucose levels were lowered while serum lipid
levels were not affected (158). In addition, glucose tolerance and muscle glucose
uptake in these green tea treated mice were not altered but the adipose tissue glucose
uptake was significantly reduced (158). It is too early to draw conclusions on the effects
26 | P a g e
1.4.3.2 Studies in insulin resistant animals
Green tea, green tea extract or EGCG treatments have been reported to ameliorate
diet-induced insulin resistance in rodents (98; 158-163) and genetically-derived diabetes in
rats (120; 147; 164-167). Green tea treatment (EGCG 1 g.L-1 in drinking water) for 12
weeks improved glucose tolerance in fed rats (159). Green tea treated
fructose-fed rats have lower fasting plasma triglycerides than non-treated rats (159). Besides that,
insulin mediated GLUT4 translocation and glucose uptake in adipocytes in the
fructose-fed rats were restored by green tea treatment (159). Another study showed that green
tea treatment (EGCG 150 or 300 mg.kg-1.d-1) dose-dependently reversed insulin
resistance induced by fructose-fed in hamster (160). In this study, animals were fed
with fructose for 2 weeks before green tea was administered with the fructose for a
further 4 weeks. This study (160) reported that green tea (or EGCG) dose-dependently
increased fasting serum adiponectin, reduced fasting serum insulin and triglycerides,
while having no effect on fasting glucose levels. Similarly, Bose et al. (161) treated
insulin resistant mice for 4 weeks with EGCG (3.2 g.kg-1 diet) after 9 weeks of high fat
feeding, and reported a significant reduction in fasting blood glucose following the
EGCG treatment (insulin levels not reported). However, the food intake of the mice
was not reported, and therefore it is unclear how much food (EGCG) was consumed by
the mice each day. Studies by Li et al. (160) and Bose et al. (161) suggested that insulin
resistance could be reversed by EGCG treatment in a dose-dependent fashion.
Several studies have assessed the chronic (10 – 24 weeks) metabolic effects of green
tea or EGCG in high fat-fed rodents. Chronic green tea treatment in high fat-fed mice
for 14 weeks (EGCG 609.7 mg.L-1) (158) and 22 weeks (EGCG 2 mg.kg-1.d-1) (162)
have significantly reduced body weight and adipose tissue weight, improved glucose
27 | P a g e
fasting plasma glucose. Similar findings were reported (161) where chronic EGCG
treatment (3.2 g.kg-1 diet) for 16 weeks in high fat-fed mice reduced body weight,
adipose tissue weight, fasting plasma glucose, insulin, and HOMA-IR. Body weight
and adipose tissue weight reduced significantly in high fat-fed mice following 10 weeks
of EGCG treatment (50 mg.kg-1.d-1) (163). Besides that, EGCG treatment (163)
lowered fasting serum glucose and insulin in high fat-fed mice, thus improved
quantitative insulin sensitivity check index (QUICKI, a surrogate index of insulin
sensitivity). In these chronic studies (158; 161-163), the effects of green tea or EGCG
treatment on body weight and fasting plasma glucose were apparent from week 7
onwards. On the other hand, chronic green tea (polyphenol content not reported) and
EGCG (1 mg.kg-1.d-1) treatment for 24 weeks in high fat-fed rats did not alter body
weight, but increased fat-free mass significantly (98). In the high fat-fed rats, plasma
biochemistries including glucose, HDL, LDL and triglycerides were not altered by
green tea or EGCG treatment (98). However, green tea or EGCG treatment
significantly improved glucose tolerance in the high fat-fed rats (98). Given the similar
metabolic effects of the green tea and EGCG in these studies, this suggested that the
amelioration of high fat-induced insulin resistance by green tea treatment might be
attributed to EGCG.
One study (164) showed that db/db mice, a type 2 diabetes mouse model, treated with
EGCG (100 mg.kg-1.d-1) for 2 weeks improved glucose tolerance, while EGCG
treatment at a lower dose (30 mg.kg-1.d-1) was not as effective. Wolfram et al. (164)
also showed that EGCG treatment for 7 weeks could dose-dependently (EGCG 0.25 – 1
g.kg-1 diet) improve glucose tolerance and reduced plasma glucose in db/db mice.
Another study (165) also reported that db/db mice treated with EGCG (1 g.kg-1 diet) for
28 | P a g e
Interestingly, acute green tea treatment (mixed catechins 21.6 mg.kg-1, EGCG 16.8
mg.kg-1) lowered the blood glucose in db/db mice, but not wild type mice (147).
SHRs (7) and OLETF rats (168) are insulin resistant animal models with endothelial
dysfunction. Green tea catechins and EGCG have been reported to improve endothelial
function in SHRs (120; 169) and OLETF rats (166; 167). EGCG treatment (200
mg.kg-1.d-1) for 3 weeks reduced fasting plasma glucose, increased QUICKI and plasma
adiponectin in SHRs (120). EGCG treatment prevented the development of insulin
resistance and reduced systolic blood pressure significantly in SHRs (120). Recently,
Jang et al. (163) showed that EGCG treatment (50 mg.kg-1.d-1) for 10 weeks improved
high fat diet-induced endothelial dysfunction in mice. In OLETF rats, green tea
catechins (25 – 30 mg.kg-1.d-1) treatment for 12 weeks lowered blood pressure and
fasting blood glucose and insulin in the rats (166; 167). Green tea catechins reduced the
reactive oxygen species (ROS) formation and vascular activity of nicotinamide adenine
dinucleotide phosphate (NADPH) oxidase in thoracic aorta of OLETF rats (166; 167).
TNFα administration, which induces NADPH oxidase and the formation of ROS (170;
171), has been reported to inhibit insulin-mediated microvascular recruitment (78; 79)
and impair endothelial function during insulin resistant state (170; 171). These studies
implicated that EGCG could prevent the development of insulin resistance by
improving endothelial function. A major limitation in most of these aforementioned
animal and human studies is the lack of reporting on circulating concentrations of
29 | P a g e
Table 1.2 Summary of acute and chronic effects of EGCG in human and animal studies.
Treatment details (eg. dose, length, and animal models) are described in 1.4.2 and 1.4.3. OGTT: oral glucose tolerance test; ↑: improve; ↓: reduce; --: no effects
Treatment Subjects Effects Ref
Human
Acute Healthy ↑ OGTT ↑ Insulin sensitivity
147
148
Chronic
Healthy -- 135
Obese
↓ Fasting plasma glucose ↓ Fasting plasma insulin
↓ HOMA-IR
149
150
149; 150
Type 2 diabetes ↓ Fasting plasma insulin
↓ HOMA-IR 138
Animal
Acute
Healthy -- 147; 238
Insulin
resistance ↑ OGTT 238
Type 2 diabetes ↓ Fasting blood glucose 147
Chronic
Healthy ↓ Fasting plasma glucose
↓ Fasting plasma insulin 156; 158
Insulin
resistance
↓ Body weight ↓ Adipose tissue weight ↓ Fasting plasma glucose
↓ Fasting plasma insulin ↑ OGTT
↑ QUICKI ↑ Endothelial function
158; 161-163
158; 161-163
161; 163; 166; 167
160; 161; 163
98; 159
120; 163
120; 163; 166; 167
Type 2 diabetes ↓ Fasting plasma glucose ↑ OGTT
147; 164; 165
30 | P a g e
1.5 Mechanism of action of EGCG
1.5.1 Metabolic actions of EGCG
There is mounting evidence from in vitro studies suggesting that EGCG has
insulin-mimetic metabolic actions on myocytes (157; 172; 173) and hepatocytes (174; 175). In
isolated myocytes, green tea and EGCG stimulate GLUT4 translocation and results in
increased glucose uptake (157; 158; 172). Similar to insulin, EGCG has been reported
to stimulate muscle glucose uptake via the PI3-K/Akt signalling pathway in cultured
myotubes (172; 173; 176). However, there is no evidence of EGCG activating the
PI3-K/Akt pathway by activating the insulin receptor (172). On the other hand, EGCG at
high doses (> 20 µM), but not a lower dose (10 µM) (173), was shown to stimulate
muscle glucose uptake by the activation of adenosine monophosphate-activated protein
kinase (AMPK) (176; 177). Interestingly, EGCG could stimulate glucose uptake in
cultured myocytes in the absence of insulin (157; 158; 172; 173; 176; 177), indicating
that EGCG has an insulin-mimetic action in muscle cells.
EGCG has been shown to suppress hepatic gluconeogenesis in cultured hepatocytes. At
high doses (> 25 µM), EGCG suppresses hepatic gluconeogenesis through the same
pathway as insulin, where EGCG activates IRS-1/ PI3-K/Akt, resulting in inhibition of
PEPCK and G6Pase gluconeogenic enzyme activity (175). In contrast, EGCG at a
lower dose (1 µM) suppresses hepatic gluconeogenesis via the AMPK pathway. In
cultured hepatocytes treated with EGCG, AMPK is activated by ROS and
Ca2+/calmodulin-dependent protein kinase kinase (CaMKK) pathway (174). Given that
EGCG at a dietary dose (< 10 µM) acts independent to that of insulin, EGCG might
31 | P a g e
1.5.2 Vascular actions of EGCG
Previous studies have shown that EGCG is a potent vasodilator in isolated aortic ring
(178; 179), bovine ophthalmic artery (180), coronary artery ring (181), and mesenteric
vascular bed (119). EGCG-mediated vasodilation is endothelium-dependent in isolated
vessels including rat aortic ring (178; 182), bovine ophthalmic artery (180), and porcine
coronary ring (181). Furthermore, EGCG stimulates NO production in cultured
vascular endothelial cells, via the PI3-K/Akt/eNOS pathway (119; 178-181) (Figure
1.6). Interestingly, formation of ROS in endothelial cells is essential for activation of
the PI3-K pathway by EGCG (119; 181). In contrast to the vasodilation effects, EGCG
at high concentrations (≥ 100 µM) induces endothelium-independent vasoconstriction
in isolated aortas (178; 183-185). However, it should be noted that plasma EGCG in
human is ~ 1 µM following consumption of 8 ‒ 16 cups of green tea (EGCG 800 mg.d-1)
(151; 186). Previous studies (119; 178; 180; 181) showed that EGCG-mediated
vasodilation is noticeable within a dietary range (0.1 – 10 µM). Taken together, these
studies suggested that high doses of EGCG elicit opposing effects to that of low doses
of EGCG, and this is important to take into consideration for the design of clinical
32 | P a g e