This is a repository copy of Sex-specific fundamental and formant frequency patterns in a cross-sectional study .
White Rose Research Online URL for this paper: http://eprints.whiterose.ac.uk/1941/
Article:
Whiteside, S.P. (2001) Sex-specific fundamental and formant frequency patterns in a cross-sectional study. The Journal of the Acoustical Society of America, 110 (1). pp. 464-478. ISSN 0001-4966
https://doi.org/10.1121/1.1379087
[email protected] https://eprints.whiterose.ac.uk/
Reuse
Unless indicated otherwise, fulltext items are protected by copyright with all rights reserved. The copyright exception in section 29 of the Copyright, Designs and Patents Act 1988 allows the making of a single copy solely for the purpose of non-commercial research or private study within the limits of fair dealing. The publisher or other rights-holder may allow further reproduction and re-use of this version - refer to the White Rose Research Online record for this item. Where records identify the publisher as the copyright holder, users can verify any specific terms of use on the publisher’s website.
Takedown
If you consider content in White Rose Research Online to be in breach of UK law, please notify us by
White Rose Research Online
http://eprints.whiterose.ac.uk/This is an author produced version of a paper subsequently published in The
Journal of the Acoustical Society of America.
White Rose Research Online URL for this paper: http://eprints.whiterose.ac.uk/1941/
Published paper
Whiteside, S.P. (2001) Sex-specific fundamental and formant frequency patterns
in a cross-sectional study. The Journal of the Acoustical Society of America, 110
(1). pp. 464-478.
Sex-specific fundamental and formant frequency patterns in a cross-sectional
study
Sandra P. Whiteside
Department of Human Communication Sciences, University of Sheffield S10 2TA, United Kingdom
Received
Abstract
An extensive developmental acoustic study of the speech patterns of children and
adults was reported by Lee and colleagues [Lee et al., J. Acoust. Soc. Am. 105,
1455-1468 (1999)]. This paper presents a reexamination of selected fundamental frequency and
formant frequency data presented in their report for 10 monophthongs by investigating
sex-specific and developmental patterns using two different approaches. The first of these
includes the investigation of age- and sex-specific formant frequency patterns in the
monophthongs. The second, the investigation of fundamental frequency and formant
frequency data using the critical band rate (bark) scale and a number of acoustic-phonetic
dimensions of the monophthongs from an age- and sex-specific perspective. These
acoustic-phonetic dimensions include: vowel spaces and distances from speaker
centroids; frequency differences between the formant frequencies of males and females;
vowel openness/closeness and frontness/backness; the degree of vocal effort; and formant
frequency ranges. Both approaches reveal both age- and sex-specific development
patterns which also appear to be dependent on whether vowels are peripheral or
non-peripheral. The developmental emergence of these sex-specific differences are discussed
with reference to anatomical, physiological, sociophonetic and culturally determined
factors. Some directions for further investigation into the age-linked sex differences in
speech across the lifespan are also proposed.
INTRODUCTION
Sex differences in the formant frequency values of adults are well established and
widely documented (e.g. Childers and Wu, 1991; Deterding, 1997; Peterson and Barney,
1952; Wu and Childers, 1991). In addition, the non-uniform patterns of sex differences
across different formant frequencies and vowels are well-established and have been
observed across different languages (Fant, 1975; Traunmüller, 1984, 1988). These
non-uniform sex differences highlight the non-linear sex differences in the vocal tract
dimensions of men and women (Fant, 1966, 1975; Fitch and Giedd, 1999) and explain the
developmental emergence of non-linear sex differences in the formant frequency data of
preadolescent children (e.g. Bennett, 1981; Busby and Plant, 1995; Eguchi and Hirsh,
1969; White, 1999; Whiteside and Hodgson, 2000).
There is some acoustic-phonetic evidence which suggests that women have more
peripheral vowel spaces compared to men (e.g. Deterding, 1997; Henton, 1995;
Traunmüller, 1988), and this seems to hold true across a number of different languages
including General American English, Italian, Japanese, British English (Middle
Northern), German, Swedish, Standard Dutch and French (e.g. see Henton (1995) and
Rosner and Pickering (1994) for details and summaries of these data). The more
peripheral nature of vowel spaces exhibited by women has been attributed to
sociophonetic factors which determine the different speech styles adopted by men and
women (Henton, 1995). However, an alternative view is that the emergence of sex
differences in the acoustic-phonetic characteristics of vowels can be explained by
physiological factors and anatomical constraints, which are due to maturational
A recent and extensive contribution to the developmental literature on speech
characteristics comes from Lee and colleagues (Lee et al., 1999), who report on speech
data collected from 436 children aged 5 to 18 years, and 56 adults (aged 25-50 years).
Their study includes data on fundamental frequency and formant frequency data from 10
monophthongs of American English. In their presentation and discussion of their data, the
authors mention the need for a more detailed and thorough investigation of their data.
This paper aims to re-examine and elaborate on some of the fundamental and formant
frequency data presented by Lee et al. (1999) by adopting a sex-specific developmental
perspective, and exploring some of the factors that may be responsible for age-linked sex
differences in these acoustic-phonetic parameters. The fundamental frequency and
formant frequency data presented by Lee et al. (1999) are re-examined using a number of
approaches. The first of these involves the application of kn-factors (Fant, 1966, 1975),
and the second, the investigation of vowel spaces and acoustic-phonetic parameters using
the critical band rate (bark) scale (Traunmüller, 1988, 1990). Both approaches adopt an
age- and sex-specific perspective.
In order to investigate within-sex patterns as a function of development, kn-age
factors are derived for each of the male and female formant frequency data following
Fant (1966, 1975). The motivation here is to chart and gauge the developmental patterns
of formant frequencies of males and females separately, as a function of chronological
age. Further, to investigate the emergence of sex differences across the lifespan, kn-sex
factors are examined by gauging the male-female differences in formant frequencies
across all vowels and selected vowels for the different age groups. The findings of this
reanalysis of the formant frequency data reported by Lee et al., (1999) are presented and
frequencies (e.g. Bennett, 1981; Busby and Plant, 1995; Eguchi and Hirsh, 1969; White,
1999), and developmental patterns in the morphology of the human vocal tract (e.g. Fitch
and Giedd, 1999).
The formant frequency data reported by Lee et al. (1999) are also investigated using
an approach which determines the distances of formant frequency values from speaker
centroids as a measure of vowel space (e.g. Deterding, 1997). Acoustic-phonetic
parameters expressed in the critical band rate (bark) scale have been shown to be
effective in highlighting the ontogeny of sex-specific variation in the vowel quality of
peripheral vowels (Traunmüller, 1988). Given that the 10 monophthongal vowels
reported by Lee et al. (1999) included both peripheral and non-peripheral vowels, the
acoustic-phonetic quality of peripheral and non-peripheral vowels is examined separately
using a number of acoustic-phonetic parameters based on the critical band rate (bark)
scale from a sex-specific and developmental perspective. The patterns that emerge from
this re-examination are discussed with reference to the sex-linked developmental trends
in the data, and whether they shed any light on any factors that may be responsible for
influencing the emergence of speaker sex differences in the phonetic quality of vowels
(e.g. Henton, 1995; Rosner and Pickering, 1994; Traunmüller, 1988).
I. METHODS
A. Kn-age and kn-sex factors
The mean formant frequency values (F1 to F3) for the monophthongs of all age groups
from age 71 years to those of the adults, reported by Lee et al. (1999) were examined for
monophthongs reported by Lee et al. (1999, p. 1456) are as follows: aa (pot); ae (bat); ah
(but); ao (ball); eh (bet); er (bird); ih (bit); iy (bead); uh (put); uw (boot).2
Following Fant (1966, 1975) scaling factors were calculated for each of the formant
frequency values (F1, F2, F3), and across all three formant frequencies ((F1+F2+F3)/3)
to examine both within-sex-age-linked developmental patterns, and sex-specific
developmental changes. Within-sex-age-linked developmental patterns were examined by
applying the formula (1) to give two sets of kn-age values for the male and female
speakers. These kn-age values allowed the examination of developmental changes in
formant frequency values for each sex group, with reference to the adult formant
frequency values. In addition, within-age sex-linked developmental patterns for formant
frequency values were examined by using formula (2) to give one set of kn-sex factors.
These kn-sex factors allowed the tracking of developmental patterns in within-age sex
differences with increasing chronological age. Both kn-age and kn-sex factors were
examined in more detail for a selected group of vowels which represented a range of
acoustic-phonetic vowel quality dimensions of openness, constriction, rhoticity, frontness
and backness. These selected vowels were aa, ah, er, ih, iy and uw.
Kn = Fn/ Ref Fn
Fn: Female or Male formant frequency value
Ref Fn: Formant frequency value of adult female (in the case of female Fn value)
or adult male (in the case of male Fn value) formant frequency value. For example,
for the corresponding F1 value for the male 18 year olds (Vowel aa, 737 Hz), to
derive a k1 age factor value of 1.02 for the male 18 year olds. (1)
Kn = Fn/ Ref Fn
Fn: Female formant frequency value
Ref Fn: Formant frequency value of Male age peer formant frequency value. For
example, the male value of F1 (Vowel aa, 723 Hz) for the 18 year-old group serves
as the reference value for the corresponding F1 value for the female 18 year old
group (Vowel aa, 894 Hz). This therefore gives a k1 sex factor of 1.26 for the 18
year-olds. (2)
B. Conversion of fundamental frequency and formant frequency values from hertz to Bark to examine vowel spaces and critical band rate (bark) distances
The aim here was to investigate sex-linked developmental patterns in the vowel spaces
of the male and female speakers of each age group. This re-examination was carried out
as follows. Firstly, the fundamental frequency (F0) and formant frequency data (in hertz)
for the 10 vowels reported by Lee et al. (1999) were converted to the Bark auditory scale,
using the formula described by Traunmüller (1988, 1990). This formula for the Bark
scale is an alternative to that documented by Zwicker and Terhadt (1980) where Z is the
frequency in the Bark scale and F is the frequency in hertz as given in formula (3). In
addition, all fundamental frequency values less than 2.0 Bark were corrected using
Z=[26.81F/(1960+F)]-0.53 (3)
For calculated Z<2.0 Bark: Z'=Z+0.15(2-Z) (4)
Subsequently, vowel spaces of the 13 age groups were determined for the males and
females of each age group using the critical band rate (bark) values. This was done by
plotting the difference between F1 and F0 (F1-F0) as a speaker-independent index of
degree of openness (Traunmüller, 1981), against the difference between F2 and F1
(F2-F1), as a general index of anterior/posterior position of constriction (Ladefoged and
Maddieson, 1990). This method was used to normalize for sex differences, and was
therefore chosen to highlight any developmental sex differences within the defined
F1-F0/F2-F1 vowel space of the 10 vowels after normalization.
In order to determine tonotopic distances between vowels in the vowel space defined
by F2-F1/F1-F0, the speaker centroids of the vowel space for the male and female
speakers were calculated separately for each age and sex group from the mean F1-F0 and
F2-F1 values of all 10 vowels formula (5). In (5) D refers to the distance of vowel V from
the speaker centroid of each age and sex group vowel space, xcentroid to the F2-F1
co-ordinate of the speaker centroid, ycentroid to the F1-F0 co-co-ordinate of the speaker
centroid, x-V to the F2-F1 value for vowel V, and y-V to the F1-F0 value for vowel V.
The application of formula (5) gleaned a total of 26 sets of speaker centroid values and
vowel distances (2 (males and females) x 13 (age groups)).
C. Investigating critical band rate (bark) distances and variation in vowel quality in
peripheral and non-peripheral vowels from a sex-linked developmental perspective
Using a selection of methods, critical band rate (bark) distances and the variation of
the 10 vowels were also investigated in greater detail from a sex-specific developmental
perspective by examining sex-specific developmental patterns before puberty (ages 7 to
12 years), during puberty (ages 13 and 14 years), after puberty (ages 15 to 18 years), and
in adulthood (age 25 to 50 years). A number of acoustic-phonetic dimensions were
investigated for both the peripheral (aa, ae, ao, eh, iy and uw) and non-peripheral (ah, er,
ih, uh) vowels as a function of age group and sex. Details and the motivation for these
dimensions follow: I) F1 and F0 have been identified as major cues to the perceived
phonetic openness of a vowel. Therefore, vowel openness expressed as a function of F0
(in Bark), and the degree of standard deviation in the critical band rate of F1 (as an index
of the extent of variation in the open-close dimension of vowel quality) was examined
(Traunmüller, 1988); II) The critical band rate of F3 can be taken to represent speaker
size as it decreases with increasing vocal tract length. The standard deviation values of
the critical band rates of F1 index the open-close dimension of vowel quality, those of F2,
the front-back dimension of vowel quality, and those of F3, the degree of rhoticity for the
vowel er for example. The development of signaling these different dimensions of vowel
quality would be reflected in the variation in F1, F2 and F3. Therefore, the dispersion
(standard deviation) values of the critical band rates of F1, F2, and F3 expressed as a
function of the critical band rate of F3 (vocal tract length and speaker size) were
examined (Traunmüller, 1988).; III) Z3-Z0 is approximately the same in the speech of
men, women and children, but it decreases with increasing vocal effort. Therefore, it can
decreases with increasing vocal tract length. Therefore, the critical band rate (bark)
difference between the third formant and F0 (Z3-Z0) was examined as a function of the
critical band rate of F3. IV) The range values for F1, F2 and F3 expressed as the
difference between the maximum and minimum values of each formant frequency
provide information on vowel quality and highlight the role of individual formant
frequencies in shaping the vowel quality of peripheral and non-peripheral vowels. For
example, peripheral vowels have greater range values in F1 and F2 compared to
non-peripheral vowels, whereas a non-non-peripheral vowel such as er would be expected to
showed a greater range in F3 values due to its rhotacized phonetic quality, which is
signaled by lowered values in F3 (e.g. Alwan et al., 1997; Dalston, 1975; Espy-Wilson et
al., 2000). The range in formant frequencies were therefore examined for F1 to F3.
Variations in developmental and adult sex differences as a function of both vowel and
formant frequency have been reported (e.g. Bennett, 1981; Busby & Plant, 1995; Fant,
1966, 1975). The differences between female and male formant frequency values were
therefore examined from an auditory perspective for each vowel as a function of age
group using critical band rate values for F1 to F3 (Traunmüller, 1988).
II. RESULTS
A. Kn-age values
The kn-age factor values for all 10 vowels combined, are depicted in Fig. 1 by age and
sex for the formant frequencies F1 to F3 (Figs. 1 (a) to 1(c)), and for the overall mean of
F1, F2 and F3 (Fig 1(d)). The general developmental trend for both males and females
indicates a decrease in the k-age values for all three formant frequencies, as both the
values of the adult men and women speakers, respectively. What is worth noting here is
that the k1-age values for the females are higher than those of the males from age 15
onwards. In addition, the younger females have higher F1 values compared to the women
speakers.
<PLACE FIG 1 about here>
There are sex-specific differences in both the degree and rate of developmental
change. For example, when the k-age values were averaged across k1, k2 and k3 (k1,2,3
-age), the difference in the degree of change is marked by a shift from a value of 1.34 at age
7 years, to 1.01 at age 18 years, in the males' data (see Fig 1(d)). This compares with
k1,2,3-age values of 1.18 and 1.05 for the 7 and 18-year old females, respectively (see Fig
1(d)). The sex-linked differences with respect to the extent of developmental change
show that although both the males and females both display maturational patterns during
puberty (age 10 to 15 years), these are less prominent for the females.
B. Kn-sex values
The mean k-sex values for all vowels combined, are given in Fig. 2 (a) by formant
frequency and age group. The overall k-sex values in Fig. 2 (a) depict discernible sex
differences before puberty, and the emergence of more marked differences at age 10
where we see small increases in k2 and k3 factors until age 12. Thereafter, between the
ages of 12 and 18 years, the pattern is one of substantial increases with a marked decrease
(this was a deviation in the general developmental trend) at age 14, which was due to the
kn-sex factors depicted in Fig. 2 (a) show parallel increases for all three formant frequencies
from age 14 years to 16 years, with F1 having the highest values, and F3 the lowest.
From age 16 years to 17 years there is no change for k1 (F1) and k2 (F2), but k3 (F3)
displays a decrease from 1.13 to 1.10. Between age 17 and 18 years marked increases for
k1 (1.25 to 1.30), k2 (1.20 to 1.24) and k3 (1.10 to 1.16) are observed. After this point, k1
and k2 display decreases (k1: 1.30 to 1.20, k2: 1.24 to 1.20) with no change being
observed for k3.
<PLACE FIG 2 about here>
When the data for all the children and adults are divided into the four age groups
namely pre-puberty (age 7 to 12 years), puberty (13 to 14 years), post-puberty (15 to 18
years), and adults (25 to 50 years), we are able to see the net effect of puberty on sex
differences in terms of k-sex factors across all three formant frequencies of the 10
vowels. This net effect is illustrated in Fig 2 (b) which depicts sex-linked developmental
trends. Although there is evidence to suggest that there are sex differences before
puberty, these become more marked both during, and after puberty. The data given in
Fig. 2 (b) also suggest that while a substantial degree of sex differences emerge after
puberty for some vowels (e.g. ae, ao, iy and uw in particular - see Fig. 2 (b)), others show
a lower proportional increase in kn-sex values after puberty (e.g. aa, ah, er, and uh). The
observation that some vowels display greater sex differences in adulthood (e.g. overall
k-sex values for aa, ah, eh, and uh - Fig 2 (b)), suggest that some k-sex-specific patterns
continue to unfold during adulthood.
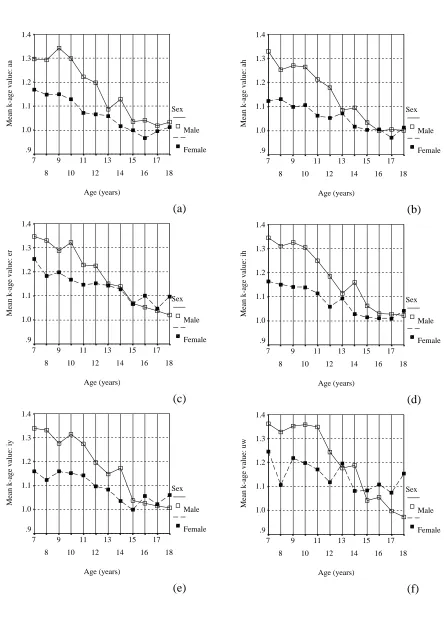
Fig. 3 depicts the mean k-age values averaged across all three formant frequencies by
age and sex for the selected vowels aa, ah, er, ih, iy and uw, and Fig. 4, the k-sex values
by formant frequency (F1 (k1), F2 (k2) and F3 (k3)) for the same group of selected
vowels. The developmental trend in the k-age factors across all the 6 selected vowels is a
general decrease in values with age (see Fig. 3), and for the k-sex factors a general
increase with age (see Fig. 4). However, if we examine the data on a vowel-by-vowel
basis from a sex-linked developmental perspective we are able to note sex differences in
the reduction of k-age values as a function of both age and vowel. For example, there are
general decreases in the males' k-age values from age 7 to 13 years, and between age 14
and 15 years for the vowels aa (Fig. 3(a)), ih (Fig. 3 (d)), iy (Fig. 3 (e)) and uw (Fig. 3 (f))
which are more marked when compared to the females data. In addition, after the age of
15, the k-age values for males show a negligible decrease, and therefore only slight
decreases in formant frequencies during this period.This contrasts with the female values
which display variable patterns of increases and decreases in the k-age values for
different vowels after the age of 15 years (see Fig 3). For example, the overall kn-age
values for the females decreases gradually from age 7 and reaches a minimum at age 16
for the vowel aa (see Fig. 3 (a)). After this, the values increase for the vowel aa until age
18. The k-sex values for this vowel indicate increases in values after age 14 with the
largest of these occurring for F1 (see Fig 4 (a)). In addition, the females' k-age values
averaged across all three formants for the vowel iy (see Fig 3 (e)) display an increase at
age 16, followed by a decrease at age 17, and finally an increase at age 18. The k-sex
values for iy (see Fig 4 (e) also suggest as for the vowel aa, increases in values from age
14 years, with again the highest and lowest values being observed for F1 and F3
Further sex-specific differences are exemplified by the vowel uw which displays the
highest kn-sex values for the post-puberty group (see Fig 2 (b) and Fig 4 (e)). This pattern
is reflected in the females' k-age values and k-sex values for the vowel uw (Fig. 4 (f)).If
we focus on the male patterns for the kn-age values of uw in Fig. 3 (f), these are generally
similar to those patterns for the other vowels depicted Figs 3 (a) to (e). That is, with the
exception of the increase at age 14, there is a decrease with age towards the adults'
values, reaching the adults values at age 17. This pattern is rather different from that of
the females who show the lowest kn-age values for uw at age 17 which never approaches
1.0 after this point, but in fact increases markedly (see Fig 3 (f)). This pattern suggests
that the formant frequencies of the 18 year-old females are significantly higher than those
values for the adult females, and also explains the high k-sex values for uw observed for
k1 (1.42) and k2 (1.55) at age 18, compared to the much lower values for the adults
(k1-1.20; k2-1.17 - see Fig 4 (f)). The net effect of this greater sex difference in the
post-puberty group compared to the adult group is depicted in Fig 2 (b).
D. Vowel spaces and critical band rate (bark) distances
The mean distances of all vowels of each sex and age speaker centroid in the
F1-F0/F2-F1 vowel space are illustrated in Fig. 5 (a) by age and sex. As seen in Fig. 5, the
mean distances for the males and females both show an overall developmental trend of
decreasing mean distances with age. However, upon closer examination of the data, we
are able to observe that there are some sex-specific developmental differences in the
mean distances from the vowel-group centroid. For example, the mean distances from the
vowel-group centroids are similar for both the males and females for the age groups: 7,
display larger mean distances from the vowel-group centroids than the males. This
contrasts with the data for the 11, 12- and 14-year olds, which display larger mean
distances from the vowel centroids for the males. If we examine the mean distances from
the speaker centroids in the pre-puberty, puberty, post-puberty and adult groups,
sex-specific effects are observed as a function of age group. For example, the males display a
gradual decrease in the mean distance from the speaker centroid, whereas the females
display a decrease from pre-puberty to puberty, but subsequent increases thereafter (Fig 5
(b)).
<PLACE FIG 5 about here>
The distances of each vowel from the speaker centroid for the males and females in the
F1-F0/F2-F1 vowel space are given in Table I, and depicted in Fig. 6 for the adults (25 to
50 years). What is apparent here is that the women display a more peripheral vowel space
than the men. If we define the outer bounds of the monophthongal vowel space using the
peripheral vowels iy, uw, ao, ae and aa, the women occupy a larger acoustic space than
the men in the F2-F1/F1-F0 dimension. For example, the women display a greater degree
openness for the vowel aa, and a greater degree of frontness and constriction for the
vowel iy. The female adults also display greater distances from the vowel centroid than
their male peers, for nine out of the ten vowels and for all vowels combined, which was
found to be significant for the ten vowels using a paired t-test (t(9)=3.570, p<.01) (see
Table I).
The results of the vowel openness parameter expressed as a function of the
fundamental frequency (in Bark) and the degree of standard deviation (dispersion) in the
critical band rate of F1 is illustrated as a function of age group and sex in Fig. 7 , for the
peripheral vowels (left), and the non-peripheral vowels (right). The females display a
decrease in F1 dispersion between pre-puberty and puberty with subsequent increases
between post-puberty and adulthood for both vowel sets. This contrasts with the males
who show a decrease in F1 dispersion between pre-puberty and puberty, with only slight
increases for the same age intervals. These results agree with the developmental data
reported by Traunmüller (1988). In addition, the peripheral vowel set displays higher
dispersion values compared to the non-peripheral vowels.
<PLACE FIG 7 about here>
The degree of variation in vowel formants as a function of age group and sex,
expressed as the dispersion (standard deviation) of the critical band rates of F1, F2 and F3
and the critical band rate of F3 for both the peripheral and non-peripheral vowels is
depicted in Fig. 8. All three formant frequencies display sex-specific developmental
differences (Figs. 8 (a), (b), and (c)). For example, both the males and females show a
decrease in the critical band rate dispersion (standard deviation) from pre-puberty to
puberty for both F1 and F2. However, between post-puberty and adulthood, the females
exhibit more marked increases in the critical band rate dispersion than the males for both
the peripheral and non-peripheral vowels. The women also display higher mean
and the pattern for the peripheral vowels replicates those described by Traunmüller
(1988) for a set of peripheral Japanese vowels. The women also display a larger increase
in the dispersion of F2 values than the men from post-puberty to adulthood for both
vowel sets (Fig. 8 (b)), and the ontogenetic development of sex differences in the F2
dispersion patterns for the peripheral vowels are also similar to the peripheral Japanese
vowels reported by Traunmüller (1988). For F3 (see Fig. 8 (c)) there are also sex-specific
developmental differences for both vowel sets, but the pattern of these differences varies
with the vowel set in question. For example, the peripheral vowels indicate that both the
males and females display slight increases in the critical band-rate dispersion between
pre-puberty and puberty, and between puberty and post-puberty, and slight decreases
between post-puberty and adulthood. This contrasts with the non-peripheral vowels
which show more sex-specific differences. For example, the males show a decrease, but
the females an increase, between pre-puberty and puberty. In addition, although both the
females and males show an increase in the dispersion values of F3 between post-puberty
and adulthood, this is more marked for the females (see Fig 8 (c)). What is worth noting
at this point is that the dispersion values of F3 are higher for the non-peripheral vowels
compared to the values peripheral vowels, due to the inclusion of the rhotacized vowel er
in the non-peripheral vowel set.
<PLACE FIG 8 about here>
The relationship between speaker size and vocal effort of the 10 vowels expressed as a
function of the third formant (Z3: Bark) and the difference between the third formant and
both the peripheral and non-peripheral vowel sets. An increase in vocal tract length is
indexed by a decrease in F3, and an increase in vocal effort, by a decrease in the value of
Z3-Z0 (Bark). These data illustrate sex-specific developmental differences in both vocal
tract length (F3: Bark) and vocal effort (Z3-Z0: Bark). For both vowel sets, the females
display a pattern of increase in both the dimensions of speaker size and vocal effort from
pre- through to post-puberty, the net result of which is more marked for the
non-peripheral vowel set that includes er. Although the males also display a net increase in
vocal effort from pre- to post-puberty, this developmental increase is less marked than
that observed for the females. In addition, between post-puberty and adulthood, the males
display higher increases in vocal effort compared to the females for both the peripheral
and non-peripheral vowels (see Fig 9). When the vowel sets are compared, levels of vocal
effort for all three age groups are greater for the non-peripheral vowel set that includes er.
With respect to vocal tract length, the non-peripheral vowels also display both marked
decreases in F3 (Bark) and therefore, a marked increase in vocal tract length, compared to
the peripheral vowels.
<PLACE FIG 9 about here>
The ranges in formant frequency values (F1 to F3 in Bark) across all vowels are
illustrated in Fig. 10 for both vowel sets for the four age groups (pre-puberty: 7 to 12
years; puberty: 13 and 14 years; post-puberty: 15 to 18 years; adults: 25 to 50 years) by
sex. These data show larger range values for both F1 and F2 for the peripheral vowels.
This contrasts with the data for F3 which show larger range values for the non-peripheral
<PLACE FIG 10 about here>
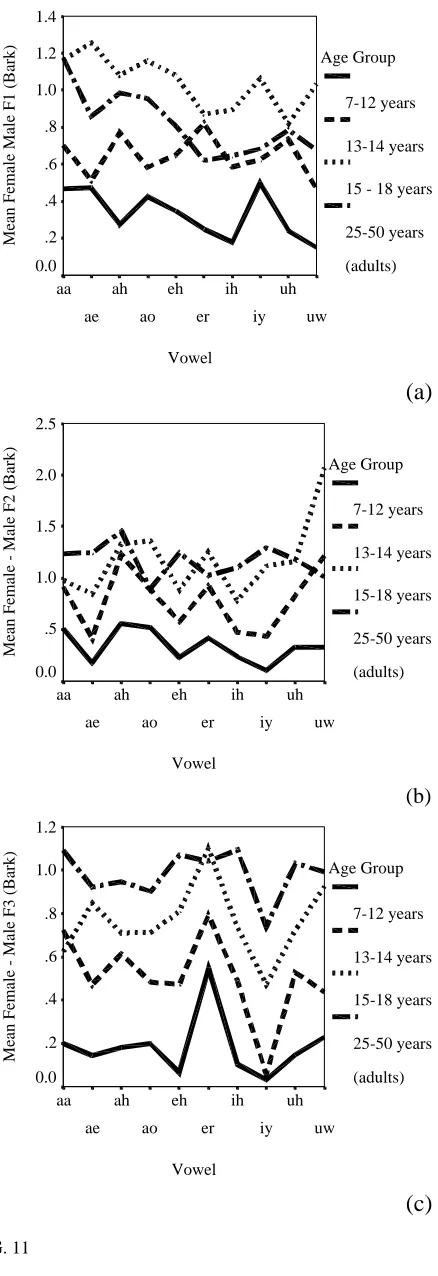
The tonotopic distances between female and male formant frequencies (F1 to F3 in
Bark) across all vowels are depicted in Fig. 11 for the four age groups (7 to 12 years; 13
and 14 years; 15 to 18 years; 25 to 50 years). These data display that although there are
sex-specific developmental patterns, these are dependent upon both the formant
frequency and the vowel. For example, all three formant frequencies display some sex
differences before puberty, but some of these differences are greater for specific formants
and vowels (e.g. F1 of iy (Fig. 11 (a)), and F3 of er (Fig.11 (b)). In addition, although an
increase in male-female differences continues to occur from puberty to post-puberty for
F1, F2 and F3, these sex differences appear to become less marked between post-puberty
and adulthood for some of the data (e.g. F1 as shown in Fig 11 (a)).
III. DISCUSSION
The aim of this paper was to re-examine the fundamental frequency and formant
frequency data presented by Lee et al. (1999) from a sex-specific developmental
perspective. The re-examination of the data adopted two basic approaches; examining
sex-linked developmental formant frequency differences as a function of age and sex
using formant scaling (Fant, 1966, 1975); and investigating sex-specific developmental
patterns in fundamental frequency and formant frequencies using a number of
acoustic-phonetic dimensions based on the critical band rate (Bark) scale (Traunmüller, 1988,
1990). Both approaches revealed a range of sex differences which were developmental in
A. Formant scaling k-age and k-sex factors
A number of points emerge from this reexamination of Lee et al.'s (1999) data using
k-age and k-sex values based on Fant's method (1966, 1975). The mean k-k-age values for
F1, F2 and F3 showed a general decrease with age with the males displaying greater
decreases than the females (see Fig 1). This trend reflects the general pattern of
developmental sex differences in the maturation of the vocal tract (Fitch and Giedd,
1999). In addition, the patterns in Fig. 1 indicate that from age 10, both the males and
females display a more marked decrease in formant frequencies, which coincides with the
onset of the peripubertal stage at age 10.3 years, identified by Fitch and Giedd (1999).
Notably, the decrease in k-age values appears to be less marked after age 15 years. This
suggests that in the postpubertal stage (~15 years to ~18 years), overall changes in
formant frequencies are of a smaller magnitude than those which occur during puberty.
The k-age values also show evidence of sex-specific differences for the formant
frequencies of the vowels. For example, the male k-age values decrease with age, and by
age 18 years, they are close to a scale factor of 1.0 for F1 (1.01), F2 (1.01) and F3 (1.02).
This contrasts with the data for the females, who also show this decrease with age, but by
age 18 years, only k3 is close to 1.0 (1.02), whereas k1 and k2 have values of 1.10 and
1.04, respectively. The k-age data for the selected vowels in Fig. 3 suggest that this
pattern is the result of the 18 year-old females' higher k-age values for er, iy and uw
relative to the adult female group. Such marked differences at age 18 years cannot be
explained solely in terms of maturational differences of the vocal tract alone. It is
therefore more likely that the phonetic quality of uw samples produced by the 18-year
those of the adult women. This raises the role of sociophonetic factors as possible key
influences in determining the phonetic quality of vowel formant frequencies (e.g. Byrd,
1992, 1994; Henton, 1995; Lee et al., 1999). It is suggested that the phonetic quality of
the vowel uw, may be an example of sociophonetic and/or accent variation in the 18
year-old females. An additional observation worth noting here is that the 18 year-year-old females
also displayed the highest fundamental frequency values within the post-pubertal and
adult female groups. The question therefore, is whether the adults (25 to 50 years) simply
came from a different accent group, or whether there were variations in stylistic
conventions between the postpubertal and adult groups. Unfortunately, we are not
provided with a detailed age, gender and accent breakdown to ascertain this, and
therefore would be an interesting factor to explore further. Furthermore, because the adult
group spans 25 years, it is not unreasonable to suggest that there may be further age- and
sex-specific differences within this group. Given this, it would be worth investigating
whether age-related sex differences are present between the younger adults (e.g. 25-35
years) and older adults (e.g. 40-50 years). If age-related differences were found, they
would supplement evidence reported for changes in speech and voice characteristics
during the adult lifespan (e.g. Decoster and Debruyne, 1997, 2000; Xue et al., 1999).
The presence of sex differences before puberty replicates the findings of other studies
(e.g. Bennett, 1981; Busby and Plant, 1995; Eguchi and Hirsh, 1969; White, 1999). These
sex differences become more marked after puberty (see Fig 2 (b)), despite the drop at age
14 years, which is due to the males displaying higher formant frequencies (see Fig. 2 (a)).
Lee et al. (1999) explain this drop as being the consequence of maturational processes.
The developmental trend of k-sex values reflects sex-specific patterns in the maturation
above (sections B. and C.) are both formant frequency dependent (see Figs. 2 (a), (b), (c))
and vowel dependent (see Fig. 2 (b) and Fig 4). These patterns suggest the emergence of
non-uniform sex differences in the vocal tract morphology of males and females which
therefore affects the degree of variation in formant frequencies as a function of sex and
vowel context. The k-sex factors for F1, F2 and F3 (see Fig 2 (a)) for example, reflect the
emergence of sex differences in the pharynx, oral cavity and total vocal tract length. This
is supported by Fitch and Giedd (1999) who report significant sex differences in the
relative length differences between the oral and pharyngeal cavities, with greater mean
sex differences in the postpubertal subjects (12.9 mm) compared to those of the
peripubertal subjects (7.5 mm). This therefore provides some indirect evidence to explain
why front vowels such as ae and iy in Lee et al.'s data exhibit the bulk of their increases
in kn-sex values after puberty. The degree of the sex differences exhibited by the vowel
uw, in contrast to the other selected vowels however (see Fig 2 (b)), suggests that vocal
tract length alone, is not sufficient in explaining the extent of some sex-specific effects,
and that other factors related to accent, speaking style or sociophonetic influences may be
responsible for some speaker sex differences. A similar finding is reported by
Traunmüller (1988) who observed variations in vowel quality for some women speakers
in a Japanese data set.
On the basis of evidence which suggests that the male vocal tract continues to go
through maturational changes (Fitch and Giedd, 1999), one might expect to find more
dramatic drops in the formant frequencies of the males from age 15 in Lee et al.'s (1999)
data, and therefore larger kn-sex values than those reported here (see Figs 2 (a) and 2
(b)). A marked lowering of the male formant frequencies after age 15 years does not
again, that the physical length of the vocal tract alone, may not be sufficient in explaining
the male formant frequency patterns of the 10 vowels after age 15 years, and that other
factors (e.g. physiological, sociocultural, stylistic conventions) may be responsible for
these and other sex-specific patterns (e.g. Byrd, 1992, 1994; Hasek et al., 1980; Henton,
1995; Lee et al., 1999; Mattingly, 1966; Traunmüller, 1984, 1988).
B. Fundamental frequency and formant frequency patterns using the critical band
rate (Bark) scale
The examination of fundamental and formant frequency patterns using a selection of
acoustic phonetic parameters in the bark scale reveals the ontogeny of sex differences in
the phonetic quality of the 10 monophthongs reported by Lee et al. (1999). For example,
the vowel spaces defined by F2-F1 versus F1-F0 display evidence of sex-specific
patterns, which are developmental in nature. Different sex-specific patterns are observed
before, during and after puberty and by adulthood, the women display a more peripheral
vowel space and therefore a greater phonetic distinctiveness in vowel quality than the
men (see Table 1, Figs. 5 (a), 5 (b), and 6). The ontogeny of this sex difference in
phonetic distinctiveness is explained if we examine the acoustic-phonetic dimensions of
vowel quality that were investigated using the bark scale. For example, the degree of
vowel openness expressed as a function of fundamental frequency (in Bark) and the
degree of standard deviation in the critical band rate of F1 showed the adult women
displaying an increase in the dispersion of F1 (Bark) for both peripheral and
non-peripheral vowels compared to the 15 to 18 year olds (Figs 7 and 8 (a)). This increase in
the dispersion of F1 is not observed for the men speakers and cannot be accounted for as
in Lee et al.'s study must have been producing their vowels with greater
acoustic-phonetic distinctiveness, by may be adopting more extreme articulatory postures than the
men (e.g. greater openness and closeness). This increased phonetic distinctiveness also
explains the higher range values observed for the women's F1 values (Fig. 10 (a)), and the
greater openness of aa depicted in Fig. 6. Similarly, if we examine the phonetic quality of
the vowels in terms of the front-back dimension, the adult women display increases in the
dispersion values for F2 (Fig. 8 (b)), and increases in the range values for F2 (Fig. 10 (b))
compared to the 15 to 18 year olds. These patterns are particularly marked for the
peripheral vowels, and again suggests that the women are displaying a greater degree of
phonetic distinctiveness for this group of vowels compared both to the 15 to 18 year old
females and the men within this dimension of vowel quality. The contribution of F3 to
vowel quality with respect to both dispersion and range values appears to be more
significant for the non-peripheral vowels which is largely due to the inclusion of the
rhotacized vowel er, which is characterized by lower F3 values (Alwan et al., 1997;
Dalston, 1975; Espy-Wilson et al., 1997, 2000). What is interesting to note is that
although the adult men and women both display increases in the dispersion values of F3,
the extent of this increase between post-puberty and adulthood is more marked for the
adult women (Fig. 8 (c)). This is further evidence to suggest that the adult women are
producing vowels which are more distinct in their acoustic-phonetic dimensions. What is
interesting to note at this point is that the data for the F1, F2 and F3 dispersion values for
the peripheral vowels are similar to those reported by Traunmüller (1988) for a Japanese
data set. These cross-linguistic similarities in sex-specific patterns in speech therefore
suggest that at least some linguistic behavior in males and females can be explained by
The data for F1 and F2 discussed above go some way in explaining both the greater
distances from the speaker centroid, and the more peripheral vowel spaces for the women
speakers in terms of the open-close acoustic-phonetic dimension of vowels (Table 1, Fig.
6). The pattern of larger and more peripheral vowel spaces for women replicates previous
findings (e.g. Deterding, 1997; Henton, 1983, 1995; Rosner and Pickering, 1994;
Traunmüller, 1988), but more importantly, the reexamination of Lee et al.'s (1999) data
reveals that sex differences in vowel space appear to emerge with development, from
pre-adolescence to adulthood. Physiological factors and anatomical constraints due to
sex-specific maturational differences may be instrumental in shaping the more peripheral
vowel spaces displayed by women (Traunmüller, 1984, 1988). However, sociophonetic
factors may also be playing a part in influencing the development of learned sex-specific
speech behaviors. This suggestion is supported by evidence which suggests that the
auditory space of men and women varies across languages, and that there are therefore
language-specific stylistic factors that may determine some habitual speech settings (see
Henton (1995) and Rosner and Pickering (1994) for examples of data from a variety of
languages). The extent to which sociophonetic influences appear to be culturally
determined should therefore be acknowledged in light of these cross-language data.
An issue related to sociophonetic factors and stylistic convention, is the extent to
which speech behavior(s) are shaped by a particular scenario. For example, a
cross-language study of American, Russian and Swedish (Kuhl et al., 1997) found evidence of
mothers producing "more extreme" vowels in infant-directed samples, compared to those
in adult-directed samples. In addition, studies by Byrd (1992, 1994) report evidence to
suggest that women may adopt a speech style that displays less phonetic reduction in
experimental scenario influenced the speech style of the women in Lee et al.'s study
(1999), to produce their more peripheral vowel spaces, remains both an important and an
interesting question. What emerges from this discussion however, is that a combination
of anatomical, physiological, sociophonetic/cultural and idiosyncratic factors are all
likely to play some role in determining speaker sex differences, and their developmental
patterns.
The relationship between vocal tract length and vocal effort of the 10 vowels expressed
as a function of the third formant (Z3: Bark) and the difference between the third formant
and F0 (Z3-Z0: Bark) show sex-specific developmental patterns for both vowel sets.
Although both the females and males display increases in the vocal effort parameter with
age for both vowel sets as decreases in Z3-Z0, the males display more significant
increases in vocal effort from post-puberty to adulthood, which is largely due to their
lower F3 values compared to the females. In addition, the increases observed for vocal
effort were found to be more marked for the non-peripheral vowels, which can be
explained by the inclusion of the rhotacized vowel er in this vowel set which has lowered
F3 values. The dimension of speaker size indexed as an inverse relationship to F3 shows
that the development of rhoticity, and lower F3 values is therefore instrumental in
contributing to decreases in Z3-Z0, and therefore increases in 'speaker size' (see Fig. 9
(right side)). Of particular note is the markedly lower F3 values for the adult men (13.84
Bark) compared to the adult women (14.87 Bark) for the non-peripheral vowel set that
includes er. The distinctive 'dip' or lowered F3 values for the rhotacized vowel is likely to
be the result of similar articulatory configurations that are typically reported for /‰/ (e.g.
Alwan et al., 1997; Espy-Wilson et al., 2000) and replicates previously reported speaker
The articulatory configurations for /‰/ include pharyngeal, palatal and labial constrictions
(e.g. Alwan et al., 1997; Espy-Wilson et al., 1997, 2000), and the creation of a
sub-lingual cavity anterior between the palatal and lip constriction (e.g. Espy-Wilson and
Boyce, 1999). The net effect of this sub-lingual cavity is to increase the volume of the
oral cavity, which therefore lowers the frequency of F3. On this basis, the presence of a
sex difference before puberty, for the mean value of F3 (Bark) for the vowel er (see Fig.
11) suggests that there may already be sex differences before puberty in the volume of the
oral cavity which includes the sub-lingual cavity, which continue to increase during and
after puberty. In addition, the presence of speaker sex differences in the lengths of the lip
segments of pre-pubertal boys and girls (Fitch and Giedd, 1999) may also help to explain
the presence of this sex difference before puberty.
The sex differences in the MRI data of vocal tract morphology reported by Fitch and
Giedd (1999) also highlight the sex differences in vocal tract length and the
proportionately longer pharynx of males after puberty. Non-uniform sex differences in
the vocal tract are capable of explaining the non-linear increase in the tonotopic distance
between female and male formant frequency values of different vowels. For example,
greater female-male tonotopic distances of F1 for aa, ae, ao and ah after puberty (see Fig.
11 (a)) could be attributed to marked growth in the pharyngeal cavities of postpuberty
males, and a similar explanation could be proposed for the marked increase in
female-male differences for F2 from puberty to postpuberty for the palatal vowel iy. The fronted
quality of uw (produced by the 17 and 18 year-olds), which was suggested to be a
consequence of accent/sociophonetic factors may also be explicable in these terms.
However, in addition to non-uniform sex differences in vocal tract length, sex differences
tract volume may provide us with additional information on the emergence of some of the
more marked sex-differences in specific formants of specific vowels, such as F3 in er (see
Fig 11 (c)). What is worth highlighting at this stage is that even before puberty, there is
an appreciable tonotopic distance between the F3 values of females and males (Fig. 11
(c)), an observation which further stresses that vocal tract length alone may not be
responsible for all the sex differences observed for vowel formant frequencies. The fact
that F1 shows a decrease in the frequency differences between the adult men and women
compared to the postpubertal (15-18 years) males and females is due to decreases in F1
values for the adult women, and suggests that there may be age-specific changes
occurring in the vocal tracts of the older females in this group. This suggestion is
speculative but is not unreasonable in light of recent evidence which shows that there are
differences between the vocal tract configurations and resulting formant frequencies of
33-48 year old and 50-66 year old women (Xue et al., 1999). This further highlights the
need for further information on the demographic profile of the adult men and women
reported in Lee et al. (1999).
Further research into human vocal tract morphology and acoustic correlates, together
with a longitudinal perspective of speech development will provide valuable insights into
age- and sex-specific developmental formant frequency patterns. Such a longitudinal
perspective would also assist in shedding further light on specific aspects of individual
differences in the development and maturational process of speech characteristics (Smith
and Kenney, 1998). In addition, a longitudinal perspective may go some way in
explaining some of the between-subject variability observed in cross-sectional studies,
and the instability of speech patterns during periods of accelerated maturation and growth
occurring across the adult lifespan (e.g. Decoster and Debruyne, 1997, 2000; Xue et al.,
1999). Such a perspective may also reveal the extent to which physiological,
sociophonetic, cultural and stylistic conventions are responsible for sex differences in
formant frequencies and the acoustic-phonetic quality of vowels which cannot be
explained by developmental sex-linked differences in vocal tract morphology alone (e.g.,
Busby and Plant, 1995; Fant, 1966, 1975; Fitch and Giedd, 1999; Lee et al., 1999;
Traunmüller, 1988, 1990).
ACKNOWLEDGMENTS
I would like to thank Professor Anders Löfqvist, Professor Hartmut Traunmüller and two
anonymous reviewers for their thorough and constructive comments. I am responsible for
FOOTNOTES
1
The data from the 5 and 6 year olds were excluded from this re-examination, as the
vowel data were based on words produced in isolation. This contrasted with the source of
other age groups, where vowel data were based on words spoken in carrier phrases. The
exclusion of these data therefore meant that data from 13 age groups were included in this
study (7, 8, 9, 10, 11, 12, 13, 14, 15, 16, 17, 18 year-olds, and the adults (25 to 50 years)).
2
These alphabetic symbols are also used to represent the monophthongs (vowels) in all
tables and figures, however the equivalent IPA symbols for reference to readers are as
follows: aa (/A/ as in pot); ae (/Q/ as in bat); ah (/√/ as in but); ao (/ç/ as in ball); eh (/E/
as in bet); er (/Œ’˘/ as in bird); ih (/I/ as in bit); iy (/i˘/ as in bead); uh (/U/ as in put); uw
(/u˘/ as in boot). The term vowel will be used to complement the term 'monophthong'
REFERENCES
Alwan, A., Narayanan, S., and Haker, K. (1997). "Toward articulatory-acoustic models
for liquid approximants based on MRI and EPG data. Part II. The rhotics," J. Acoust.
Soc. Am. 101, 1078-1089.
Bennett, S. (1981). "Vowel formant frequency characteristics of preadolescent males and
females," J. Acoust. Soc. Am. 69, 231-238.
Busby, P. A., and Plant, G. L. (1995). "Formant frequency values of vowels produced by
preadolescent boys and girls," J. Acoust. Soc. Am. 97, 2603-2606.
Byrd, D. (1992). "Preliminary results on speaker-dependent variations in the TIMIT
database," J. Acoust. Soc. Amer. 92, 593 - 596.
Byrd, D. (1994). "Relations of sex and dialect to reduction," Speech Commun. 15, 39-54.
Childers, D. G., and Wu, K. (1991). "Gender recognition from speech: Part II. Fine
analysis," J. Acoust. Soc. Am. 90, 1841-1865.
Dalston, R. M. (1975). "Acoustic characteristics of English /w, r, l/ spoken correctly by
young children and adults," J. Acoust. Soc. Am. 57, 462-469.
Decoster, W., and Debruyne, F. (1997). "Changes in spectral measures and voice-onset
time with age: a cross sectional and a longitudinal study," Folia Phoniatr. Logop. 49,
269-280.
Decoster, W., and Debruyne, F. (2000). "Longitudinal voice changes: facts and
interpretation," J. Voice 14, 184-193.
Deterding, D. (1997). "The formants of monophthong vowels in standard southern British
English pronunciation," J. International Phonetic Association 27, 47-55.
Eguchi, S., and Hirsh, I. (1969). "Development of speech sounds in children," Acta
Espy-Wilson, C. Y., and Boyce, S. E. (1999). "A simple tube model for American
English /r/," Proceedings of the 14th International Congress of Phonetic Sciences (San
Francisco), pp. 2137-2140.
Espy-Wilson, C. Y., Boyce, S. E., Jackson, M., Narayanan, S., and Alwan, A. (2000).
"Acoustic modeling of American English /r/," J. Acoust. Soc. Am. 108, 343-356.
Espy-Wilson, C. Y., Narayanan, S., Boyce, S. E, and Alwan, A. (1997). "Acoustic
modeling of American English /r/," Proceedings of the 5th European Conference in
Speech Communication and Technology (Rhodes, Greece), pp. 393-396.
Fant, G. (1966). "A note on vocal tract size factors and non-uniform F-pattern scalings,"
STL-QPSR, KTH-Stockholm 4/1966 22-30.
Fant, G. (1975). "Non-uniform vowel normalization," STL-QPSR, KTH-Stockholm
2-3/1975, 1-19.
Fitch, W. T., and Giedd, J. (1999). "Morphology and development of the human vocal
tract: A study using magnetic resonance imaging," J. Acoust. Soc. Am. 106, 1511-
1522.
Hasek, C. S., Singh, S., and Murry, T. (1980). "Acoustic attributes of preadolescent
voices," J. Acoust. Soc. Am. 68, 1262-1265.
Henton, C. (1983). "Changes in the vowels of Received Pronunciation, " J. Phonetics 11,
353-371.
Henton, C. (1995). "Cross-language variation in the vowels of female and male
speakers," Proceedings of the 13th Congress of Phonetic Sciences (Stockholm,
Sweden), 4, 420-423.
Kuhl, P. K., Andruski, J. E., Chistovich, I. A., Chistovich, L. A., Kozhevnikova, E. V.,
"Cross-language analysis of phonetic units in "Cross-language addressed to infants," Science 277:
(5326), 684-686.
Ladefoged, P., and Maddieson, I. (1990)." Vowels of the world's languages," J. Phonetics
18, 93-122.
Lee, S., Potamianos, A., and Narayanan, S. (1999). "Acoustics of children's speech:
Developmental changes of temporal and spectral parameters," J. Acoust. Soc. Am.
105, 1455-1468.
Mattingly, I. (1966). "Speaker variation and vocal tract size," J. Acoust. Soc. Am. 39,
1219.
Peterson, G. E., and Barney, H. L. (1952). "Control methods used in a study of vowels,"
J. Acoust. Soc. Am. 24, 175-184.
Rosner, B. S., and Pickering, J. B. (1994). Vowel perception and production (Oxford
University Press: Oxford, UK).
Smith, B. L., and Kenney, M. K. (1998). "An assessment of several acoustic parameters
in children's speech production development: longitudinal data," J. Phonetics 26,
95-108.
Traunmüller, H. (1981). "Perceptual dimension of openness in vowels," J. Acoust. Soc.
Am. 69, 1465-1475.
Traunmüller, H. (1984). "Articulatory and perceptual factors controlling the age- and
sex-conditioned variability in formant frequencies of vowels," Speech Commun. 3, 49-61.
Traunmüller, H. (1988). "Paralinguistic variation and invariance in the characteristic
frequencies of vowels," Phonetica, 45, 1-29.
Traunmüller, H. (1990). "Analytical expression for the tonotopic sensory scale," J.
Westbury, J. R., Hashi, M., and Lindstrom, M. J. (1998). "Differences among speakers in
lingual articulation for American English /‰/," Speech Commun. 26, 203-226.
White, P. (1999). "Formant frequency analysis of children's spoken and sung vowel using
sweeping fundamental frequency production," J. Voice 13, 570-582.
Whiteside, S. P., and Hodgson, C. (2000). "Speech patterns of children and adults elicited
via a picture-naming task: an acoustic study," Speech Commun. 32, 267-285.
Wu, K., and Childers, D. G. (1991). "Gender recognition from speech: Part I. Coarse
analysis," J. Acoust. Soc. Am. 90, 1828-1840.
Xue, A., Jiang, J., Lin, E., Glassenberg, R., and Mueller, P. B. (1999). "Age-related
changes in human vocal tract configurations and the effect on speakers' vowel formant
frequencies: a pilot study," Log. Phon. Vocol. 24, 132-137.
Zwicker, E., and Terhadt, E. (1980). "Analytical expression for critical-band rate and
Table I. Distances from F2-F1/F1-F0 monophthong speaker centroid for the adult group (25 to 50 years) for each vowel by sex* as a measure of vowel space.
Centroid Value for F2-F1 (x)/F1-F0 (y)
by sex
Sex aa ae ah ao eh er ih iy uh uw All
vowe ls F: x=6.05, y=3.65
M: x=5.69, y=3.77 F M
3.57 3.15
1.39 1.32
1.66 1.63
3.90 3.45
.95 .87
.64 .56
2.49 2.32
5.92 5.62
.69 .69
1.99 1.78
FIGURE CAPTIONS
FIG. 1. (a) Mean k1-age (F1) values across all 10 vowels by age and sex; (b) Mean
k2-age (F2) values across all 10 vowels by k2-age and sex; (c) Mean k3-k2-age (F3) values across
all 10 vowels by age and sex; (d) Mean k-values averaged for k1, k2 and k3 ((F1 + F2
+F3)/3) across all 10 vowels by age and sex.
FIG 2. (a) Mean kn-sex values for the first three formant frequencies (F1, F2 and F3)
averaged across all vowels by age group. (b) Mean k-sex values averaged across all three
formant frequencies by vowel for the four age groups (7-12 years, 13-14 years, 15-18
years, and 25-50 years).
FIG 3. Mean k-age values averaged across three formant frequencies ((F1 + F2 +F3)/3)
by age and sex for the selected vowels, (a) aa, (b) ah, (c) er, (d) ih, (e) iy, and (f) uw.
FIG 4. Mean k-sex values by age group and formant frequency (F1, F2, F3), for the
selected vowels, (a) aa, (b) ah, (c) er, (d) ih, (e) iy, and (f) uw.
FIG 5. (a) Mean distance of vowels from the speaker centroid of the male and female
speakers by age; (b) Mean distance of vowels from the speaker centroid by sex for the
four age groups (7-12 years, 13-14 years, 15-18 years, and 25-50 years).
FIG 6. Vowel spaces (F1-F0 (Bark)) versus F2-F1 (Bark) for the the men and women
FIG 7. Critical band rate standard deviation of F1 plotted against F0 (Bark) for the
peripheral vowels (aa, ae, ao, eh, iy, uw) (left), and non-peripheral vowels (ah, er, ih, uh)
(right). Values are plotted for the four age groups (7-12 years, 13-14 years, 15-18 years,
and 25-50 years) by sex .
FIG 8. Critical band rate standard deviation for (a) First formant frequency (F1), (b)
Second formant frequency (F2), (c) Third formant frequency (F3) plotted against the
critical band rate of F3 for the peripheral vowels (aa, ae, ao, eh, iy, uw) (left), and
non-peripheral vowels (ah, er, ih, uh) (right). Values are plotted for the four age groups (7-12
years, 13-14 years, 15-18 years, and 25-50 years) by sex .
FIG 9. Critical band rate (bark) difference between F3 and F0 plotted against critical band
rate (bark) of F3 for the peripheral vowels (aa, ae, ao, eh, iy, uw) (left), and
non-peripheral vowels (ah, er, ih, uh) (right). Values are plotted for the four age groups (7-12
years, 13-14 years, 15-18 years, and 25-50 years) by sex .
FIG 10. Ranges in formant frequency values expressed as a function of the difference
between the maximum and minimum formant frequency values for (a) F1 (Bark), (b) F2
(Bark) and (c) F3 (Bark). Values are given for the peripheral and non-peripheral vowel
sets by age group (7-12 years, 13-14 years, 15-18 years, and 25-50 years), for both
FIG 11.Critical band rate (bark) differences between female and male formant frequency
values for (a) F1, (b) F2, and (c) F3 by vowel and age group (7-12 years, 13-14
Age (years) 18 17 16 15 14 13 12 11 10 9 8 7
Mean k1-age value (F1)
1.4 1.3 1.2 1.1 1.0 .9 Sex Male Female Age (years) 18 17 16 15 14 13 12 11 10 9 8 7
Mean k2-age value (F2)
1.4 1.3 1.2 1.1 1.0 .9 Sex Male Female
(a) (b)
Age (years) 18 17 16 15 14 13 12 11 10 9 8 7
Mean k3-age value (F3)
1.4 1.3 1.2 1.1 1.0 .9 Sex Male Female (c) Age (years) 18 17 16 15 14 13 12 11 10 9 8 7
Mean k1,2,3 value ((F1+F2+F3)/3)
Age Group
25-50
18 17
16 15
14 13
12 11
10 9
8 7
Mean kn-sex factor
1.4
1.3
1.2
1.1
1.0
Formant
k1 (F1)
k2 (F2)
k3 (F3)
(a)
Vowel
uw uh
iy ih
er eh
ao ah
ae aa
Mean k-sex value
1.3
1.2
1.1
1.0
Age Group
25-50 years
(adults)
7-12 years
13-14 years
15 -18 years
(b)
[image:42.612.107.426.89.674.2]Age (years) 18 17 16 15 14 13 12 11 10 9 8 7 Mean k -ag e v alu e: aa 1.4 1.3 1.2 1.1 1.0 .9 Sex Male Female Age (years) 18 17 16 15 14 13 12 11 10 9 8 7
Mean k-age value: ah
1.4 1.3 1.2 1.1 1.0 .9 Sex Male Female
(a) (b)
Age (years) 18 17 16 15 14 13 12 11 10 9 8 7
Mean k-age value: er
1.4 1.3 1.2 1.1 1.0 .9 Sex Male Female Age (years) 18 17 16 15 14 13 12 11 10 9 8 7
Mean k-age value: ih
1.4 1.3 1.2 1.1 1.0 .9 Sex Male Female
(c) (d)
Age (years) 18 17 16 15 14 13 12 11 10 9 8 7 Mean k -ag e v alu e: iy 1.4 1.3 1.2 1.1 1.0 .9 Sex Male Female Age (years) 18 17 16 15 14 13 12 11 10 9 8 7 Mean k -ag e v alu e: u w 1.4 1.3 1.2 1.1 1.0 .9 Sex Male Female
(e) (f)
[image:43.612.97.542.59.676.2]Age (years) 25-50 18 17 16 15 14 13 12 11 10 9 8 7
kn-sex value: aa
1.6 1.5 1.4 1.3 1.2 1.1 1.0 .9 .8 Formant freq. F1 F2 F3 Age (years) 25-50 18 17 16 15 14 13 12 11 10 9 8 7
kn-sex value: ah
1.6 1.5 1.4 1.3 1.2 1.1 1.0 .9 .8 Formant freq. F1 F2 F3
(a) (b)
Age (years) 25-50 18 17 16 15 14 13 12 11 10 9 8 7
kn-sex value: er
1.6 1.5 1.4 1.3 1.2 1.1 1.0 .9 .8 Formant freq. F1 F2 F3 Age (years) 25-50 18 17 16 15 14 13 12 11 10 9 8 7
kn-sex value: ih
1.6 1.5 1.4 1.3 1.2 1.1 1.0 .9 .8 Formant freq. F1 F2 F3
(c) (d)
Age (years) 25-50 18 17 16 15 14 13 12 11 10 9 8 7
kn-sex value: iy
1.6 1.5 1.4 1.3 1.2 1.1 1.0 .9 .8 Formant freq. F1 F2 F3 Age (years) 25-50 18 17 16 15 14 13 12 11 10 9 8 7
kn-sex value: uw
1.6 1.5 1.4 1.3 1.2 1.1 1.0 .9 .8 Formant freq. F1 F2 F3
[image:44.612.97.542.85.683.2](e) (f)
Age Group 25-50 years 18 years 17 years 16 years 15 years 14 years 13 years 12 years 11 years 10 years 9 years 8 years 7 years
Mean distance from speaker centroid
2.8 2.6 2.4 2.2 2.0 3.0 Sex Male Female ( a) Age Group 25-50 years
15 - 18 years
13-14 years
7-12 years
Mean distance from speaker centroid
[image:45.612.304.730.99.337.2]A7-12M
B13-14M
C15-18M
D25-50M
W7-12F
X13-14F
Y15-18F
Z25-50F
Group
1.20 1.60 2.00 2.40
F0 (Bark)
0.50 1.00 1.50
F1 CB-rate (Bark)
A B
CD
W X Y Z
peripheral non-peripheral
1.20 1.60 2.00 2.40
F0 (Bark)
A B
C
D YX W
Z
A7-12M B13-14M C15-18M D25-50M W7-12F X13-14F Y15-18F Z25-50F Group
14.00 14.50 15.00 15.50 16.00
F3 CB-rate (Bark)
0.50 1.00 1.50
F1 CB-rate sd (Bark)
A B C D W X Y Z peripheral non-peripheral
14.00 14.50 15.00 15.50
F3 CB-rate (Bark)
16.00 A B
C
D Y X
Z W (a) A7-12M B13-14M C15-18M D25-50M W7-12F X13-14F Y15-18F Z25-50F Group
14.00 14.50 15.00 15.50 16.00
F3 CB-rate (Bark)
1.00 1.50 2.00
F2 CB-rate sd (bark)
A B C D W X Y Z peripheral non-peripheral
14.00 14.50 15.00 15.50 16.00
F3 CB-rate (Bark)
peripheral non-peripheral
A7-12M
B13-14M
C15-18M
D25-50M
W7-12F
X13-14F
Y15-18F
Z25-50F
Group
14.00 14.50 15.00 15.50 16.00
F3 CB-rate (Bark)
0.50 0.75 1.00 1.25 1.50
F3 CB-rate sd (Bark)
A B
C D
W X YZ
14.00 14.50 15.00 15.50 16.00
F3 CB-rate (Bark)
A B
C D
W X Y Z
(c)
A7-12M
B13-14M
C15-18M
D25-50M
W7-12F
X13-14F
Y15-18F
Z25-50F
Group
14.00 14.50 15.00 15.50 16.00
12.50 13.00 13.50
Z3-Z0 (Bark)
A B
C
D
W
X YZ
peripheral non-peripheral
14.00 14.50 15.00 15.50 16.00
A B
C
D
W
X
Y Z
Z3 (Bark) Z3 (Bark)
Age and Sex Group 25-50 (F) 15-1 8 (F ) 13 -1 4 (F ) 7-12 (F) 25-50 (M) 15-1
8 (M) 13 -1 4 (M) 7-12 (M ) M
ax F1 (Bark) - M
in F1 (Bark)
10.0 9.0 8.0 7.0 6.0 5.0 4.0 3.0 2.0
Vowel Data Set
peripheral
non-peripheral
(a)
Age and Sex Group 25-50 (F) 15-1 8 (F ) 13 -1 4 (F ) 7-12 (F) 25-50 (M) 15-1
8 (M) 13 -1 4 (M) 7-12 (M ) M
ax F2 (Bark) - M
in F2 (Bark)
18.0 16.0 14.0 12.0 10.0 8.0 6.0
Vowel Data Set
peripheral
non-peripheral
(b)
Age and Sex Group
25-50 (F) 15-1
8 (F) 13 -1 4 (F ) 7-12 (F) 25-50 (M) 15-1
8 (M) 13 -1 4 (M) 7-12 (M) M
ax F3 (
B
ar
k)
M
in F3 (
B ar k) 18.0 17.0 16.0 15.0 14.0 13.0 12.0 11.0
Vowel Data Set
peripheral
non-peripheral
(c)