City, University of London Institutional Repository
Citation:
Meyer, M. and Dykes, J. ORCID: 0000-0002-8096-5763 (2018). Reflection on
Reflection in Applied Visualization Research Generating Knowledge From Practice. IEEE
Computer Graphics and Applications, 38(6), pp. 9-16. doi: 10.1109/MCG.2018.2874523
This is the accepted version of the paper.
This version of the publication may differ from the final published
version.
Permanent repository link:
http://openaccess.city.ac.uk/21833/
Link to published version:
http://dx.doi.org/10.1109/MCG.2018.2874523
Copyright and reuse: City Research Online aims to make research
outputs of City, University of London available to a wider audience.
Copyright and Moral Rights remain with the author(s) and/or copyright
holders. URLs from City Research Online may be freely distributed and
linked to.
City Research Online:
http://openaccess.city.ac.uk/
[email protected]
Reflection On Reflection In
Applied Visualization
Research
Generating Knowledge From Practice
Reflection is a core method used by visualization researchers to generate knowledge from design practice. There is, however, a lack of standards to inform reflective practice and through which we can judge the quality of the reflection used in visualization research. Reflecting on this gap, we offer priorities for researchers looking to improve the use of reflection in applied visualization research.
An important approach to visualization research focuses on working with real users to solve their real-world problems. This applied research results in a range of types of knowledge contribu-tions, including the design of novel visualization techniques and systems; insights into the effi-cacy of existing principles and techniques in complex, real-world scenarios; and the discovery of new opportunities for visualization to make an impact in how people ask and answer questions with data.
In 2012 Sedlmair et al. [1] proposed a structured and methodical process for conducting a type of applied visualization research known as design study. The paper emphasizes reflection as a criti-cal step in the research process for generating knowledge from the practice of designing visuali-zations, noting that "reflection is where research emerges from engineering". Best practice for reflecting in a design study, according to the paper, might involve “reflecting on lessons learned from the specific situation of study in order to derive new or refined general guidelines[,which] typically requires an iterative process of thinking and writing.” This limited guidance is the ex-tent of existing advice in the visualization literature for generating knowledge from design study.
In our own research groups we use reflection to consider the ways in which a design study is successful (or not), and to speculate about how those results relate to other experiences and could apply to other visualization contexts. The specifics of our reflective practices, however, are not
Miriah Meyer
University of Utah
Jason Dykes
IEEE COMPUTER GRAPHICS AND APPLICATIONS
always the same. Furthermore, we don’t see consensus in the broader community on how we
should be reflecting or even how we could be reflecting, which seems fundamental to the quality of the research that we are doing — the limited discussion in the visualization literature is not enough. What works, what doesn’t, and how certain are we about any of this?
These questions led us to reflect on reflection in applied visualization research in three ways. First, we looked at definitions for reflective practice in the literature of research communities be-yond visualization that engage heavily in reflective practices, including education, management, and healthcare. Second, we initiated a community discussion on reflection by organizing a panel on the topic at the 2017 IEEE VIS conference, the premier venue for visualization research. And third, we conducted several projects where we either explicitly made reflective practice a central focus of the research process or developed approaches to support and expose reflection. In this article we report on our investigation and propose several priorities for ongoing thinking on re-flection in applied visualization research.
DEFINITIONS OF REFLECTION
Reflective practice is an established part of research in fields such as education, management, and healthcare, with the literature from these fields presenting a range of definitions for reflec-tion. For example, in the seminal work on the topic, Schön defines reflection as “the practice by which professionals become aware of their implicit knowledge base and learn from their experi-ence” [2]. In McGill and Brockbank’s pragmatic guide, they provide this definition: “a process by which experience is brought into consideration … to achieve meaning and the capacity to look at things as potentially other than they appear”[3]. More recently, Bolton characterized re-flection as "paying critical attention to the practical values and theories which inform everyday actions, by examining practice reflectively and reflexively… leading to developmental in-sight”[4].
These definitions predominately focus on reflection in practice — do they apply to research? And if so, how? More specifically, how do they apply to visualization research? Existing visuali-zation literature does not explicate the nature of reflective practice in applied research, nor link to the body of literature in other fields. This leads us to ask: how do we use reflection to make implicit knowledge explicit, to interpret what we observe in applied contexts critically and au-thentically, and to use experience and multiple perspectives to derive reliable knowledge from the people, software, and contexts that we study in our visualization research?
PANEL DISCUSSSION ON REFLECTION IN
VISUALIZATION RESEARCH
To begin exploring these questions we organized a panel on reflection in visualization research. The experience of the panelists spanned the gamut of visualization approaches: qualitative analy-sis, controlled studies, technique and systems design, methodology, and design studies. The au-dience consisted of a cross section of conference attendees with expertise across visualization, and who participated in the conversation through traditional questions and answers as well as through live polls conducted using web-based technology.
We identified several key themes in the panel content, captured through an audio recording of the panel, notes taken during the session, and a log of audience responses to key questions raised through live polls conducted during the panel. This content is publicly available via links listed in a companion report, along with a detailed description of our analysis process [5]. Here we summarize the relevant themes.
When to reflect
for design study [1]. Some others made it clear that they reflect throughout the entire design pro-cess. It was noted that internal, personal reflection after the completion of a project is useful in identifying fruitful future directions.
How to reflect
Two specific modalities described in the discussion for inducing reflection were writing and giv-ing talks. Writgiv-ing schemes include draftgiv-ing a paper’s abstract or introduction, writgiv-ing a blog post, developing a slide deck of ideas, or filling out a questionnaire early-on about a project’s goals. Externalizing ideas through giving talks, particularly to colleagues not directly involved with the project, was identified as an opportunity for probing questions that reveal assumptions and internalized, learned knowledge. Open questions remain as to how to capture internalized and unintentional reflection, particularly over long periods of time and across multiple research projects.
What to reflect on
The importance of selecting artifacts and identifying insights to stimulate reflection was evident with several examples suggested as being particularly conducive to reflection. A range of differ-ent approaches for iddiffer-entifying artifacts, insights and evdiffer-ents suitable for reflection were sug-gested, including: considering visualizations as externalizations of mental models; identifying moments of learning as pinpointed through questions by external researchers; and analyzing vis-ualization design failures.
How to report reflections
A significant number of comments focused on a lack of guidance or opportunity for reporting on reflection. Several pointed specifically to a need for more structured guidance on what goes into a reflection section of a research paper – the key means by which most participants present knowledge contributions. Reporting reflection on failures was seen as likely to provide valua-ble knowledge, but the lack of clear venue or mechanism for doing so was identified as a prob-lem given the perceived importance of successful technological artifacts in academic papers.
REFLECTION IN OUR OWN RESEARCH
We purposefully explored the role and impact of reflection in several recent, applied visualiza-tion research projects. In one project, while conducting a design study with global health experts we attempted to deliberately record moments of learning, and reported insights as results of re-flection on these records [6]. In another, we relied on critically reflective practice – an approach to synthesizing experience [7] – to analyze our collective experience of using workshops as a visualization design method[8]. And in a third, we developed a means for capturing design-deci-sion intent and rationale during the visualization design process, and provide reflective schemas to structure the reporting process [9]. We briefly summarize those projects here.
Reflection in design study
IEEE COMPUTER GRAPHICS AND APPLICATIONS
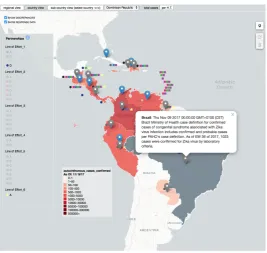
[image:5.567.109.377.112.365.2]this insight, ultimately developing a system to support the experts in externalizing their knowledge about unaccounted-for errors in the data.
Figure 1. A screenshot from a prototype visualization deployed during a design study with Zika experts. Reflecting on the deployment of this tool revealed unaccounted-for errors in the data.
Throughout this design study we collected artifacts upon which we could reflect --- from tran-scripts of interviews to iterations of design ideas. As the study progressed we revisited these arti-facts and reflected on their meanings and implications. We noticed that as we learned more about the problem, our interpretation of the artifacts shifted and changed. Ultimately, it was the deep, reflective thinking that came out in conversations between the visualization team that revealed the importance of the unaccounted-for error in stymieing visual analysis by the Zika team, lead-ing us to develop a framework for reasonlead-ing about this type of implicit error. We speculate that implicit error is prevalent in other domains as well.
Reflection for meta-analysis
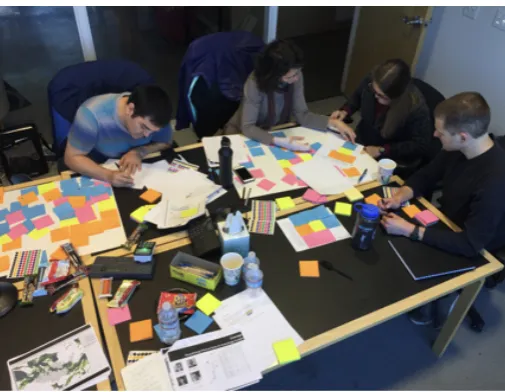
Figure 2. Participants collaboratively brainstorm ideas in a creative-visualization opportunities workshop.
Specifically, our meta-analysis used the approach of critically reflective practice, which “synthe-sizes experience, reflection, self-awareness and critical thinking to modify or change approaches to practice” [10]. This approach provided us with a methodology to combine analysis of work-shop documentation and existing theory with our collective experience. Conducted over two years, our reflective analysis iterated between: focused periods of analysis and writing; incuba-tion and reflecincuba-tion on what we had written; followed by more analysis and rewriting. We gener-ated a broad range of artifacts during the analysis to support our reflection, including an evolving model for describing CVO workshops, written reflections on workshop successes, and collabora-tive writing about the overall value of workshops to applied visualization research.
Recording reflection
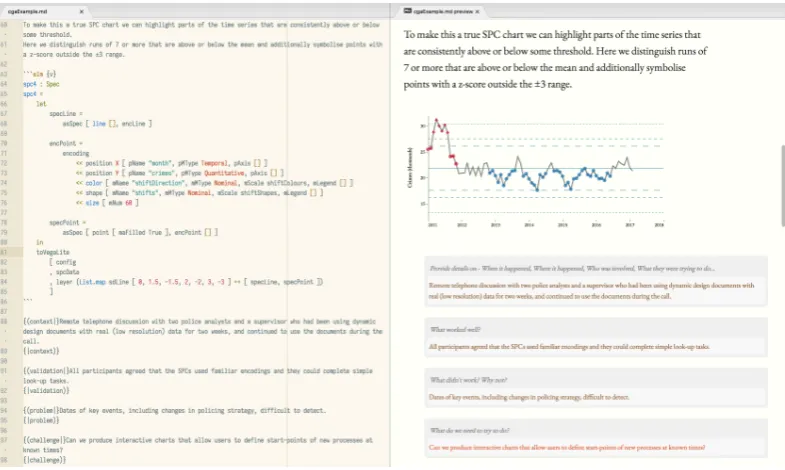
LitVis is an environment for literate visualization that enables designers to create graphics with concise statements and describe their design choices as they do so [9]. The intention is to give designers the flexibility to produce expressive graphics quickly, while minimizing the effort re-quired to explain them. The design narratives that result are a means of validating the graphics and may help with the design process, but they also provide a source for reflection.
IEEE COMPUTER GRAPHICS AND APPLICATIONS
Figure 3. A screenshot from our LitVis environment showing the markdown (left) and rendering (right) of a design description and design narrative that employ an example reflective schema that requires a series of prompts for reflection.
PRIORITIES: REFLECTION ON REFLECTION ON
REFLECTION
Through a reflection on the three sources of data – definitions of reflective practice, a panel dis-cussion on reflection in visualization research, and our own experiences explicitly incorporating reflection in research projects – we developed several priorities that may be valuable in estab-lishing standards of good, reflective practice in applied visualization research.
Establish processes and tools for reflective practice
The panel discussion, and our experiences, suggest that many researchers in the visualization community actively engage with reflective practice and good reflection can lead to important research contributions for the community. Reflection, however, seems to occur in ad-hoc and rather limited ways, with a bias towards post-study reflection. While it is clear that reflection plays a role in how we synthesize months, or years, worth of work during the process of drafting an academic paper, there is little concurrence in the practice of structured reflection during the design process. When does reflection occur, what triggers it, and what should we be capturing from it? We speculate that this gap has led to lost insights and opportunities for learning, and more fundamentally, may pose a threat to the underlying validity of research results that emerge from visualization design practice.
As a first step, the community needs rich(er) descriptions of design activities, artifacts, observa-tions, and experiences, and reflective synthesis based upon this data. These descriptions could address some of the challenges associated with developing evidence to support claims, reducing possible cognitive biases associated with memory or searching strategies at paper writing time, and linking evidence across applied visualization projects in meta-studies. But there
useful, manageable, and not inhibit what are naturally rapid and reactive design processes; the processes for synthesizing this information into reliable knowledge claims must be reported and robust.
We recommend a more structured and purposeful approach to reflection throughout the entire design process, including guidance on when to reflect, how to trigger reflection, and what to cap-ture from the reflective process. We find through reflection on our own practices that design studies and other applied research projects involve tight cycles of action and evaluation as well as longer cycles of engagement, with each requiring ongoing and continued reflection. Standards of good reflective practice in visualization research – with tools and methods to support this -- would enable the community to make better use of reflection and, importantly, provide us more confidence in the quality of the findings from applied visualization research, moving the disci-pline forward in new and interesting ways.
Develop appropriate formats for recording and reporting
reflections
The lack of consensus on what is useful to include in descriptions of design activities points to the need for varying levels of granularity in both the recording and reporting of reflective synthe-sis. While some researchers during the panel discussion encouraged recording and reporting eve-rything— from screenshots to transcripts to notes to slide decks — others pleaded for
annotations and reflective summarizations to accompany captured artifacts. We suggest that mul-tiple levels of granularity are important as different levels are useful for different types of analy-sis: low-level, technology and design artifacts with reflections may be a source of inspiration for transferring ideas to other problems and domains, while high-level reflective synthesis will bene-fit meta-analysis across multiple projects.
The familiar overview+detail approach for navigating complex data could be a useful model for organizing raw artifacts and guiding reflective practice. The ways that descriptions of the design process could be used — for the reflective researcher throughout the project, as inspiration for other projects, in validation of insights, for studying patterns across many projects — necessitate varying levels of details and analysis, as well as an accessible organizational structure. Further-more, releasing a rich design description requires a reporting outlet free from the constraints of a traditional academic paper; supplemental materials, design reports, and companion reposito-ries offer opportunities that may be useful to explore.
Finally, only reporting on events that support a particular claim -- such as “the software worked well for our users” -- is a missed opportunity in complex, applied contexts when knowledge be-yond the designed visualization is potentially valuable and insightful. In our recent projects we experimented with releasing audit trails [11] as supplemental material, attempting to capture the evolution of our learning and thinking in a curated set of documents to provide additional con-text to our decisions and claims. Our intention is that the documents not only provide auditable evidence to support our claims, but that they could also allow additional opportunities for knowledge transfer beyond the techniques and results we report in the research papers.
Understand the role of reflection in existing methodologies
IEEE COMPUTER GRAPHICS AND APPLICATIONS
place to start. Some efforts to transfer methods from these domains to settings that involve tech-nology and design are promising [12,13].
CONCLUSION
Reflection is an important approach for generating knowledge from practice in applied visualiza-tion research. The panel discussion on this topic at the 2017 IEEE VIS conference provided plenty of evidence confirming that reflection is occurring and valued in visualization research. The panel helped us identify a significant opportunity for the community to define how we can use reflection effectively in our research approaches, how we can judge work that relies upon it in a consistent and fair way, and how we can use knowledge acquired through reflection to improve understanding of our domain. Our recent investigations into reflective practice in sev-eral visualization research projects highlight the breadth of opportunities for using and support-ing reflectsupport-ing practice. Still, there is limited guidance in the visualization literature on how to reflect, when to reflect, or what to record and report on.
As a community we need to establish the role of reflection in visualization research and how we can use this practice effectively to make substantive and reliable knowledge claims while also enabling others to judge these claims -- learning from other disciplines is likely to be im-portant. Reflection may help us make the difficult step away from relying upon system success or visualization novelty to prove worth, and to instead move towards a research culture where we embrace methods that allow us to learn more broadly in applied contexts. To start, we need to develop ideas about the key themes identified in this report: when to reflect, what to reflect on, and how to structure, report, use, and validate reflection within and beyond the context of an aca-demic research paper. We believe that structured guidance for reflective practice has the poten-tial to increase the reliability, quality, and impact of applied visualization research, and that the themes and priorities we report in this article point to opportunities to achieve this.
ACKNOWLEDGMENTS
We gratefully acknowledge our colleagues that helped us to reflect on reflection: Uta Hin-richs, Remco Chang, Petra Isenberg, Heidi Lam, Tamara Munzner, Nina McCurdy, Ethan Kerzner, Sarah Goodwin, Sara Jones, Jo Wood, and Alexander Kachkaev. We are also grateful to Alex Endert, Michael Sedlmair and Ivan Viola, Panels Chairs at IEEE VIS 2017.
REFERENCES
1. M. Sedlmair, M. Meyer, and T. Munzner. Design study methodology: Reflections from the trenches and the stacks. IEEE Trans. Vis. Comput. Graphics, 18(12):2431– 2440, 2012.
2. D. A. Schön. The Reflective Practitioner. Basic Books, New York City, NY, USA, 1988.
3. A. Brockbank and I. McGill. The action learning handbook: Powerful techniques for education, professional development and training. Routledge, 2003.
4. G. Bolton. Reflective practice: Writing and professional development. Sage publications, 2010.
5. J. Dykes and M. Meyer. Reflection On Reflection In Design Study. arXiv preprint arXiv:1809.09417 (2018).
6. N. McCurdy, J. Gerdes, and M. Meyer. A Framework for Externalizing Implicit Error Using Visualization. IEEE Trans. Vis. Comput. Graphics, to appear.
8. E. Kerzner, S. Goodwin, J. Dykes, S. Jones, and M. Meyer. A Framework for Creative Visualization-Opportunities Workshops. IEEE Trans. Vis. Comput. Graphics, to appear.
9. J. Wood, A. Kachkaev, and J. Dykes. Design Exposition with Literate Visualization. IEEE Trans. Vis. Comput. Graphics, to appear.
10. S. Thompson and N. Thompson. The Critically Reflective Practitioner. Palgrave Macmillan, New York, NY, USA, 2008.
11. M. Carcary. The research audit trail-enhancing trustworthiness in qualitative inquiry. The Electron. J. of Bus. Res. Methods, 7(1), 2009.
12. M. Sein, O. Henfridsson, S. Purao, M. Rossi, and R. Lindgren. Action design research. MIS Qarterly, 35(1):37–56, 2011.
13. N. McCurdy, J. Dykes, and M. Meyer. Action design research and visualization design. Proceedings of the Sixth Workshop on Beyond Time and Errors on Novel Evaluation Methods for Visualization. ACM, 2016.
ABOUT THE AUTHORS
Miriah Meyer is an associate professor in the School of Computing at the University of Utah. Her research focuses on the design of visualization systems for helping analysts make sense of complex data, as well on the development of methods for helping visualization de-signers make sense of real-world problems. Meyer received a PhD in computer science from the University of Utah. Contact her at [email protected].
Jason Dykes is a professor of visualization in the giCentre at City, University of London. His research involves the design and use of maps and graphics in applied contexts. Dykes received a PhD in geographic information science from the University of Leicester. Contact him @jsndyks or [email protected].