Int. J. Electrochem. Sci., 13 (2018) 7968 – 7988, doi: 10.20964/2018.08.39
International Journal of
ELECTROCHEMICAL
SCIENCE
www.electrochemsci.org
Preparation of Encapsulated Sn-Cu@graphite Composite
Anode Materials for Lithium-Ion Batteries
Venroy Watson1, Yaw Yeboah1, Mark Weatherspoon2, Jim Zheng2, Egwu Eric Kalu1,*
1
Department of Chemical and Biomedical Engineering, FAMU-FSU College of Engineering, 2525 Pottsdamer St., Tallahassee, FL 32310
2
Department of Electrical and Computer Engineering, FAMU-FSU College of Engineering, 2525 Pottsdamer St., Tallahassee, FL 32310
*
E-mail: [email protected]
Received: 20 March 2018 / Accepted: 17 May 2018 / Published: 5 July 2018
Electroless encapsulation of graphite particles with copper-tin alloy (Sn-Cu@graphite) is demonstrated as a feasible anode preparation method that is cost effective and provides both high cyclability and reversible capacity. Heat treatment of the electroless composites at 200 oC yielded Sn-Cu@graphite anode composites with a 20 wt.% Sn loading, specific surface area of 22.5 m2/g and a 1st discharge capacity of 1074 mAh/g at 0.2C rate. In contrast, the graphite substrate particles used for the encapsulation has a surface area of 2.34 m2/g) and a 1st cycle discharge capacity of 327 mAh/g at 0.2 C rate. At the 300th cycle, these capacities decreased to ~400 mAh/g and 208 mAh/g for the Cu@graphite and graphite substrate, respectively. Above 300 cycles, the electroless encapsulated Sn-Cu@graphite anode maintained a capacity higher than that determined experimentally and theoretically for graphite. The electrochemical impedance and cyclic voltammetric results demonstrate that the electroless encapsulated Sn-Cu@graphite anode has very low resistance and high reversible redox reactions. The higher capacity and long term cycling (> 300 cycles) achieved with the electroless composite anodes are attributed to the buffering effect of the electroless Cu in the Sn-Cu alloy encapsulating graphite particles, Sn-Cu@graphite’s higher surface area (22.5 m2/g), and curvature of the graphite particles. The electroless encapsulated Sn-Cu graphite composite anode materials with extended cycling have potential application for the anode of Li-ion battery.
Keywords:Copper tin alloy, Tin oxide, Anode, Lithium ion battery electrode
1. INTRODUCTION
commonly argued that for higher energy density applications, other electrode materials must be considered [3]. Si, Ge, Al, Li, and Sn are a few of the potential candidate metal electrode materials to have been investigated as anode materials recently. Sn for example, exhibits a theoretical capacity of 994 mAh/g, a value that is almost 2.5 times that of graphite. Tin is also abundant, environmentally benign and can be used as anode materials in various chemistries including SnSe2, SnS2, SnO2, and
SnCu alloys, just to name a few [4-8].
Despite the positive attributes of the variety of Sn anodes materials explored, we are still faced with the challenge of fabricating tin anodes materials that offer high capacity retention and long-term cycling. The poor capacity retention and cyclability of tin anodes are caused by the large volume change of ~300 % during alloying and dealloying with lithium ions. This volume expansion results in cracking and pulverization of Sn’s particles that results in loss of particle to particle contact and electrode to particle contact [3].
To minimize the negative effects caused by the volume expansion of Sn, several approaches have been undertaken to fabricate Sn anode materials [9-12]. A recent area of interest has been to incorporate active/inactive matrix such as C and Cu in the Sn anode material. For example, the use of carbon coating on SnO2 nanoparticles have been reported by Lou and coworkers [9]. It is believed that
C coating buffered Sn expansion thus enhancing cycling and capacity retention of a Sn-anode composite. In a similar approach, Liu et al. reported a high initial discharge capacity performance (1050 mAh/g) of a carbon encapsulated copper-tin alloy composite (Cu6Sn5) [10] synthesized via
reductive precipitation and heating to 900 oC. The high capacity was attributed to the buffering effects of Cu and the carbon layer maintaining nanoparticles’ stable dimension during alloying and dealloying with lithium ions. Furthermore, through sputtering, Deng and co-workers synthesized Cu-Sn nanopillar nanocomposite that was cycled up to 50 cycles with high capacity. It was found that the presence of Cu buffers Sn expansion during lithiation/delithiation thus lowering Sn’s pulverization [11]. Most recently, Park and co-workers demonstrated the fabrication of a 3D Cu-Sn anode using freeze-casting process and electrolytic deposition method [12] via external power supply by starting with porous 3D copper foam. The 3D Cu-Sn anode exhibited reasonable performance that was attributed to the lower diffusion length of Li ions and voids that allowed the 3D Cu-Sn network to undergo volume change without much pulverization [12].
not form alloy or react with carbon, it potentially forms a Cu-Sn alloy with the electroless Sn encapsulating it. This provides significant opportunity for both the Sn-Cu and graphite to be active for lithiation and delithiation at the same time especially where cracks or nanopores for Li-ion exist in the Sn-Cu encapsulating layer.
In addition, unlike the previously reported fabrication of porous 3D Cu6Sn5 alloy using
electrochemical deposition by Shin and coworkers that requires as high a current as 5 A/cm2 to drive tin deposition, our approach does not require external energy input and encapsulation is done at room temperature [13]. In this approach, the electroless method used, required less energy to drive the deposition process. The driving force for electroless deposition is derived from the natural thermodynamics of the process. The driving force for electroless copper deposition is derived from a chemical reducing agent (formaldehyde) and for the electroless deposition of Sn, the electrochemical potential of strongly complexed Cu+ ion (by thiourea) drives the displacement of Cu by Sn2+ ions for the deposition of Sn and subsequent encapsulation of the Cu layer in an acid solution containing sodium hypophosphite (reducing agent) and thiourea. The role of thiourea is to complex Cu driving its potential below that of Sn and thus reversing the Sn and Cu deposition potentials and making it possible for Sn ions to displace Cu ions (while Cu is exposed to the solid Sn solution) thus resulting in the plating of Sn [14, 15]. This work also differs from the electroless encapsulation or coating of copper with Sn (lithium active component) in which copper substrate (often 3D foam) is used [11-13] without graphite interior. In the present work, the graphite interior which is also active for lithium intercalation differentiates our approach from other methods. We aim to develop an easy to implement cost effective method that provides an anode electrode with inner graphite core which has high cyclability and reversible capacity higher than that of graphite and when the high capacity component (e.g. Sn, SnOx or Sn-Cu alloys) of the electrode fails or is exhausted, the electrode performance then
reverts to the known performance characteristics of the inner graphite core component.
In this work, a cost effective electroless encapsulation method was used to prepare Cu@graphite composite anode with 20 wt. % Sn loading. A comparative study between the unique Sn-Cu@graphite composite and pristine graphite electrodes is undertaken to demonstrate for the first-time the long-term cycling and capacity retention obtained using anode made from graphite particles encapsulated with electroless Sn-Cu alloy intermetallics. We compare the morphology, discharge capacity retention, coulombic efficiency, and rate capability of both electrodes – Sn-Cu@graphite composite vs graphite composite only electrode.
2. EXPERIMENTAL
2.1 Raw materials
hydroxide, thiourea (CH4N2S), and stannous sulfate were purchased from Sigma Aldrich Corporation
(St. Louis, MO). Other chemicals purchased from Sigma Aldrich Corporation include methyl alcohol (CH3OH), dimethylformamide (DMF), 99.5% and 90% nitric acid. 1.0 molar lithium
hexafluorphophate (LiPF6) dissolved in ethyl carbonate and dimethyl carbonate was obtained from
BASF Corporation (Florham Park, NJ). In addition, glass fiber separator was purchased from EL-CELL Corporation (Hamburg, Germany). All materials utilized in this experiment were of research grade and did not require further refinement.
2.2 Electroless encapsulation of graphite particles with copper and subsequently tin
The electroless deposition technique is cost effective and easy to implement. Cu was electrolessly deposited on Pd activated graphite. Graphite’s particles were activated using Pd ink with the following composition: 50 g poly-vinyl butyral, 250 mL methanol, 5 mL sodium hydroxide, and 0.5 g palladium acetate. 1 gram of graphite particle requires only about 15 ml of the Pd-ink for activation. The activated graphite was put to dry in an oven at 350 oC for 24 hours. The graphite particles were subsequently immersed in an electroless copper bath while stirring for 1 hour at 25 oC. The composition of the electroless bath was made up of 5.99 g/L of copper sulfate pentahydrate, 26.99 g/L of EDTA, 48.9 g/L of formaldehyde, and 0.05 g/L of 2,2-dypiridyl nitric acid solution. After deposition, the Cu encapsulated graphite was filtered and rinsed in deionized water three times and dried at 71 oC for 24 hours and sample weight was determined.
To prepare the Sn-Cu alloy material, the Cu encapsulated graphite powder was weighed and suspended in an electroless plating tin bath for 1 hour (at 25 oC) thus allowing encapsulation by Sn. The tin bath constituents were 28 g/L of stannous sulfate, 80 g/L of sodium hypophosphite, and 80 g/L of thiourea. A new material (Sn-Cu-graphite or Sn-Cu@graphite) now encapsulated in tin was obtained. The Sn-Cu@graphite composite was filtered and dried at 71 oC for 24 hours. The sample was annealed at 200 oC for 2 hours and amount of deposited Sn subsequently determined.
2.3 Synthesis of graphite and Sn-based anodes using conventional wet chemistry method
2.4 Material characterizations
On completion of the electrode fabrication, morphological characterization of the electrode was conducted. Morphology of the electrodes’ surfaces was obtained using a ZEISS 1540 scanning electron microscopy (SEM). Furthermore, energy dispersive spectroscopy (EDS) was performed on the same machine to determine the elemental composition/presence of the deposited metals. Transmission Electron Microscope (JEM-ARM200cF) was used to determine the morphology, crystallinity and to perform elemental mapping. A Perkin Elmer PHI 5000 series XPS system with non-monochromated Mg K radiation was used to perform X-ray photoelectron spectroscopy analysis in order to determine the chemical state of the surface materials. The phase or structural characterization of the deposits was determined using X-ray diffraction (XRD) and the patterns were captured via Siemens model D500 θ-2θ goniometer. Nitrogen adsorption/desorption performed on Autosorb iQ2
Quantachrome Instrument were used to obtain the specific surface areas of the graphite and Sn-Cu@graphite materials.
2.5 Electrochemical characterizations
To observe the electrochemical performances of all electrodes (graphite and Sn-Cu@graphite), half-cells were assembled in an argon filled glove box using the fabricated electrodes as cathodes and Li metal as anode in a coin cell. The electrolyte used was 1 molar lithium hexafluorophosphate (LiPF6)
in dimethyl carbonate (DMC) and ethyl carbonate (EC). Glass fiber membrane separator with diameter of 18 mm and thickness of 1.55 mm was used. Electrochemical performance between 0.007 V-1.50 V was measured during charging and discharging of the coin cells using Neware battery testing analyzer with 5 V and 10 mA as the unit’s maximum voltage and current, respectively. This system was connected to a Compaq computer. Gamry Instruments Reference 3000 Potentiostat/Galvanostat/ZRA was used for cyclic voltammetry (CV) and electrochemical impedance spectroscopy (EIS) analysis. CV analysis was done at 0.5 mV/s between 0 V and 1.5 V. Furthermore, EIS was performed from 106 Hz to 0.01 Hz at 100 % state of charge. All of these characterizations were performed at room temperature.
3. RESULTS AND DISCUSSION
3.1 Mechanism for Cu and Sn electroless deposition forming Sn-Cu@graphite anode material
Frequently, copper tin alloys are synthesized using a wide variety of methods including heating copper and tin particles, exposing copper tin to crushing via ball milling, electrode deposition, or solution reduction method, for example [14] However, in this study, we adopted the simple electroless deposition synthesis technique to obtain Cu-Sn alloy, Sn, and SnOx [14,15] As mentioned previously,
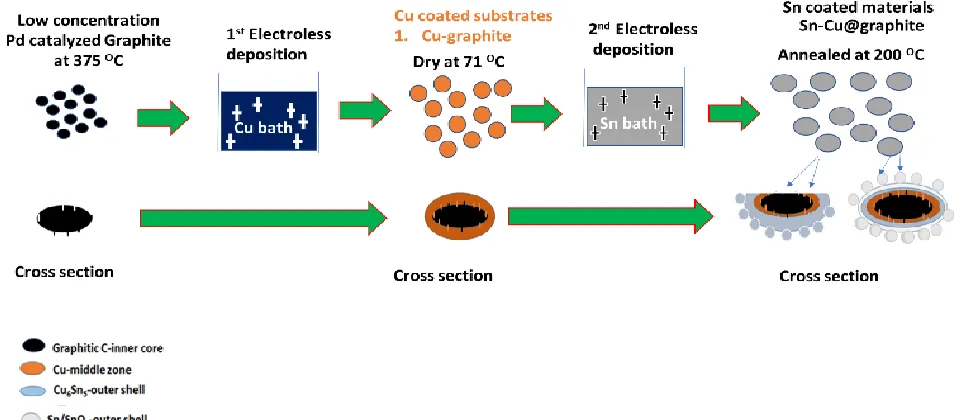
Figure 1. Cartoon schematizing the electroless deposition and heat treatment of Cu and Sn forming Sn, SnO2 and Sn-Cu@graphite anode material.
[image:6.596.60.537.75.285.2]Once Pd catalyzed graphite was submerged in the copper sulfate bath with formaldehyde, immediately oxidation of formaldehyde occurred on the Pd catalyst thus releasing 2e-. These 2e- are then combined with Cu ions (reduction reaction) in solution and resulted in plating of Cu on the Pd catalyzed graphite surface (Figure 1) [16]. In addition, plated Cu can autocatalytically oxidize formaldehyde and this results in reduction of Cu ions and increase Cu plating/deposition. The equations governing formaldehyde oxidation which leads to deposition of Cu is given by Eqs. 1 and 2 [16,17].
Electroless Cu deposition is followed by electroless Sn deposition as schematized in Fig. 1. According to Zhao et al. electroless Sn deposition on Cu submerged in Sn bath with sodium hypophosphite and thiourea occurs in two reaction steps. Firstly, a displacement reaction and secondly, a reduction reaction [14]. During the displacement process, Copper forms a complex with thiourea. This results in the dissolution of Cu ions in the solution. The copper thiourea complex can displace Sn ions, while Sn ions deposited on the Cu graphite surface form CuSn alloy with layer thickness up to micrometer size at the Cu/Sn boundary. The complexing and displacement reactions governing steps are expressed in Eqs. 3 and 4, respectively. As commonly known, thiourea plays a vital role as an effective complexing agent, since it lowers the standard electrochemical potential of Cu+/Cu beyond that of Sn2+/Sn thus resulting in the displacement reaction [14].
ions reduction [14, 18-20].The combined displacement and reduction reactions during the electroless deposition of Sn results in the formation of CuSn alloy and pure Sn/SnOx layer as depicted in Fig. 1.
3.2 Morphological characterization
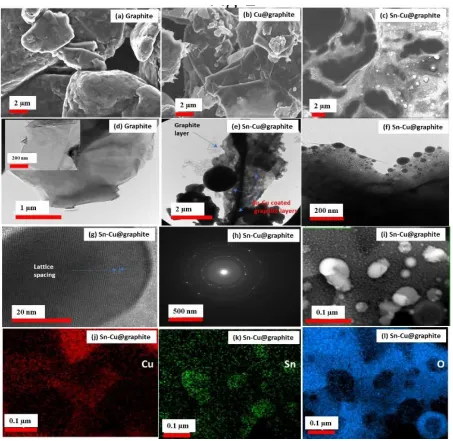
Figure 2. SEM showing the morphology of (a) graphite, (b) Cu-graphite, and (c) Sn-Cu@graphite.
[image:7.596.73.526.172.613.2]
anode material with graphite particles ranging from 3 µm to 7 µm. Fig. 2b illustrates the morphology of the graphite material after electroless coating with Cu. Fig. 2c shows Sn-Cu@graphite composite anode material, with Sn-Cu coating on graphite particles and the deposited particles sizes range from approximately ~50 nm to 1.5 µm. As TEM images for (d) graphite and (e-g) Sn-Cu@graphite, (h) electron diffraction pattern for Sn-Cu@graphite, (i) bright field imaging for Sn-Cu@graphite, and (j-l) respective elemental maps for Cu, Sn and O. expected, areas of the Sn-Cu@graphite material became very bright and shiny after Sn-Cu encapsulation and particles of various sizes were observed. We believe the increase in shininess and smoothness of the Sn coated sample and the difference in morphology versus the graphite sample indicates the successful electroless encapsulation of graphite with Cu and Sn. In addition, Fig. 2d - l illustrates the TEM analysis of the materials.
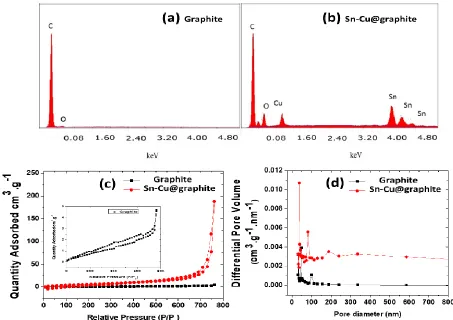
Figure 3. EDS spectra corresponding to (a) graphite, (b) Sn-Cu@graphite. (c) nitrogen adsorption/desorption isotherms for graphite and Sn-Cu@graphite, and (d) BJH pore size distribution for graphite and Sn-Cu@graphite.
[image:8.596.69.522.252.572.2]
obtained from the selected area electron diffraction (SAED). Very defined circular rings characteristic of the polycrystalline metallic material coating on graphite is shown. To determine the elemental distribution of the electrolessly deposited Cu and Sn, elemental energy-dispersive spectroscopy was performed. As shown by Fig. 2i, bright field imaging shows a wide distribution of particles on graphite’s surface depicted by the contrast of the atom dense particles. The elemental maps corresponding to this area is shown in Figs. 2j - l, and Cu, Sn and oxygen are widely distributed thus corroborating our earlier speculation made in Fig. 1 about the formation of copper tin alloy, tin, and tin oxide on the outer layers. Further identification and quantification of the elements in the electrode materials was done by EDS. EDS spectra for the graphite material and the electrolessly encapsulated graphite (Sn-Cu@graphite composite) are shown in Fig. 3a - b. As anticipated, C peak is very prominent in Fig. 3a because that material consists of pure graphite.
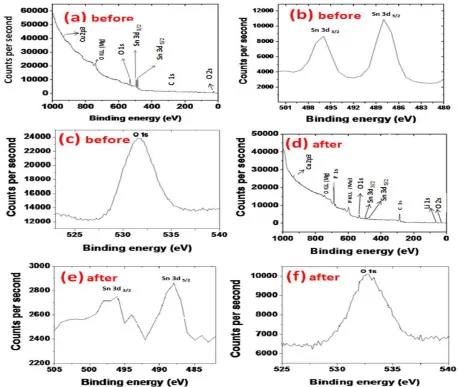
Figure 4. XPS spectra corresponding to (a-c) surface composite of pristine Sn-Cu@graphite before cycling; (d-f) Sn-Cu@graphite after 300 cycles.
[image:9.596.69.527.278.665.2]
constitute approximately ~20 wt.% of the Sn-Cu@graphite composite anode. This matches the experimental wt.% obtained.
The adsorption/desorption isotherms of nitrogen (N2) in addition to the pore width distribution
for graphite and Sn-Cu@graphite materials are shown in Fig. 3c and d, respectively. Adsorption/desorption isotherms exhibiting a hysteresis loop at high partial pressure values match the type III isotherm and they correspond to materials with macropores (Fig. 3c). A total specific surface area of 2.34 m2/g and 22.5 m2/g were obtained from Brunauer-Emmet-Teller (BET) analysis for graphite and Sn-Cu@graphite materials, respectively. Pore size distribution from Barrett-Joyner-Halenda (BJH) analysis indicates the materials pore sizes range from 50 nm to 600 nm matching a combination of mesopore and macropore materials (Fig. 3d).
X-ray photoelectron spectroscopy (XPS) analysis was performed to obtain chemical state of the surface of the Sn-Cu@graphite anode material prior to cycling (Fig. 4a - c) and after completion of 300 cycles (Fig. 4d - f). Fig. 4a shows the general XPS survey spectrum of Sn-Cu@graphite anode material, revealing the existence of copper, oxygen, tin, and carbon. The peak related to Cu (0) is located at 933 eV. The corresponding peaks for Sn 3d which could be attributed to SnO2 are observed.
As shown in Fig. 4b, the Sn 3d peaks related to Sn 3d3/2 and Sn 3d5/2 are located at 494 eV and 488 eV,
respectively. The C 1s peak located at 284 eV are attributed to C-C from the graphite and conductive graphite used in the electrode fabrication. Peaks related to oxygen O 1s and O 2s are located at 550 eV and 30 eV, respectively. The presence of SnO and SnO2 could be the sources of oxygen. The XPS
[image:10.596.88.482.427.690.2]surface chemistry corresponds with the EDS elemental identification of the pristine Sn-Cu@graphite obtained electrolessly.
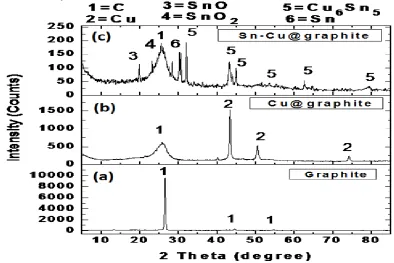
XRD analysis was conducted to determine the crystallographic structure of the coated and uncoated carbon as shown in Fig. 5. Fig. 5a is the graphite composite electrode XRD pattern with peaks at 2θ approximately equal to 26.5o
and 45o, 55o that is representative of graphitic carbon. As expected, in Fig. 5b, the Cu encapsulated graphite shows diffraction peaks of both C (@2θ = 26.5o,45o, 55o) and metallic Cu (@2θ = 44o, 50o, 75o) [12]. Sn-Cu@graphite composite electrode material shown in Fig. 5c reveals that metallic Sn was successfully deposited on the Cu@graphite particles. This corresponds very well with previous SEM and EDS results.
3.3 Electrochemical characterizations
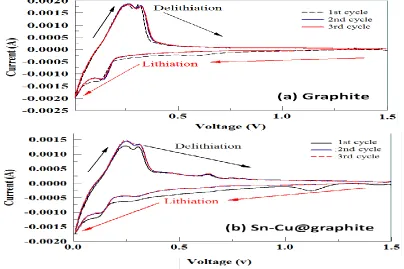
To assess and compare the electrochemical performances of the graphite and Sn-Cu@graphite composite anodes, half-cells were assembled as stated previously. Cyclic voltammetry (CV) was conducted between 0.0 V – 1.5 V at 0.5 mV/s for the verification of electrochemically active voltage regions of the fabricated anodes and the results are shown in Fig. 6. The first three cyclic voltammetric curves obtained from graphite composite anode are shown in Fig. 6a. During the first cycle’s lithiation of graphite, a cathodic peak is observed at 0.65 V and as the cell voltage decreased to 0.007 V, a second cathodic peak emerged at ~0.175 V and a third peak close to 0.007 V. These latter two peaks are characteristic of Li intercalating C as depicted by Eq. (6). In the opposite direction, for the first cycle’s delithiation of graphite, two anodic peaks are located at 0.25 V and 0.35 V, respectively. Equation depicting the reversible lithiation/delithiation is shown in Eq. (6).
[image:11.596.79.483.448.717.2]
For the second and third cycles, a lithiation peak was only observed close to 0.007 V indicative
of lithium insertion into C forming LiCy, while the peak that was previously present during the
1st lithiation of graphite at 0.65 V disappeared completely. Graphite’s delithiation process for the second and third cycles was characterized by peak at 0.25 V and 0.35 V, respectively. This is similar to the first cycle’s delithiation process thus indicating that there are no new reactions occurring when C is delithiated. It is evident that the peak current for the first cycle’s lithiation of graphite is slightly higher than the second and third cycles between 1.5 V and 0.25 V. We believe this could be ascribed to an irreversible first cycle capacity loss. Fig. 6b shows the first three cyclic voltammograms for Sn-Cu@graphite composite anode. During the first cycle’s lithiation process, cathodic peaks are seen at 1.4
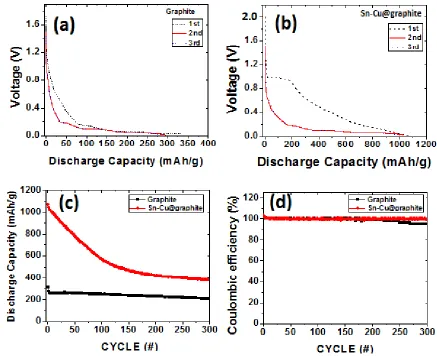
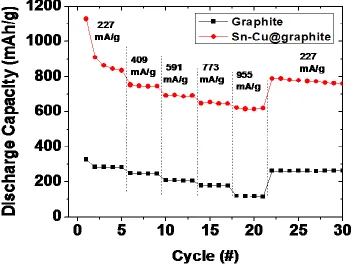
Figure 7. Half-cell of graphite anode composite and Sn-Cu@graphite anode composite results showing (a) Graphite’s 1st
3 specific discharge capacity curves, (b) Sn-Cu@graphite’s 1st 3 specific discharge capacity curves, (c) long-term cycling at 227 mA/g and (d) Coulombic efficiency.
V and 1.15 V that are likely due to the decomposition of electrolyte and the formation of solid electrolyte layer (SEI) [21,22]. The slight peak at 0.75 is attributed to the reduction of SnO2 to Sn and
LiO2. While, the peak located at 0.35 V is ascribed to lithium insertion into Cu6Sn5 thus forming
[image:12.596.78.515.255.611.2]
Li4.4Sn [21-23].In addition, we can also attribute the peaks at 0.15 V and ~ 0.007 V to graphite’s
lithiation. The first cycle’s delithiation or dealloying of LiySn to Sn and Cu6Sn5 [5], is characterized by
four anodic peaks centered at approximately 0.25 V, 0.35 V, 0.65 V, and 0.75 V, respectively. During the second and third cycles, lithiation peaks were very similar, almost overlapping except close to 0.007 V. The peak currents for these two cycles were slightly lower than that of the first lithiation process thus indicating the irreversible capacity lost maybe due to SEI formation during the first cycle. Similar to the first cycle’s delithiation, the second and third cycles exhibited overlapping anodic peaks.
The open circuit voltage of the uncycled half-cell of the graphite composite anode was 1.76 V prior to the first lithiation of C. Fig. 7a presents first cycle discharged capacity obtained by cycling freshly made half-cells at 227 mA/g from open circuit voltages to 0.007 V. As shown, 1st cycle specific discharge capacity obtained was 327 mAh/g and also shown are the second and third lithiation curves for graphite anode composite (Fig. 7a). The second and third discharge capacities for the graphite are 296 mAh/g and 292 mAh/g, respectively. Following the trends observed for the graphite cyclic voltammograms, the graphite lithiation curves exhibited three plateaus at 0.25 V, 0.15 V and ~0.007 V, respectively. These shoulders are indicative of carbon’s lithiation shown by Eq. (6). The comparison of the three cycles’ discharge capacities reveals that first discharge capacity was higher than the second and third cycles due to irreversible capacity loss. Regardless of the 1st cycle’s capacity loss, the overlapping of the 2nd and 3rd peaks indicate the reversible capacity performance of the graphite anode. Fig. 7b represents the first three discharge cycles of Sn-Cu@graphite composite anodes. Uncycled half-cell with potential of 2 V was discharged to 0.007 V similar to graphite’s half-cell. First cycle discharge capacity was 1074 mAh/g. Liu et al. reported a comparable result of ~1000 mAh/g for a 1st cycle discharge capacity for carbon coated Sn-Cu anodes [10].As seen, Sn-Cu@graphite composite anode first discharge curve exhibits plateaus at ~1.0 V and 0.8 V. These plateaus could be attributed to irreversible SEI formation, electrolyte’s decomposition and reduction of oxide impurities according to Liu et al [10].Furthermore, between 0.8 V and 0.2 V the following reactions occur, SnO2 to Sn and
formation of Li2O(Eq. (7) and Eq. (8)), and Cu6Sn5 lithiation thus forming Li2CuSn (Eq. (9)).
Below 0.2 V, closer to 0.007 V the plateau is indicative of fully lithiated Sn (Li4.4Sn (Eq. (10)))
thus corresponding well with CV peaks observed in the same voltage region during the first discharge. Sn-Cu@graphite composite 2nd and 3rd discharge curves (lithiation) overlap with the plateau occurring below 0.3 V to 0.007 V matching peak locations for CV curves. The capacity of the 1st cycle is higher than the 2nd and 3rd discharge capacities. Interestingly, the plateau found in the 1st discharge curve at ~1 V disappeared during 2nd and 3rd lithiation of Sn-Cu@graphite. Therefore, we deduce that the 1st lithiation exhibited irreversible capacity loss which is common in the presence of tin oxides electrode materials. From the observed XRD results, we believe that our Cu-Sn alloy is dominated by Cu6Sn5. In
that case, with Cu6Sn5 the 2nd and 3rd lithiation/delithiation processes of the Sn-Cu@graphite
The long-term cycling performance at 227 mA/g of the cells is examined in Fig. 7c where the discharge capacity from 1st cycle to 300th cycle is given. For both the graphite and the Sn-Cu@graphite composite anodes, the first cycle exhibited an irreversible capacity. However, for graphite, stable cycling with gradual capacity decrease was obtained from the 2nd to 300th cycle. Graphite’s half-cell 1st cycle capacity decreases from 312 mAh/g to 208 mAh/g at the 300th cycle. Similarly, Sn-Cu@graphite composite anode half-cell 1st cycle capacity decreased from 1074 mAh/g to ~ 400 mAh/g at the 300th cycle. Interestingly, the capacity of the Sn-Cu@graphite is still higher than the theoretical and experimental capacities of pristine graphite even after 300 cycles. The large 1st cycle irreversible capacity loss of the Sn-Cu@graphite composite anode is attributed to the decomposition of the electrolyte by SnO2 present in our Sn-Cu alloy encapsulated graphite especially at low potentials [26].
Additionally, Kim et al. [26], used Synchrotron X-ray diffraction and absorption spectroscopy studies to show that Eq. (7) is reversible. The reversible disintegration of Li2O throughout delithiation process
allows some of the oxygen to react with Sn forming SnOx and LixO thus leading to capacities much
higher than Sn and tin oxide [26]. The results Kim et. al [26]. studies provided additional evidence to support the high capacity performance of anodes with SnO2 including our Sn-Cu@graphite anode.
Fig. 7d presents the coulombic efficiency over 300 cycles for both graphite and Sn-Cu@graphite electrodes which suggests that both anodes display reversible capacity retention with coulombic efficiency ranging from 95 % to 101%. The higher coulombic efficiencies exceeding 100% are primarily due to the irreversible capacity in the earliest lithiation cycles.
Furthermore, for Fig. 7c, unlike graphite’s electrode relatively steady discharge curve, Sn-Cu@graphite electrode exhibited a steep negative slope over the first 200 cycles indicative of capacity loss per cycle. However, from 200 to 300 cycles, the gradient of the Sn-Cu@graphite slope was much less than the previous 200 cycles and the discharge curve started to plateau or level off, thus indicating a reduction in the loss of capacity per cycle. Regardless of the decreasing discharge capacity over 300 cycles, a comparison of the total cumulative capacity after 300 cycles shows that the graphite electrode and Sn-Cu@graphite electrode yielded 71,451 mAh/g and 163,858 mAh/g, respectively. This comparison indicates that the newly fabricated Sn-Cu@graphite electrode produces ~2.3 times more capacity per gram than a pure graphite electrode of the same weight over a lifetime of 300 cycles, for example. We evaluated the percent capacity retention between the 1st and 300th cycle of our Sn-Cu@graphite electrode and observed that 40% of the 1st cycle’s capacity is retained at 300th cycle. For comparison, Lou et al. (carbon coated SnO2) [9] and Liu et al. (carbon coated CuSn) [10] electrodes
[image:15.596.69.528.257.475.2]
The pertinent question to ask is “what is responsible for the observed performance of the Sn-Cu@graphite electrode?” Several factors are suggested to support the outstanding long-term cycling and capacity performance of the Sn-Cu@graphite electrode. A combination of factors is suggested to be responsible for the observed performance including: (i) Both the high surface area (22.5 m2/g) and small particle size of the nanoparticles on the Sn-Cu@graphite, provide high electrolyte to electrode interfacial area of contact that enhances the reactivity of the Sn/graphite active materials during lithiation and delithiation process, (ii) the Cu-Sn encapsulation provides shorter diffusion paths which increases the diffusion of Li ions into Sn-Cu@graphite electrodes, (iii) Cu as an inactive matrix, helps to buffer volume changes of Sn during lithiation and delithiation and thus enhancing the long-term cycling of the Cu6Sn5 alloy layer.
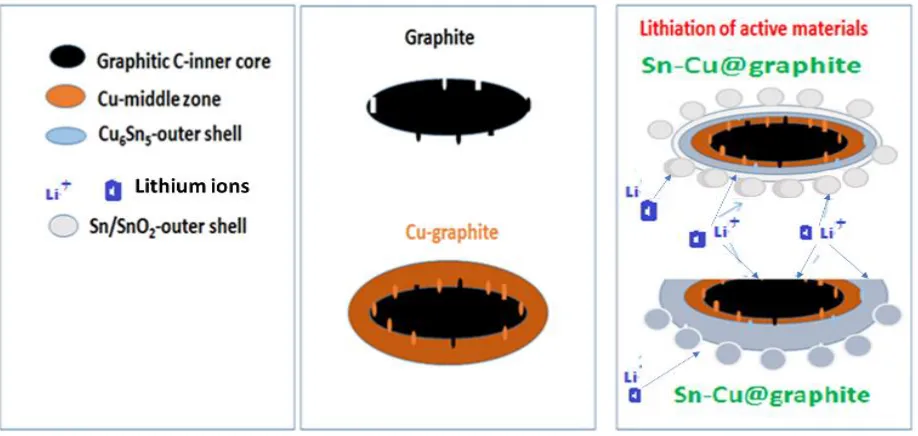
Figure 8. Cartoon illustrating the lithiation of Sn-Cu@graphite anode materials.
The observed higher capacity of the Sn-Cu@graphite over that of graphite and its long-term cycling could be due to the contributions of Cu6Sn5 intermetallics which may remain even if the outer
core of Sn or SnO2 pulverizes, (iv) The inner core graphite being active for lithiation and delithiation
favors continuing activity of any lithium ion than tunnels past the inactive copper layer of the encapsulating material, (v) Our SEM images prior to cycling show that there are some cracked areas on the graphite substrate which means that lithiation/delithiation can occur in both the outer Sn-Cu (and its intermetallic alloys) and graphite. A cartoon depicting the co-lithiation of the graphite and Sn-Cu alloy is shown in Fig. 8. Such an observation is key to the success of the synthesized material since a failure of either Cu6Sn5 alloy or Sn encapsulating materials leaves the active graphite core for
Figure 9. Rate capability analysis from 227 mA/g to 955 mA/g current loads between 1.5 V and 0.007 V.
We also deduced from the cycling and coulombic efficiency curves, that regardless of the loss of capacity for the Sn-Cu@graphite electrode, the coulombic efficiency was steady and close to 100%. This strongly implies that the lithiation and delithiation at high cycle numbers are reversible and the same amounts of active materials are accessible for each charge and discharge cycle. For example, if the active material for the 300th cycle of charge was not accessible by Li ions on discharge, the coulombic efficiency would be lower than 100%, which was not the case.
[image:16.596.128.482.84.349.2]
therefore suggest that our Sn-Cu@graphite composite anodes have the potential of long-term cycling and capacity retention from the cycling and rate studies performed.
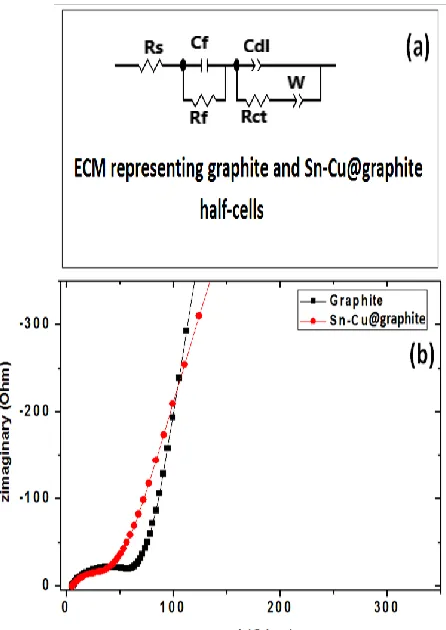
Subsequent to long term cycling (300 cycles), electrochemical impedance spectroscopy (EIS) analysis on half-cells made from both anodes was conducted and their Nyquist curves are presented in Fig. 10. Observation of the Nyquist plots indicates that in the high frequency region, all Nyquist plots intercepted the real axis. Additionally, depressed semicircles are present in the medium frequency region that is followed by a tail ending in the low frequency region of the Nyquist curve. Commonly, crossing of the x-axis in the high frequency region is accredited to resistance from the electrolyte and the surface of the electrode (Rs) [27-29]. The resistance due to charge transfer (Rct) at the cathode and
electrolyte is represented by semicircle in the medium frequency region [27-29]. Lastly, the tail extending to the low frequency area commonly called Warburg impedance (W) is associated with the diffusion of lithium ions within the electrode [27-29]. Fig. 10a shows the equivalent circuit model (ECM) used to represent the Nyquist plots of the experimental data. The parameters, Rs, Rct, and W
were calculated using the ECM. Rs for graphite composite anode and Sn-Cu@graphite composite are 7
Ohm, and 6 Ohm, respectively. All cells’ Rs vary from 5-7 Ohm are identical to the information
elsewhere [27-29].
[image:17.596.186.409.406.721.2]
Furthermore, it was found that the semicircle and the Rct values decreased significantly for
Sn-Cu@graphite composite anode. Rct values corresponding to graphite composite anode and
Sn-Cu@graphite composite were approximately 60 Ohm, and 32 Ohm, respectively. The low resistance of Sn-Cu@graphite composite anode relative to graphite only anode is evidence of efficient charge transfer in the Sn-Cu@graphite anode which is in line with our earlier observation of higher capacity at high current density under similar applied voltage conditions for Sn-Cu@graphite anode vs graphite only anode.
Figure 11. SEM showing (a) graphite before cycling, (b) graphite after 300 cycles, (c)Sn-Cu@graphite
before cycling, and (d) Sn-Cu@graphite after 300 cycles. This increase in electrochemical performance after electroless encapsulation can be attributed
to the electroless encapsulation of Sn-Cu on graph.
3.4 Post cycle analysis
[image:18.596.115.489.206.509.2]
the electrodes even after a careful washing and removal through drying of the EC:DMC solvent that was used to remove the electrolyte for the fabricated half-cell. Fig.11 shows that after 300 cycles, both the graphite and Sn-Cu@graphite electrode materials had quite different morphological features from their initial morphologies. While the graphite anode turned to white spongy looking spherical particles (nanospheres) after cycling (Fig. 11b), the Sn-Cu@graphite anode surface changed to spindle-like structures and there were small gaps around some particles (Fig. 11d). Overall, both electrodes did not suffer obvious mechanical damage (large cracks or delamination). Hence, mechanical degradation does not affect previous electrochemical performance of the electrodes. Unlike Fig. 11a that shows clearly defined graphite particles before cycling, the white spongy nanospheres in Fig. 11b appear to blanket the graphite electrode surface thus covering some of the graphite particles.
The presence of this spongy blanket may have covered the active surface of the graphite electrode thereby limiting the capacity retention as observed by the capacity loss after 300 cycles. Although we do not know the composition of the spongy nanosphere blanket on the surface of graphite particles, we believe it could be due to the formation of solid electrolyte interface (SEI) from electrolyte reduction or dendrite from lithium plating. In addition, some of the individual graphite particles seem to be exfoliating, or the closely stacked layers of graphene forming graphite is now starting to be expanded. This could be due to the alloying/dealloying stress experiences during each cycle. On one hand, expanded graphite my result in poor performance since this may lead to longer lithium ion diffusion path and loss of electrical contact in the electrode composite thus leading to capacity fading. On the other hand, exfoliating graphite sheets may reveal previously inaccessible active graphite capable of lithiation/delithiation even though other surfaces are being blanketed with dendritic or SEI layer.
For the Sn-Cu@graphite electrode, Fig. 11c shows surface morphology of graphite encapsulated by SnO, SnO2, and Cu6Sn5 before cycling. Fig. 11d shows that the morphology of
Sn-Cu@graphite at 300 cycles significantly changed with the needle-like spindles growing on the surface of the Sn-Cu@graphite electrode. These observations are like the blanket growing on the particles of graphite electrode (Fig. 11b). However, instead of the spongy spherical nanosperes that are present on the graphite’s electrode, Sn-Cu@graphite electrode has thick layer of needle-like spindles. These spindles tend to grow together and propagate thus covering some of the Sn-Cu@graphite surface while leaving other areas uncovered. We believe these spindles covering the active material’s surface can limit the electrochemical performance thus resulting in capacity loss as previously outlined for the Sn-Cu@graphite half-cell. We are unsure of the sources leading to the formation of spindle material. However, we speculate SEI formation (especially at low potentials) and/or the pulverization of the outer shell (tin or tin oxide) of the electroless Sn-Cu@graphite electrode. This pulverization is commonly observed during lithiation delithiation of Sn. Using XPS characterization, the chemical nature of the surface of the Sn-Cu@graphite after 300 cycles was obtained and shown in Fig. 4d - f. Fig. 4d shows the general XPS survey spectrum of Sn-Cu@graphite anode material after 300 cycles, revealing the existence of fluorine, copper, oxygen, tin, lithium, and carbon. The peak related to Cu (0) is located at 933 eV. The F 1s peak related to fluorine is given at ~700 eV and could be attributed to the PVDF binder used or surface coating of fluorine from the LiPF6 salt used in the 1M EC:DMC
shown in Fig. 4e, the Sn 3d peaks related to Sn 3d3/2 and Sn 3d5/2 are still centered at 494 eV and 488
eV, respectively. However, the intensity or counts per second significantly decrease, indicating that the surface of the Sn-Cu@graphite electrode has lost its Sn or the blanket of spindles is now covering the Sn. The C 1s peak located at 284 eV previously attributed to C-C from the graphite, has increased intensity or counts per second. We believe this increase could also be due to the presence of the blanketing needle-like surface coating. As commonly known, reduction of EC solvent results in the formation of ROCO2Li and Li2CO3 [30]. Hence, the increase carbon peak could also be attributed to C
from SEI layer. Peaks related to oxygen O 1s and O 2s are located at 550 eV and 30 eV, respectively, reduced drastically, which corroborates to the reduction of Sn spectrum since the presence of SnO and SnO2 are believed to be the sources of oxygen in the Sn-Cu@graphite composite. Li 1S peak located
very close to ~55 eV is believed to be from the lithium containing compounds, lithium salt, or alloyed lithium from LixSn. We also deduced that the small gaps around each particle may result in loss of
particle to particle contact thus interrupting the transport of electrons and this has potential impact of capacity loss. Overall, the post cycling analysis provides clarity on the condition of the graphite and Sn-Cu@graphite electrode during long-term cycling which may help to identify factors contributing to the capacity degradation.
4. CONCLUSIONS
In this investigation, Sn-Cu@graphite anode (comprising of Cu6Sn5, Sn, SnO, SnO2) was
synthesized using electroless encapsulation of Sn on copper coated 3D graphite particles. Sn-Cu@graphite anode material and graphite anode exhibited 1st cycle discharge capacity of 1074 mAh/g and 327 mAh/g, respectively at ~0.2C. Impedance results indicated that half-cells made from Sn-Cu@graphite composites have lower charge transfer resistance than graphite composite half-cells. The electroless encapsulation method suggests a low cost practical approach to other familiar synthesis methods (e.g. sputtering, electrodeposition – more energy intensive processes) used for obtaining reversible Sn-Cu alloy composite anodes. Our approach in making the graphite particles active for electroless deposition differs from the traditional approach used for making substrates active for electroless plating. The results demonstrate that electroless encapsulation of graphite, with both Cu and Sn is a feasible two-step approach for producing potentially high capacity and cyclable Sn-Cu anode for Li-ion battery and that such Sn-Cu anode can exhibit ~400 mAh/g even after 300 cycles, much higher than graphite’s theoretical and experimental capacities. This approach is a potentially scalable method of producing Sn-Cu anodes for LIBs at affordable cost since electroless plating does not require complicated set-up and high intensive external energy supply for the encapsulation of the graphite particles to occur.
ACKNOWLEDGEMENTS
Laboratory, Tallahassee, Florida, which is supported by the National Science Foundation Cooperative Agreement No. DMR-1644779 and the State of Florida.
References
1. M. Armand and J. M. Tarascon, Nature, 451 (2008) 652. 2. J. M. Tarascon and M. Armand, Nature, 414 (2001) 359.
3. B. Wang, B. Luo, X. Li and L. Zhi, Materialstoday, 13 (2012) 544.
4. T. Tatsuma, M. Taguchi and N. Oyama, Electrochim. Acta, 46 (2001) 1201.
5. J. C. Arrebola, A. Cabellero, J. L. Gomez-Camez, L. Herman, J. Morales and L. Sanchez, Electrochem. Commun., 11 (2009) 1061.
6. M. J. Lindsay, G. X. Wang and H. K. Li, J. Power Sources, 119 (2003) 84. 7. C. K. Chan, X. F. Zhang, and Y. Cui, Nano Lett., 8 (2008) 307.
8. M. Winter and J. O. Besenhard, Electrochimica Acta, 45 (1999) 31.
9. X.W. Lou, J.S. Chen, P. Chen and L. A. Archer, Chem. Mater., 21 (2009) 2868. 10. S. Liu, Q. Li and Y. Chen, J. Alloys and Compounds, 478 (2009) 694.
11. Q. Deng, Z. Huang, X. Dai and Y. Wang, J. Solid Electrochemistry, 19 (2015) 1765.
12. H. Park, J. H. Um, H. Choi, W-S. Yoon, Y.-E. Sung and H. Cho, Applied Surface Science, 399 (2017) 132.
13. H. C. Shin and M. Liu, Advance funct. Mater., 15 (2005) 582.
14. G. Cui, N. Li and J. Zhao, J. Electrochem. Soc., 153(12) (2006) C848.
15. E. Huttunen-Saarivirta and T. Tiainen, J. Mater. Process. Technol., 170 (2005) 211.
16. H. T. Ng, S. F. Y. Li, L. Chan, F. C. Loh and K. L. Tan, J. Electrochem. Soc., 145(9) (1998) 3307. 17. Y. Shacham-Diamand, V. Dubin and M. Angyal, Thin Solid Films, 262 (1995) 93.
18. M. E. Touhami, M. Cherkaoui, A. Srhiri, A. B. Bachir and E. Chassaing, J. Appl. Electrochem., 26 (1996) 487.
19. M. E. Touhami, E. Chassaing, and M. Cherkaoui, Electrochim. Acta, 43 (1998) 1721. 20. G. Lu and G. Zangari, J. Electrochem. Soc., 150 (2003) C782.
21. S. Han, B. Jang, T. Kim, S. M. Oh and T. Hyeon, Adv. Funct. Mater., 15 (2005) 1845. 22. S. Arai and R. Fukuoka, J. Appl. Electrochmistry, 46 (2016) 331.
23. K. Kepler, J. T. Vaughey and M. M. Thackeray, J. Electrochemical and Solid-State Letters, 2(7) (1999) 307.
24. L. Xue, Z. Fu, Y. Yao, T. Huang and A. Yu, Electrochim. Acta, 55 (2011) 7310. 25. A. R. Kamali, and D. J. Fray, Rev. Adv. Mater. Sci., 27 (2011) 14.
26. H. Kim, G. O. Park, Y. Kim, S. Muhammad, J. Yoo, M. Balasubramanian, Y.-H. Cho, M-G. Kim, B. Lee, K. Kang, H. Kim, J. M. Kim and W.-S. Yoon, Chem. Mater., 26 (2014) 6361.
27. P. L. Moss, G. Au, E. J. Plitcha and J. P. Zheng, J. Electrochem. Soc., 155 (2008) A986.
28. J. Gomez, R. Nelson, E. E. Kalu, M. H. Weatherspoon and J. P. Zheng, J. Power Sources, , 196 (2011) 4826.
29. D. Y. W. Yu, C. Fietzek, W. Weydanz, K. Donoue, T. Inoue, H. Kurokawa and S. Fujitania, J. Electrochemical Society, 154 (2007) A253.
30. S.-W Song, and S.-W Baek, Electrochim. Acta, 54(4) (2009) 1312.