MODULE FOR ROAD TRAFFIC SIGNALS
NUR DIYANA BINTI MOHD HAMIDI
ANALYSIS AND DEVELOPMENT OF A SELF-DIMMING
MODULE FOR ROAD TRAFFIC SIGNALS
NUR DIYANA BINTI MOHD HAMIDI
This report is submitted in partial fulfilment of the requirements
for the degree of Bachelor of Electronic Engineering with Honours
Faculty of Electronic and Computer Engineering
Universiti Teknikal Malaysia Melaka
Tajuk Projek : Analysis and Development of A Self-Dimming Module for Road Traffic Signals
Sesi Pengajian : 2017/2018
Saya NUR DIYANA BINTI MOHD HAMIDI mengaku membenarkan laporan Projek Sarjana Muda ini disimpan di Perpustakaan dengan syarat-syarat kegunaan seperti berikut:
1. Laporan adalah hakmilik Universiti Teknikal Malaysia Melaka.
2. Perpustakaan dibenarkan membuat salinan untuk tujuan pengajian sahaja. 3. Perpustakaan dibenarkan membuat salinan laporan ini sebagai bahan
pertukaran antara institusi pengajian tinggi. 4. Sila tandakan ():
SULIT*
(Mengandungi maklumat yang berdarjah keselamatan atau kepentingan Malaysia seperti yang termaktub di dalam AKTA RAHSIA RASMI 1972)
TERHAD* (Mengandungi maklumat terhad yang telah ditentukan oleh organisasi/badan di
mana penyelidikan dijalankan.
TIDAK TERHAD
Disahkan oleh:
(TANDATANGAN PENULIS) (COP DAN TANDATANGAN PENYELIA)
Alamat Tetap: 2729, JALAN MELOR,85020 BUKIT SIPUT, SEGAMAT,JOH OR
Tarikh : 01 Jun 2018 Tarikh : 01 Jun 2018
*CATATAN: Jika laporan ini SULIT atau TERHAD, sila lampirkan surat daripada pihak berkuasa/organisasi berkenaan dengan menyatakan sekali tempoh laporan ini perlu dikelaskan sebagai SULIT atau TERHAD.
UNIVERSITI TEKNIKAL MALAYSIA MELAKA
FAKULTI KEJUTERAAN ELEKTRONIK DAN KEJURUTERAAN KOMPUTER
BORANG PENGESAHAN STATUS LAPORAN
DECLARATION
I declare that this report entitled “Analysis and Development of A Self-Dimming
Module for Road Traffic Signals” is the result of my work except for quotes as cited
in the references.
Signature : ………
Author : ………
APPROVAL
I hereby declare that I have read this thesis and in my opinion, this thesis is sufficient
in terms of scope and quality for the award of Bachelor of Electronic Engineering
with Honours.
Signature : ………
Supervisor Name : ………
DEDICATION
ABSTRACT
Nowadays, we often see more and more of the various types of lights in urban
areas, especially in road areas, either regarding the use of traffic lights or streetlights
that serve as guides and signals to maintain road safety. Typically, the lamps use
LED-based lamps as they can increase the rate of high savings. This LED conceptual
light helps reduce energy wastage by using less power and reducing the consumption
of heat and is suitable for day-to-day operation. The addition of ordinary LEDs to
self-dimming systems based on the intensity of light around is more likely to
increase the savings rate and is more environment-friendly. The scope of this project
includes analytics data from the use of standard traffic lights and LED signal lights
that are self-concept in dimmer systems. This project uses the IoT concept that is
applied to the traffic system and uses solar energy which is indeed renewable natural
energy and can affect the green earth concept to the traffic control system on the
ii
ABSTRAK
Pada masa kini, sering kita lihat semakin banyak kewujudan pelbagai jenis lampu
di kawasan-kawasan perbandaran terutamanya di kawasan jalan raya samada dari
segi penggunaan lampu isyarat ataupun lampu jalan yang berfungsi sebagai panduan
dan isyarat bagi mengekalkan keselamatan pengguna jalan raya. Kebiasaannya,
lampu-lampu tersebut menggunakan lampu berlandaskan LED kerana mampu
meningkatkan kadar penjimatan yang tinggi. Lampu yang berkonsepkan LED ini
membantu mengurangkan pembaziran tenaga dengan cara menggunakan kuasa yang
sedikit dan menggurangkan kadar penggunaan haba dan sesuai untuk beroperasi
sepanjang hari. Penambahan LED biasa kepada sistem malap sendiri berdasarkan
keamatan cahaya di sekeliling lebih membantu meningkatkan kadar penjimatan dan
lebih mesra alam. Skop projek ini merangkumi data analisis daripada penggunaan
lampu isyarat biasa dan lampu isyarat LED yang berkonsepkan sistem malap sendiri.
Projek ini menggunakan konsep IoT yang diapplikasikan ke dalam sistem trafik dan
menggunakan tenaga solar yang sememangnya merupakan tenaga semula jadi yang
boleh diperbaharui dan dapat menerapkan konsep bumi hijau ke dalam sistem
ACKNOWLEDGEMENTS
A very grateful to Allah s.w.t because of His willing I managed to complete my final year project entitled analysis and development of a self-dimming module for road traffic signals.
First of all, I would like to express my deepest thanked my supervisor, Dr Siva Kumar A/L Subramaniam for giving guidance and an ethical commitment from the beginning until I have completed this project. I appreciate him for sharing his knowledge to facilitate me to understand better the concepts used in this project. I would like to thank the staffs especially the laboratory staff for their cooperation for giving me a place and able me to complete my project as they give me some ideas and more valuable information.
Not to forget to appreciate my teammates who help fix my mistakes, give ideas to my projects and help me looking for solutions when I'm having trouble doing projects especially in hardware parts. Thank you for your extending help without any complaints.
iv
TABLE OF CONTENTS
Declaration i
Approval i
Dedication i
Abstract i
Abstrak ii
Acknowledgements iii
Table of Contents iv
List of Figures viii
List of Tables xi
List of Symbols and Abbreviations xii
List of Appendices xiv
CHAPTER 1 INTRODUCTION 1
1.1 Background 1
1.3 Problem Statement 9
1.4 Objectives 11
1.5 Scope of Work 11
1.6 Organization of Report 12
CHAPTER 2 LITERATURE REVIEW 14
2.1 The Concept of Dimming System 14
2.1.1 The technique used for a dimming system 15
2.2 The microcontroller used for traffic light system 19
2.3 The types of traffic light array display 22
2.3.1 The high flux traffic light display 22
2.3.2 The dot matrix traffic light 24
CHAPTER 3 methodology 26
3.1 Overall research work flowchart 26
3.2 Phase 1: Measuring current, the voltage for red, green and yellow LED 28
3.2.1 Connecting the red, yellow and green LED on the testing board 29
3.3 Phase 2: Conducting the circuit with a microcontroller 30
3.3.1 Equipment and Components 31
3.3.2 The Step for Measuring the Luminance Detected by LDR Sensor 34
3.3.3 The Fabrication Process for Arduino Circuit 35
vi
3.4 Phase 3: The Developing for IoT Platform 39
3.5 Measuring the Light Intensity for 5V and 12V 40
3.6 Testing the Project 40
CHAPTER 4 result & discussion 42
4.1 The Luminance captured by LDR Sensor 42
4.2 The Current Reading for LED Traffic Light on Testing Board 44
4.3 The Current Reading for LED Traffic Light on Display Board 47
4.3.1 The current measurement for each colour of LED on Display Board 47
4.3.2 The Simulation for Each Colour of LED Traffic Light 49
4.3.3 The Theoretical Value for Current and Power Measurement 53
4.4 The Cost Saving made by Proposed System 55
4.4.1 The Power Consume by Traffic Light 57
4.4.2 The Cost Needed for Proposed Traffic Light 58
4.5 The Luminance for Light Intensity for LED 59
4.6 The Developing for IoT platform 60
4.7 Discussion 62
CHAPTER 5 conclusion & future work 65
5.1 Conclusion 65
5.2 Future Work 67
APPENDICES 71
viii
LIST OF FIGURES
Figure 1.1: Non-electric gas traffic light by J.P Knight ... 2
Figure 1.2: The kerosene lamp traffic light 1908 ... 3
Figure 1.3: The first electric traffic light in 1924 ... 4
Figure 1.4: The high demand bulb used for traffic light system ... 5
Figure 1.5: The high flux LED traffic light array ... 7
Figure 1.6: The dot matrix LED traffic light array ... 8
Figure 2.1: The auto-dimming for LED traffic signal ... 16
Figure 2.2: The brightness of LED with duty cycle = 40% ... 17
Figure 2.3: The brightness of LED with duty cycle = 80% ... 17
Figure 2.4: The light is turn on when a vehicle is passing by the lamp ... 19
Figure 2.5: The Arduino UNO microcontroller and MOSFET device ... 20
Figure 2.6: The circuit architecture controlled by PIC controller ... 21
Figure 2.7: The position of LED for high flux traffic light display ... 23
Figure 2.8: The position of LED for dot matrix traffic light display ... 25
Figure 3.1: The flowchart for the overall project ... 27
Figure 3.3: The LED is tested on testing board and powered up with power supply 29
Figure 3.4: Soldering process for the LED on the display board ... 29
Figure 3.5: The flowchart for conducting the Arduino circuit ... 30
Figure 3.6: The Arduino UNO R3 Microcontroller ... 31
Figure 3.7: The LDR sensor ... 32
Figure 3.8: The rain sensor ... 33
Figure 3.9: The current sensor ... 33
Figure 3.10: The Wi-Fi module ... 34
Figure 3.11: Measuring the luminance captured by LDR sensor at daytime and night ... 35
Figure 3.12: The circuit layout and printed layout circuit film ... 36
Figure 3.13: The process of fabrication the circuit ... 37
Figure 3.14: The soldering process for all components on the PCB layout ... 37
Figure 3.15: The complete board for Arduino connection circuit ... 38
Figure 3.16: The flowchart for developing the IoT platform ... 39
Figure 3.17: The proposed traffic light system ... 41
Figure 4.1: The graph shows the graph for lux reading against time ... 44
Figure 4.2: The graph for current measurement between 12V and 5V on testing board ... 45
Figure 4.3: The graph for power consumption between 12V and 5V on testing board ... 46
Figure 4.4: The current reading for red, yellow and green LED with supply 5V ... 47
Figure 4.5: The current reading for red, yellow and green with supply 12V... 47
x
Figure 4.7: The graph for power consumption between 12V and 5V on display board
... 49
Figure 4.8: The simulation for the red LED supplied by 5V ... 50
Figure 4.9: The simulation for the yellow LED supplied by 5V ... 50
Figure 4.10: The simulation for the green LED supplied by 5V ... 50
Figure 4.11: The simulation for the red LED supplied by 12V ... 50
Figure 4.12: The simulation for the yellow LED supplied by 12V ... 51
Figure 4.13: The simulation for the green LED supplied by 12V ... 51
Figure 4.14: The graph for simulation for current supplied by 12V and 5V ... 52
Figure 4.15: The graph for simulation for power consumption by 12V and 5V ... 53
Figure 4.16: The graph for theoretical for current supplied by 12V and 5V ... 54
Figure 4.17: The graph for theoretical value for power consumption by 12V and 5V ... 55
Figure 4.18: The graph for the time period for each LED per day ... 56
Figure 4.19: The graph for the time period for each LED for 12V and 5V per day .. 56
Figure 4.20: The graph for power usage by traffic light ... 57
Figure 4.21: The figure shows the pie chart which represents the cost needed by traffic light ... 58
Figure 4.22: The graph for lux reading against distance between 12V and 5V ... 59
Figure 4.23: The data send to Thingspeak for current reading ... 60
Figure 4.24: The Traffic Go application for the traffic light system ... 61
Figure 4.25: The current percentage for each LED by Traffic Go application ... 61
Figure 4.26: The email for traffic alert sent to the maintenance for service ... 62
LIST OF TABLES
Table 4.1: The table for lux reading against time ... 43
Table 4.2: The table for current and power for each colour of LED on testing board ... 44
Table 4.3: The table for current measurement for each colour of LED on display board ... 48
Table 4.4: The table for simulation for current measurement for each colour of LED ... 52
Table 4.5: : The table for theoretical value for current measurement for each colour of LED ... 54
Table 4.6:The table shows the total power consumed by a traffic light ... 57
Table 4.7:The cost needed by a proposed traffic light ... 58
xii
LIST OF SYMBOLS AND ABBREVIATIONS
A : Ampere
AC : Alternating current
ALS : Ambient light sensor
DC : Direct current
IC : Integrated circuit
IoT : Internet of things
I/O : Input /output
kWh : Kilo-watt hour
MOSFET : Metal oxide semiconductor field effect transistor
LDR : Light-dependent resistor
LED : Light emitting diode
PCB : Printed circuit board
PIC : Peripheral interface controller
PLC : Programmable logic controller
PWM : Pulse width modulation
R : Resistance
V : Voltage
W : Watt
Wi-Fi : Wireless fidelity
xiv
LIST OF APPENDICES
CHAPTER 1
INTRODUCTION
This work is about the analysing and developing the self-dimming module for road
traffic signals for road users. This chapter covers work background, problem
statement of work, objectives of work, the scope of work and organisation of the
report.
1.1 Background
The traffic light is one of the traffic infrastructure facilities designed to
control traffic at every intersection of roads so that vehicle movement can move
smoothly. This traffic light function is to prevent the collisions between road users
by sending signals to road users using three different colours. These three colours
2
indicate ready to stop, and red mean stop. Through the three colours control of this
traffic light, any incidents can be avoided, and road traffic operates smoothly and
systematically. Besides, the traffic light also allows pedestrians to cross the road
safer by pressing the push button and cross the over when green light for pedestrians
[image:22.595.230.406.225.600.2]was turned on.
Figure 1.1: Non-electric gas traffic light by J.P Knight
Before traffic light have been introduced, traffic was only controlled by
traffic police around 1722 at London Bridge [1] [2] by controlling the movement of
on December 9, 1868, by John Peake Knight, a railway engineer. This traffic light
does not use electric but uses gas and is installed around the outside of the Houses of
Parliament in London. The idea comes from the signalling system for the railway
that has been constructed by Saxby and Farmer who are railway signal engineers [2].
In that time, the traffic light operates by having a pole with 22-feet high and two
semaphore arms that have been positioning 45 degrees for “caution” signal and will
rise horizontally for “stop” [2]. During the night, there will be a policeman handling
the traffic by placing the red lamp on the top of the pole to “stop’ and change to the
green lamp to signal “go”. But, this traffic light did not last long when the incident
[image:23.595.237.415.362.605.2]caused a policeman who was injured due to a gas lamp explosion [2].
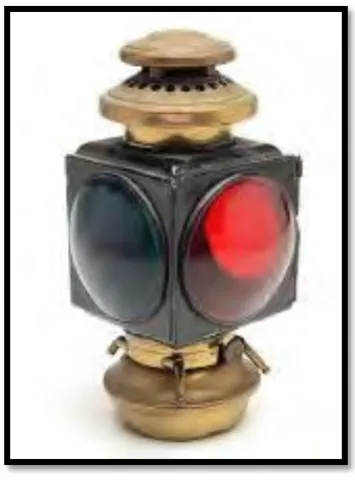
Figure 1.2: The kerosene lamp traffic light 1908
The first creation of traffic light by J.P.Knight inspires others to improve the
traffic light system in a better direction. Thus, in 1908, traffic light began to be used
4
background and have red and green light lenses [7]. The traffic light system is
widespread throughout the country and operates according to its design. At this
point, traffic light only uses green and red to signal to road users. The traffic light
with three colours bulbs was developed in 1920 [8] used in Detroit, Michigan. The
first electric traffic light was introduced in 1924. Then there is a traffic light system
for pedestrians to make it easier for them cross the road safely behind the road
congestion. A countdown system also has been developed as it displays digital
numbers to road users to show the amount of time during red and green lights as the
[image:24.595.177.478.338.622.2]users can quickly get ready whether they have to stop or move.
Figure 1.3: The first electric traffic light in 1924
There are various types of lamps used in everyday life to make it easier for us