R E S E A R C H
Open Access
Distinct T-helper cell responses to
Staphylococcus aureus
bacteremia reflect
immunologic comorbidities and correlate
with mortality
Jared A. Greenberg
1*, Cara L. Hrusch
2, Mohammad R. Jaffery
2, Michael Z. David
3, Robert S. Daum
4, Jesse B. Hall
2,
John P. Kress
2, Anne I. Sperling
2,5and Philip A. Verhoef
2Abstract
Background:The dysregulated host immune response that defines sepsis varies as a function of both the immune status of the host and the distinct nature of the pathogen. The degree to which immunocompromising comorbidities or immunosuppressive medications affect the immune response to infection is poorly understood because these patients are often excluded from studies about septic immunity. The objectives of this study were to determine the immune response to a single pathogen (Staphylococcus aureus) among a diverse case mix of patients and to determine whether comorbidities affect immune and clinical outcomes.
Methods:Blood samples were drawn from 95 adult inpatients at multiple time points after the first positiveS. aureus blood culture. Cox proportional hazards modeling was used to determine the associations between admission neutrophil counts, admission lymphocyte counts, cytokine levels, and 90-day mortality. A nested case-control flow cytometric analysis was conducted to determine T-helper type 1 (Th1), Th2, Th17, and regulatory T-cell (Treg) subsets among a subgroup of 28 patients. In a secondary analysis, we categorized patients as either having immunocompromising disorders (human immunodeficiency virus and hematologic malignancies), receiving immunosuppressive medications, or being not immunocompromised.
(Continued on next page)
* Correspondence:[email protected]
Data reported in this article have not been published previously, but they were presented at the following conferences:
1) American Thoracic Society International Conference, May 2015, Denver, CO, USA
2) International Symposium on Staphylococci and Staphylococcal Infections, August 2014, Chicago, IL, USA.
Jared A. Greenberg and Cara L. Hrusch are co-first authors Anne I. Sperling and Philip A. Verhoef are co-senior authors
1
Division of Pulmonary and Critical Care Medicine, Department of Medicine, Rush University Medical Center, 1725 West Harrison Street, Suite 054, Chicago, IL 60612, USA
Full list of author information is available at the end of the article
(Continued from previous page)
Results:Higher neutrophil-to-lymphocyte count ratios and higher Th17 cytokine responses relative to Th1 cytokine responses early after infection were independently associated with mortality and did not depend on the immune state of the patient (HR 1.93, 95% CI 1.17–3.17,p= 0.01; and HR 1.13, 95% CI 1.01–1.27,p= 0.03, respectively). On the basis of flow cytometric analysis of CD4 T-helper subsets, an increasing Th17/Treg response over the course of the infection was most strongly associated with increased mortality (HR 4.41, 95% CI 1.69–11.5,p< 0.01). This type of immune response was most common among patients who were not immunocompromised. In contrast, among immunocompromised patients who died, a decreasing Th1/Treg response was most common.
Conclusions:The association of both increased Th17 responses and increased neutrophil counts relative to lymphocyte counts with mortality suggests that an overwhelming inflammatory response is detrimental. However, the differential responses of patients according to immune state suggest that immune status is an important clinical indicator that should be accounted for in the management of septic patients, as well as in the development of novel immunomodulatory therapies.
Keywords:Sepsis,Staphylococcus aureus, Helper T cells
Background
Sepsis is a leading cause of death among critically ill patients [1]. The current paradigm of sepsis pathophysiology suggests that some patients will die early in the disease course as a result of a dysregulated proinflammatory phase (systemic inflammatory response syndrome [SIRS]). How-ever, many more patients will die later of subsequent insults during a predominating immunosuppressive recovery phase (compensatory anti-inflammatory response syndrome [CARS]) [2]. The SIRS response is characterized by high levels of interleukin-1β (IL-1β), tumor necrosis factor-α (TNF-α), and expression of human leukocyte antigen (HLA)-DR on monocytes. In contrast, anti-inflammatory IL-10 and reduced expression of HLA-DR on monocytes are characteristics of the CARS response.
Recently, investigators have observed that certain septic patients never mount a clinically evident SIRS response, suggesting that the presence of SIRS should not be consid-ered an essential component of the sepsis clinical syn-drome [3]. The reason that some patients with infections and associated organ failure do not exhibit a SIRS response may be that preexisting chronic conditions influ-ence the nature of the SIRS and CARS responses during the course of infection [4]. Studies of the septic immune response often exclude patients with disorders of the immune system or patients undergoing treatments that reduce immunity [5–8]. As a result, the septic immune response is not well characterized for at least 25% of patients with sepsis [9]. Moreover, any immune response identified as beneficial or harmful in these studies may not be generalizable, owing to the exclusion of patients with immunocompromising comorbidities.
One of the main pathogens responsible for sepsis is
Staphylococcus aureus.Prior studies of immune dysregu-lation in sepsis due to S. aureus infection were focused on the innate immune response, particularly TNF-αand IL-10 [10, 11]. These cytokines, along with IL-6, have
long been known to be prognostic in different popula-tions with sepsis. However, numerous attempts to block these cytokines have not led to improved outcomes [12]. Notably, monocytes isolated from septic patients that express higher levels of HLA-DR also produce more TNF-α after lipopolysaccharide stimulation [13]. In addition, polymorphisms in HLA-DR increase risk forS. aureus susceptibility, indicating that antigen presenta-tion by monocytes to T cells may be a critical driver of disease outcome [14]. However, little is known about the resulting T-cell responses in patients with S. aureus
bacteremia. One recent study indicated that T-helper type 1 (Th1) cells are expanded in immunocompetent patients and are protective in a murine model of infec-tion [15]. In murine models, T-cell polarization duringS. aureus infection is dependent on the route of adminis-tration, the dose of bacteria delivered, and postinfection day of analysis, making these studies difficult to translate to patients with naturally acquired bacteremia [16–21]. Interestingly, whereas Th17 cells have been implicated in protection in murine models of S. aureus infection, the role of Th17 cells in humans has not been estab-lished. Finally, the presence of S. aureus-specific anti-bodies does not correlate with resistance to infection [22]. Therefore, a protective memory T-cell response may be critical in patients with sepsis by maintaining a proper SIRS/CARS balance.
infection) or received medications that interfered with im-mune function for the management of solid malignancies, solid organ transplants, or rheumatologic conditions [23]. Thus, our secondary goal was to explore whether the im-mune responses associated with mortality after S. aureus
bacteremia occurred more or less frequently among these patient groups that are often excluded from studies of the septic immune response.
Methods
Sample collection
This study was conducted at the University of Chicago
Medical Center (Chicago, IL, USA), a 547-bed,
university-affiliated urban teaching hospital, between July 1, 2013, and October 24, 2014. The University of Chicago Institutional Review Board approved this study. All adult inpatients with at least one positive blood culture for S. aureus within the previous 4 days were approached for participation. Informed consent was ob-tained by the patients or their surrogates.
Blood samples were drawn into ethylenediaminetetra-acetic acid tubes at three distinct time points (2–4 days, 6–9 days, and 12–18 days after the first day of positive
S. aureus blood cultures). It was necessary to include day ranges within time points, because there was vari-ability in the time it took blood cultures to turn positive and we were unable to process samples every day of the week. The first two time points were chosen on the basis of previous sepsis biomarker studies [24, 25], and we added a third time point to strengthen our analysis. Within 2 hours of collection, plasma and peripheral blood mononuclear cells (PBMCs) were isolated via differential centrifugation over Histopaque-1077 (Sigma-Aldrich, St. Louis, MO, USA). The samples were cryopreserved until analysis. Other investigators have reported consistent measurements when performing flow cytometry on fresh vs. thawed cells [26, 27]. Clinical and laboratory data (including complete blood count with differential) were abstracted from the patients’medical records.
Cytokine analysis
A multiplex assay (EMD Millipore, Darmstadt, Germany) was used to determine plasma cytokine concentrations at the first two time points (days 2–4 and 6–9). Cytokine levels that were below the limit of detection were assigned the lowest extrapolated value for each cytokine. Cytokine concentrations were log-transformed and were treated as continuous variables.
Flow cytometry
Thawed PBMCs were washed twice in fluorescence-activated cell sorting buffer (PBS containing 0.1% sodium azide and 0.2% bovine serum albumin) and incu-bated with a viability dye for 15 minutes (Zombie Aqua,
BioLegend, San Diego, CA, USA). Cells were incubated for 10 minutes with pooled human immunoglobulin G to block nonspecific antibody binding (FcX solution; BioLegend), and surface staining was performed using fluorescently conjugated antibodies CD3-fluorescein isothio-cyanate, CD4-allophycocyanin (APC), CCR4-phycoerythrin (PE), CCR6-Brilliant Violet 605, CD45RO-Brilliant Violet 711, CD25-APC/cyanine 7 (Cy7), and CD127-PE/Cy7 (BioLegend). Flow cytometry data were acquired on an LSRFortessa (BD Biosciences, San Jose, CA, USA) and an-alyzed with FlowJo software (FlowJo, Ashland, OR, USA).
Statistical analysis
The primary outcome was death during the first 90 days after bacteremia, which was determined by reviewing the medical record or contacting the patient’s surrogate. Our planned enrollment was 90 patients, of which we expected at least 20 to die during follow-up. On the basis of this enrollment target, our study was powered to include at least two immune markers in a multivari-able model. In our secondary analysis, we explored whether the immune responses associated with mortality occurred more or less frequently among the patients with immunocompromising conditions or taking im-munosuppressive medications.
The t test, Mann-Whitney U test, χ2 test, or Fisher’s exact test was used in bivariate testing, as appropriate, to determine if differences between groups were significant. In our primary analysis, we determined the associations between immune marker levels and 90-day mortality using Cox proportional hazards modeling. In multivariable models, we removed variables that were not statistically significant using backward selection (p> 0.05). In our secondary analysis, where outcomes were trends in cellular immune markers over time, we used linear mixed models to account for correlated mea-surements from the same patient [28]. We determined that a linear model approximated these relationships be-cause an additional“time after infection squared”term did not reach statistical significance (p> 0.05). All tests were two-sided. All analyses were performed with STATA 13.1 software (StataCorp, College Station, TX, USA).
Results
Neutrophil-to-lymphocyte count ratio on day of infection was associated with increased mortality afterS. aureus bacteremia
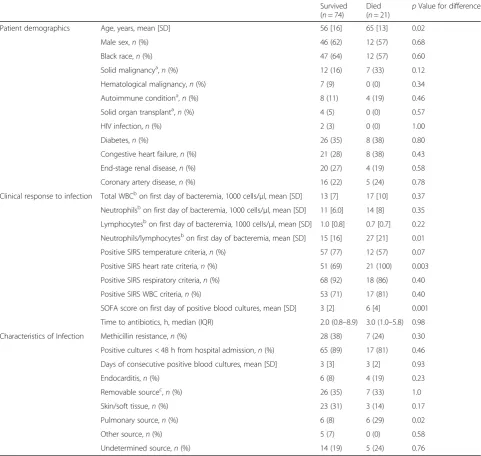
have higher Sequential Organ Failure Assessment (SOFA) scores, to meet SIRS heart rate criteria, and to have a pulmonary source of infection than patients who survived (Table 1). We did not find significant associa-tions between methicillin resistance or the duration of bacteremia and survival.
We also examined the neutrophil-to-lymphocyte count ratio among survivors and non-survivors, because a higher level has been cited as a negative prognostic factor in
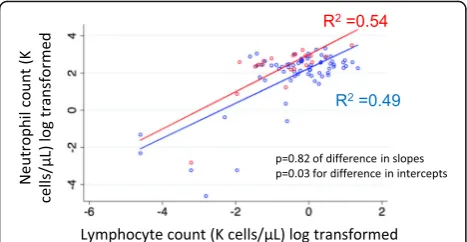
studies of sepsis and critical illness [29,30]. Whereas the absolute neutrophil and lymphocyte counts on the first day of bacteremia were similar among survivors and non-survivors, patients who died had significantly higher neutrophil-to-lymphocyte count ratios than patients who survived (27 vs. 15,p= 0.01 for difference). We created a scatterplot with each patient’s neutrophil count on the y-axis and each patient’s lymphocyte count on the
[image:4.595.57.539.225.681.2]x-axis (Fig. 1). Linear regression lines were created for
Table 1Baseline characteristics of 95 patients withStaphylococcus aureusbacteremia
Survived (n= 74)
Died
(n= 21) p
Value for difference
Patient demographics Age, years, mean [SD] 56 [16] 65 [13] 0.02
Male sex,n(%) 46 (62) 12 (57) 0.68
Black race,n(%) 47 (64) 12 (57) 0.60
Solid malignancya,n(%) 12 (16) 7 (33) 0.12
Hematological malignancy,n(%) 7 (9) 0 (0) 0.34
Autoimmune conditiona,
n(%) 8 (11) 4 (19) 0.46
Solid organ transplanta,
n(%) 4 (5) 0 (0) 0.57
HIV infection,n(%) 2 (3) 0 (0) 1.00
Diabetes,n(%) 26 (35) 8 (38) 0.80
Congestive heart failure,n(%) 21 (28) 8 (38) 0.43
End-stage renal disease,n(%) 20 (27) 4 (19) 0.58
Coronary artery disease,n(%) 16 (22) 5 (24) 0.78
Clinical response to infection Total WBCbon first day of bacteremia, 1000 cells/μl, mean [SD] 13 [7] 17 [10] 0.37
Neutrophilsbon first day of bacteremia, 1000 cells/μl, mean [SD] 11 [6.0] 14 [8] 0.35
Lymphocytesbon first day of bacteremia, 1000 cells/μl, mean [SD] 1.0 [0.8] 0.7 [0.7] 0.22 Neutrophils/lymphocytesbon first day of bacteremia, mean [SD] 15 [16] 27 [21] 0.01
Positive SIRS temperature criteria,n(%) 57 (77) 12 (57) 0.07
Positive SIRS heart rate criteria,n(%) 51 (69) 21 (100) 0.003
Positive SIRS respiratory criteria,n(%) 68 (92) 18 (86) 0.40
Positive SIRS WBC criteria,n(%) 53 (71) 17 (81) 0.40
SOFA score on first day of positive blood cultures, mean [SD] 3 [2] 6 [4] 0.001
Time to antibiotics, h, median (IQR) 2.0 (0.8–8.9) 3.0 (1.0–5.8) 0.98
Characteristics of Infection Methicillin resistance,n(%) 28 (38) 7 (24) 0.30
Positive cultures < 48 h from hospital admission,n(%) 65 (89) 17 (81) 0.46
Days of consecutive positive blood cultures, mean [SD] 3 [3] 3 [2] 0.93
Endocarditis,n(%) 6 (8) 4 (19) 0.23
Removable sourcec,
n(%) 26 (35) 7 (33) 1.0
Skin/soft tissue,n(%) 23 (31) 3 (14) 0.17
Pulmonary source,n(%) 6 (8) 6 (29) 0.02
Other source,n(%) 5 (7) 0 (0) 0.58
Undetermined source,n(%) 14 (19) 5 (24) 0.76
Abbreviations: SIRSSystemic inflammatory response syndrome,HIVHuman immunodeficiency virus,WBCWhite blood cells,SOFASequential Organ Failure Assessment
Patients were grouped as those who had died or survived at day 90 after bacteremia
a
Patients with these conditions were receiving chemotherapy or immune-modulating medications
b
Values were log-transformed prior to performing statistical tests
c
survivors and for non-survivors. The intercept of the re-gression line for non-survivors was significantly greater than the intercept for survivors (p= 0.03 for difference). The slopes were similar for survivors and non-survivors (p= 0.82 for difference). Thus, on average, patients who died had higher neutrophil counts rela-tive to lymphocyte counts than patients who survived, suggesting that early differences in the immune re-sponse may predict long-term outcomes.
High Th17 and low Th1 pathway cytokine profiles were associated with mortality independent of neutrophil and lymphocyte counts
IL-6 and IL-17A were the primary cytokines positively and significantly associated with mortality at time point 1 (2–4 days after infection) (HR 1.72, 95% CI 1.25–2.37,
p= 0.001) and (HR 2.36, 95% CI 1.35–4.15, p= 0.003), respectively (Additional file 2: Table S1). IL-6 was the only cytokine positively and significantly associated with mortality at time point 2 (6–9 days after infection) (HR 2.03, 95% CI 1.31–3.14,p= 0.002) (Additional file2: Table S2). Cytokines were grouped by immune pathway. For a particular pathway, we included not only cytokines produced by that type of T cell but also cytokines derived from innate cells that influ-enced T-cell differentiation into that pathway.
To evaluate the overall immune response for an individ-ual patient and to address the statistical problem of mul-tiple comparisons, we used a previously reported approach to combine cytokines common to specific pathways to generate Th17, Th1, and Th2 composite scores [31–33] (Additional file 2: Table S3). Each cytokine level was stan-dardized by dividing its measured value by the cohort’s median value. Each patient’s Th17, Th1, and Th2 scores were determined by summing all log-standardized cytokine concentrations from the same immune pathway.
Using unadjusted Cox proportional hazards modeling, each of the Th17, Th1, and Th2 scores at days 2–4 after
infection was not associated with death during the 90 days after infection (Table 2). However, using a mul-tiple variable Cox proportional hazards model of Th17 and Th1 scores, a higher Th17 score was harmful (HR 1.18, 95% CI 1.05–1.31,p= 0.003), whereas a higher Th1 score was protective (HR 0.81, 95% CI 0.68–0.96, p= 0.02). Similarly, using a model of Th17 and Th2 scores, a higher Th17 score was harmful (HR 1.21, 95% CI 1.04– 1.41, p= 0.01), whereas a higher Th2 score was pro-tective (HR 0.86, 95% CI 0.74–1.00,p= 0.049). A model of Th1 and Th2 scores did not reveal any significant as-sociations with mortality. There were similar asas-sociations when Th17, Th1, and Th2 scores measured at days 6–9 after infection were analyzed, but none reached statistical significance (Additional file2: Table S4). Changes in Th17, Th1, and Th2 scores from time point 1 to time point 2 were not associated with mortality (Additional file2: Table S5).
We created scatterplots to examine the associations be-tween Th17, Th1, and Th2 composite scores (Fig. 2). When each patient’s Th17 score was plotted against his or her Th1 score, we found that non-survivors had a signifi-cantly greater regression line slope than did survivors (p= 0.003 for difference) (Fig.2a). This relationship illustrates why a high Th17 score was associated with increased risk of death only when it was high relative to the Th1 score. Similarly, when comparing the relationship between Th17 and Th2 scores, we found that non-survivors also had a significantly greater regression line intercept than did sur-vivors (p= 0.04) (Fig. 2b). When comparing the relation-ship between Th1 and Th2 scores, we observed that the regression line slope and intercept were similar for survi-vors and non-survisurvi-vors (Fig.2c).
Finally, when we analyzed the neutrophil-to-lymphocyte count ratio, the Th17 score-to-Th1 score ratio, and the Th17 score-to-Th2 score ratio in a multivariable Cox pro-portional hazards model, we found that the neutrophil-to-lymphocyte count ratio and Th17 score-to-Th1 score ratio were independently associated with mortality (HR 1.93, 95% CI 1.17–3.17,p= 0.01; and HR 1.13, 95% CI 1.01–1.27,
p= 0.03, respectively) (Table3).
Neutrophil-to-lymphocyte count ratios and Th17 score-to-Th1 score ratios were similar, regardless of a patient’s immune state
Among the 95 patients in the cohort, there were 9 patients (9%) who had hematopoietic disorders (hematologic ma-lignancies or HIV infections). None of these patients died during the 90-day follow-up period. There were 35 add-itional patients (37%) who received medications that inter-fered with immune function, including systemic steroids; 11 (31%) of these patients died during the 90-day follow-up period (Table1). The clinical characteristics of patients grouped by the presence or absence of an immunocom-promised state (either due to medication or due to Fig. 1Association between neutrophil and lymphocyte counts on
[image:5.595.57.291.88.209.2]disorder of hematopoietically derived cells) are displayed in Additional file2: Table S6. Notably, patients with and without immunocompromising conditions were similar with respect to age and SOFA score, even though these patient characteristics were associated with mortality.
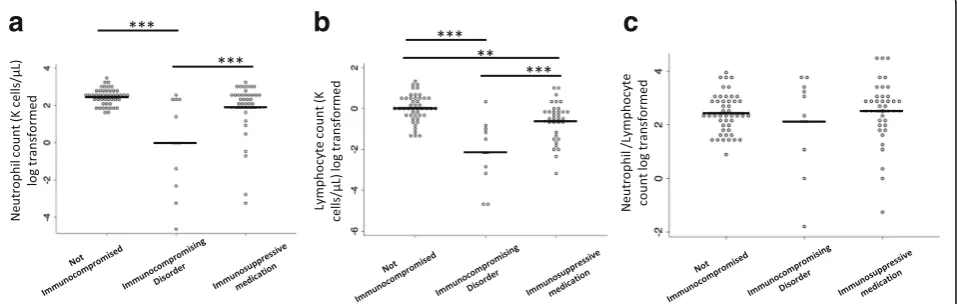
Patients with hematopoietic disorders had lower neutro-phil and lymphocyte counts than did patients who received immunosuppressive medications and patients who were not immunocompromised. However, the neutrophil-to-lymphocyte count ratio was similar across groups (Fig.3a,
b,c). The Th17, Th1, and Th2 composite scores were not significantly different between groups after pvalues were adjusted for multiple comparisons (Fig. 4a, b, c). Finally, the Th17/Th1, Th17/Th2, and Th1/Th2 score ratios were similar between groups (Fig. 4d, e, f). In sum-mary, the immune marker ratios associated with sur-vival (neutrophil-to-lymphocyte and Th17 score-to-Th1 score ratios) among patients typically labeled as immunocompromised were similar to those among patients without an immunocompromised state.
Patients who died were more likely than patients who survived to have increased Th17 responses measured by flow cytometry
To determine if changes in T-helper cell differentiation were associated with death after S. aureus bacteremia, we performed a nested case-control flow cytometry
study after we enrolled the first 67 patients in the co-hort. There were 14 patients who died during the 90 days after bacteremia. Of these 14 patients, there were 7 who received immunosuppressive medications and 7 who did not. We selected a comparison group of 14 survivors with similar chronic medical problems and SOFA scores. There were no patients with hematologic malignancies or HIV infections who died, so there were no patients with these conditions evaluated in this aspect of the study. The clinical characteristics of the patients who were included and not included are displayed in Additional file2: Table S7.
[image:6.595.58.539.111.197.2]We used a previously validated flow cytometric ap-proach to characterize T-cell subsets as Th1, Th2, Th17, or regulatory T cells (Tregs) [34, 35] (Additional file 3: Figure S2). Blood samples were drawn at days 2–4, 6–9, and 12–18 as long as the patient remained hospitalized. Foreachpatient and foreachT-cell subtype, we plotted the T-cell subtype percentage by the numbers of days after positive blood culture. Th1, Th2, and Th17 per-centages were reported as the proportion of T cells exhi-biting the surface markers corresponding to that subset of total effector CD45RO+CD4+ T cells. Tregs were reported as the proportion of CD25hiCD127lo of total CD4 T cells. The trajectories of T-cell subsets for each patient are displayed in Additional file 4: Figure S3. Because Tregs are unique in their function to modulate Table 2Associations between Th17, Th1, and Th2 cytokine scores early after infection and death during first 90 days after Staphylococcus aureusbacteremia
Associations between each variable and death during the first 90 days after infection
Multivariable model of Th17 and Th1 scores
Multivariable model of Th17 and Th2 scores
Multivariable model of Th1 and Th2 scores
HR 95% CI pValue HR 95% CI pValue HR 95% CI pValue HR 95% CI pValue
Th17 score at time point 1 1.05 0.99–1.10 0.14 1.18 1.06–1.31 0.003 1.21 1.04–1.41 0.01 – – –
Th1 score at time point 1 0.98 0.89–1.08 0.66 0.81 0.68–0.96 0.02 – – – 0.88 0.73–1.06 0.17
Th2 score at time point 1 1.01 0.96–1.07 0.66 – – – 0.86 0.74–1.00 0.049 1.09 0.97–1.22 0.16
Associations between each helper T-cell (Th) score and death was determined using a Cox proportional hazards model. Three multivariable Cox proportional hazards models were performed, each including two of the three helper T cell scores as predictor variables.Dashessignify variables that were not included in the model
a
b
c
[image:6.595.60.540.574.695.2]the immune response, we also examined the ratios of Th1, Th2, and Th17 cells to Treg cells. We used linear regression to predict the change in each T-cell subset percentage per day for each patient. Each regression line was used to estimate a T-cell percentage at day 3 after infection (Additional file 5: Figure S4). The average values for these immune markers for survivors and non-survivors are displayed in Additional file2: Table S8.
When these immune markers were analyzed in a mul-tivariable Cox proportional hazards model, a high early Th2 response was associated with reduced mortality (HR 0.86, 95% CI 0.78–0.94, p< 0.01), whereas a high early Treg response was associated with increased mor-tality (HR 1.13, 95% CI 1.00–1.28, p= 0.046) (Table 4). Over the course of the infection, an increasing Th17/ Treg response was highly associated with increased mor-tality (HR 4.41, 95% CI 1.69–11.5,p< 0.01).
Patients who did not receive immunosuppressive medications were more likely to have augmented Th17 responses than patients who did receive
immunosuppressive medications
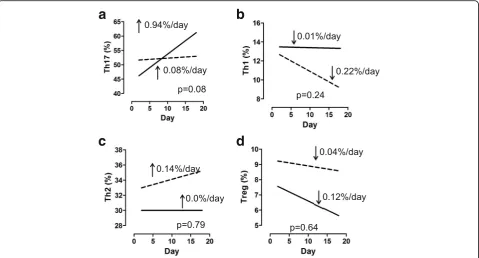
Using linear mixed models, we found that, on average, there were no differences in Th17, Th1, Th2, or Treg re-sponses between our two patient groups (Fig. 5a–d). However, we did find a trend with Th17 responses,
because Th17 cells increased by 0.94% per day among patients who were not receiving immunosuppressive medications and only by 0.08% per day among patients who were receiving immunosuppressive medications (p= 0.08 for difference) (Fig.5a).
Although our investigation of each cell type individu-ally led to no significant differences, our analysis of the degree of proinflammatory Th1, Th2, and Th17 re-sponses relative to the anti-inflammatory Treg response revealed several findings. Strikingly, the Th17/Treg ratio
increased by 0.32 per day among patients who were not receiving immunosuppressive medications anddecreased
by 0.12 per day among patients who were receiving im-munosuppressive medications (p= 0.007 for difference) (Fig. 6a). Similarly, the Th1/Treg ratioincreased by 0.02 per day among patients who were not receiving immuno-suppressive medications and decreased by 0.06 per day among patients who were receiving immunosuppressive medications (p= 0.06 for difference) (Fig.6b). Patients who were and those who were not receiving immunosuppres-sive medications had similar Th2/Treg trends (Fig.6c).
[image:7.595.55.542.110.187.2]When we considered only the 14 patients who died, we noted that patients who were not receiving immuno-suppressive medications tended to die with increasing Th17/Treg ratios (p= 0.09 for difference) (Fig. 6d), whereas patients who were receiving immunosuppressive Table 3Associations between neutrophils, lymphocytes, and helper T cell scores early after infection and death during the first 90 days afterStaphylococcus aureusbacteremia
Associations between each variable and death during first 90 days after infection
Multivariable model
HR 95% CI pValue HR 95% CI pValue
Th17 score/Th1 score at time point 1 1.16 1.05–1.28 0.004 1.13 1.01–1.27 0.03
Th17 score/Th2 score at time point 1 1.20 1.03–1.40 0.02 NS NS NS
Neutrophils/lymphocytes on first day of bacteremia 1.94 1.18–3.2 0.009 1.93 1.17–3.17 0.01
Associations between each variable and death were determined using a Cox proportional hazards model. NS signifies a variable that was removed from the model for apvalue > 0.05
a
b
c
[image:7.595.60.539.542.694.2]a
b
c
d
e
f
[image:8.595.57.539.87.366.2]Fig. 4Cytokine profile scores for patients grouped by presence or absence of immunocompromising medical conditions or medications. Only values measured at time point 1 are displayed.aT-helper type 17 cell (Th17) score.bTh1 score.cTh2 score.dTh17 score/Th1 score.eTh17 score/Th2 score.fTh1 score/Th2 score.Solid linesrepresent mean values.pvalues were all > 0.05 by analysis of variance with Tukey’s posttest for multiple comparisons
Table 4Associations between cellular markers and death during first 90 days afterStaphylococcus aureusbacteremia
Associations between each variable and death during first 90 days after infection Multivariable model
HR 95% CI pValue HR 95% CI pValue
Th17 at day 3 1.03 0.98–1.08 0.25 NS NS NS
Th1 at day 3 0.99 0.90–1.09 0.79 NS NS NS
Th2 at day 3 0.89 0.83–0.96 < 0.01 0.86 0.78–0.94 < 0.01
Treg at day 3 1.06 0.98–1.15 0.17 1.13 1.00–1.28 0.046
Th17/Treg at day 3 0.92 0.81–1.05 0.22 NS NS NS
Th1/Treg at day 3 0.70 0.45–1.09 0.11 NS NS NS
Th2/Treg at day 3 0.74 0.57–0.98 0.03 NS NS NS
ΔTh17/day 1.62 1.08–2.44 0.02 NS NS NS
ΔTh1/day 0.56 0.29–1.09 0.09 NS NS NS
ΔTh2/day 0.93 0.60–1.43 0.73 NS NS NS
ΔTreg/day 0.76 0.45–1.29 0.32 NS NS NS
Δ(Th17/Treg)/day 3.60 1.53–8.49 < 0.01 4.41 1.69–11.5 < 0.01
Δ(Th1/Treg)/day 7.0 0.17–283 0.30 NS NS NS
Δ(Th2/Treg)/day 3.0 0.51–17.2 0.22 NS NS NS
ThT-helper cell,TregRegulatory T cell
[image:8.595.60.539.475.699.2]medications died with decreasing Th1/Treg ratios (p= 0. 03 for difference) (Fig.6e). The Th2/Treg trends were not associated with receiving immunosuppressive medications among the 14 patients who died (Fig.6f). When we con-sidered only the 14 patients who survived, we found that patients who were not receiving immunosuppressive med-ications had increasing Th17/Treg ratios, whereas patients who were receiving immunosuppressive medications had decreasing Th17/Treg ratios (p= 0.006 for difference) (Fig.6g). The trajectories of Th1/Treg and Th2/Treg were not significantly different for survivors among patients who were and those who were not receiving immunosup-pressive medications (Fig.6h,i).
Discussion
In this study of immune responses to S. aureus blood-stream infections, we found that two immune marker ratios were associated with increased risk of death. Inter-estingly, high neutrophil counts and Th17 cytokine re-sponses were not associated with survival in isolation. Rather, neutrophil counts and Th17 cytokine responses were associated with survival only when they were high relative to lymphocyte counts and Th1 cytokine re-sponses, respectively. The average values for these im-mune marker ratios were similar for patients with and without immunocompromising conditions, owing to the fact that the presence of an immunocompromising
condition was associated with proportionately lower neutrophil counts, lymphocyte counts, Th17 cytokine scores, and Th1 cytokine scores.
Patients who are immunocompromised because they have hematopoietic conditions or because they require treatment with immunosuppressive medications are typic-ally viewed as having increased risk of death from sepsis. However, patients with these conditions in our cohort did not have increased 90-day mortality, confirming the results of a prior chart review [23] . The reason for this finding may be that immunocompromising conditions may have both beneficial and harmful effects on the host’s immune response toS. aureus. For instance, such a condition may attenuate a harmful proinflammatory neutrophil or Th17 response. However, being immunocompromised was asso-ciated with a lower lymphocyte and Th1 response, perhaps compromising the ability of the patient to clear the infec-tion or increasing the risk of a subsequent infecinfec-tion.
A strength of our study is that we avoided introducing heterogeneity with respect to causative pathogens. We included only patients with a definite infection due to a single pathogen that typically causes systemic inflamma-tion and severe acute illness that can result in the devel-opment of sepsis. Because sepsis is defined by a clinical response to a presumed infection, it is difficult to iden-tify prognostic immune biomarkers when the pathogens in a study are heterogeneous and some patients may not
a
b
c
d
[image:9.595.59.539.88.346.2]even be infected [4]. In fact, prior investigators have shown that the type of immune dysregulation in sepsis depends on the type of pathogen [36,37].
Th17 responses have been considered protective dur-ing staphylococcal infections, based largely on preclinical mouse studies, as well as the observation that patients with inborn errors in Th17 cells are prone to invasive staphylococcal infections [19]. Although our findings that Th17 responses were associated with increased mortality may seem counterintuitive, we note that pa-tients who received the Merck V710 staphylococcal vac-cine had markedly increased mortality due to S. aureus
infection compared with placebo recipients, suggesting that the vaccination strategy generated a lethal immune response [38]. In light of our data, we hypothesize that the optimal Th17 response must be adequate to clear pathogen but not so overwhelming as to precipitate in-flammatory damage and death to the host. In addition,
the Th17 response must be considered relative to other el-ements of the adaptive immune response, including Th1, Th2, and Treg responses, all of which may be protective.
The observation that Th2 responses were more likely to be elevated among survivors than non-survivors is interesting, especially in light of recent work indicating an association between type 2/Th2 diseases (such as asthma and allergy) and develop-ment of sepsis or sepsis outcomes [39, 40]. These epidemiologic studies suggest that the presence of allergic diseases or asthma reduces the risk for devel-oping sepsis as well as sepsis-associated mortality. We do not have information about allergic comorbidities among these patients. However, given that Th2 responses evolved to facilitate tissue repair and can attenuate proinflammatory Th17 or Th1 responses, the presence of a preexisting Th2 disease may facili-tate the resolution of the inflammatory insult.
a
b
c
d
e
f
g
h
i
[image:10.595.62.538.86.450.2]Tregs provide a crucial check on the early proinflamma-tory response, but their presence is thought to contribute to the vulnerability of patients to subsequent infections in the later phase of sepsis. When Treg percentage was ana-lyzed using multivariable analysis, adjusting for Th2 and Th17 responses, a high early Treg percentage was associ-ated with increased mortality. During the course of the in-fection, an increasing Treg response relative to Th17 response was associated with decreased mortality. These results indicate that consideration of all elements of the adaptive immune response for a given infection provides a more accurate indication of the immune dysregulation of sepsis associated with death.
Our study has several limitations: First, our study was limited by its small size. The cytokine aspect of our study was powered to include two variables in a Cox propor-tional hazards model. We did not perform a sample size calculation prior to our flow cytometry experiment, be-cause we explored infrequently studied immune markers in a group of patients that is typically excluded from sepsis biomarker research. Second, there is no universally accepted definition of an immunocompromised patient [9, 41–43]. Because there is a wide range of types and degrees of severity of immune impairment among patients who are commonly classified as immunocompromised, we categorized patients who had hematopoietic disorders separately from those who were taking immune-altering medications. Third, our evaluation of how immunocom-promising conditions affect the immune response to S. aureus requires confirmation in future adequately powered studies. There were fewer than 10 patients with hematologic malignancies or HIV infections, and none of them died within 90 days of infection. As a result, we did not include any of these patients in the flow cytometry portion of our study. Finally, although we studied infec-tions of the same pathogen type, there were likely genetic differences among S. aureus organisms that we did not account for and that could have affected the immune response and risk of death. The majority of theS. aureus
infections in our study were community-acquired and methicillin-sensitive; neither of these characteristics was associated with mortality.
Conclusions
We found that among patients withS. aureusbacteremia, both increased neutrophil-to-lymphocyte count ratios and increased Th17 immune responses relative to Th1 responses were most strongly associated with increased mortality. Our data suggest that medical conditions and medications that directly affect the immune system may protect patients from a strong Th17 immune response. Conversely, a weak Th1 immune response may identify patients with immunocompromised states who have persistent vulnerability to recurrent infections [44]. One
might speculate that anti-IL-6 therapy may be beneficial only for a subgroup of patients with normal immune states who also have an elevated Th17 level. In contrast, patients with immunocompromising conditions may benefit from interferon-γtherapy to boost Th1 immunity during infection. Future strategies to develop immune-modulatory therapies for sepsis will require personalization to the immune state of the patient and the associated dysregulated immune response.
Additional files
Additional file 1:Figure S1.Enrollment. Between July 1, 2013, and October 24, 2014, there were weeks when no patient was considered for enrollment, during which 33 patients hadS. aureusbacteremia. (PPTX 3105 kb)
Additional file 2:Table S1.Associations between each cytokine level at time point 1 and death during the first 90 days after infection.Table S2. Associations between each cytokine level at time point 2 and death during the first 90 days after infection.Table S3.Method used to calculate Th17, Th1, and Th2 scores.Table S4.Associations between helper T cell scores at time point 2 and death during the first 90 days afterS. aureusbacteremia.Table S5.Associations between the change in helper T cell scores per day and death during the first 90 days afterS. aureusbacteremia.Table S6.Baseline characteristics of 95 patients with
S. aureusbacteremia.Table S7.Comparison of clinical characteristics of 28 patients included (columns 1 and 2) and 67 patients not included (columns 3 and 4) in the flow cytometric analysis.Table S8.Cellular markers early after infection and over the course of the infection among 14 patients who died and 14 patients who survived. (DOCX 50 kb)
Additional file 3:Figure S2.Method used to classify T cells and CD3+CD4+cells. CD4+T cells were first separated into CD25+CD127−
(Tregs) or conventional T cells (Tconv). The Tconv were further characterized by expression of CD45RO as a marker of effector/memory T cells. The CD45RO+cells were then divided into Th1, Th2, or Th17 cells based on the
expression of CCR4 and CCR6, with Th1 identified as CCR4−CCR6−, Th2 identified as CCR4+CCR6−, and Th17 identified as CCR6+. (PPTX 84 kb)
Additional file 4:Figure S3Individual patient trajectories for T-cell subsets. T-cell subset percentages over time for each individual patient are shown, with survivors (at 90 days) indicated by a solid line and non-survivors indicated by a dashed line. (PPTX 670 kb)
Additional file 5:Figure S4Method for determining a patient’s T-cell subset levels. Linear regression was used to predict the change in each T-cell subset percentage per day for each patient. Each regression line was used to estimate a T-cell percentage at day 3 after infection. The day 3 value and change over time were used as predictor variables in Cox proportional hazards models. (PPTX 2104 kb)
Abbreviations
APC:Allophycocyanin; CARS: Compensatory anti-inflammatory response syn-drome; Cy7: Cyanine 7; HIV: Human immunodeficiency virus; HLA: Human leukocyte antigen; IL: Interleukin; PBMCs: Peripheral blood mononuclear cells; PE: Phycoerythrin; SIRS: Systemic inflammatory response syndrome; SOFA: Sequential Organ Failure Assessment; Th: T-helper cell; TNF: Tumor necrosis factor; Treg: Regulatory T cell; WBC: White blood cells
Acknowledgements
Funding
This study was supported by NIH grants T32 HL007605-28, Research Training in Respiratory Biology, University of Chicago, and UL1 TR000430, Clinical and Translational Science Pilot Award, University of Chicago.
Availability of data and materials
The datasets used and/or analyzed during the present study are available from the corresponding author on reasonable request.
Authors’contributions
JAG contributed to the conception and design of the study; data collection and statistical analysis; and drafting, critical revision, reading, and approval of the manuscript. CLH contributed to the conception and design of the study; flow cytometric analysis; and drafting, critical revision, reading, and approval of the manuscript. MRJ contributed to the flow cytometric analysis and critical revision, reading, and approval of the manuscript. MZD contributed to the conception and design of the study and critical revision, reading, and approval of the manuscript. RSD contributed to the conception and design of the study and critical revision, reading, and approval of the manuscript. JBH contributed to the conception and design of the study and critical revision, reading, and approval of the manuscript. JPK contributed to the conception and design of the study and critical revision, reading, and approval of the manuscript. AIS contributed to the conception and design of the study and drafting, critical revision, reading, and approval of the manuscript. PAV contributed to the conception and design of the study and drafting, critical revision, reading, and approval of the manuscript. All authors read and approved the final manuscript.
Ethics approval and consent to participate
The University of Chicago Institutional Review Board approved this study.
Competing interests
The authors declare that they have no competing interests.
Publisher’s Note
Springer Nature remains neutral with regard to jurisdictional claims in published maps and institutional affiliations.
Author details
1
Division of Pulmonary and Critical Care Medicine, Department of Medicine, Rush University Medical Center, 1725 West Harrison Street, Suite 054, Chicago, IL 60612, USA.2Section of Pulmonary and Critical Care Medicine,
Department of Medicine, University of Chicago, Chicago, IL, USA.3Division of
Infectious Disease, Department of Medicine, University of Pennsylvania, Philadelphia, PA, USA.4Section of Infectious Disease and Global Health,
Department of Pediatrics, University of Chicago, Chicago, IL, USA.
5Committee on Immunology, University of Chicago, Chicago, IL, USA.
Received: 1 August 2017 Accepted: 3 April 2018
References
1. Vincent JL, Marshall JC, Namendys-Silva SA, Francois B, Martin-Loeches I, Lipman J, Reinhart K, Antonelli M, Pickkers P, Njimi H, et al. Assessment of the worldwide burden of critical illness: the Intensive Care Over Nations (ICON) audit. Lancet Respir Med. 2014;2(5):380–6.
2. Leentjens J, Kox M, van der Hoeven JG, Netea MG, Pickkers P. Immunotherapy for the adjunctive treatment of sepsis: from
immunosuppression to immunostimulation. Time for a paradigm change? Am J Respir Crit Care Med. 2013;187(12):1287–93.
3. Kaukonen KM, Bailey M, Pilcher D, Cooper DJ, Bellomo R. Systemic inflammatory response syndrome criteria in defining severe sepsis. N Engl J Med. 2015;372(17):1629–38.
4. Singer M, Deutschman CS, Seymour CW, Shankar-Hari M, Annane D, Bauer M, Bellomo R, Bernard GR, Chiche JD, Coopersmith CM, et al. The Third International Consensus Definitions for Sepsis and Septic Shock (Sepsis-3). JAMA. 2016;315(8):801–10.
5. Tolsma V, Schwebel C, Azoulay E, Darmon M, Souweine B, Vesin A, Goldgran-Toledano D, Lugosi M, Jamali S, Cheval C, et al. Sepsis severe or septic shock: outcome according to immune status and immunodeficiency profile. Chest. 2014;146(5):1205–13.
6. Williams MD, Braun LA, Cooper LM, Johnston J, Weiss RV, Qualy RL, Linde-Zwirble W. Hospitalized cancer patients with severe sepsis: analysis of incidence, mortality, and associated costs of care. Crit Care. 2004;8(5):R291–8. 7. Gomez HG, Gonzalez SM, Londono JM, Hoyos NA, Nino CD, Leon AL,
Velilla PA, Rugeles MT, Jaimes FA. Immunological characterization of compensatory anti-inflammatory response syndrome in patients with severe sepsis: a longitudinal study. Crit Care Med. 2014;42(4):771–80.
8. Wu JF, Ma J, Chen J, Ou-Yang B, Chen MY, Li LF, Liu YJ, Lin AH, Guan XD. Changes of monocyte human leukocyte antigen-DR expression as a reliable predictor of mortality in severe sepsis. Crit Care. 2011;15(5):R220.
9. Greenberg JA, Hohmann SF, Hall JB, Kress JP, David MZ. Validation of a method to identify immunocompromised patients with severe sepsis in administrative databases. Ann Am Thorac Soc. 2016;13(2):253–8. 10. Minejima E, Bensman J, She RC, Mack WJ, Tuan Tran M, Ny P, Lou M,
Yamaki J, Nieberg P, Ho J, et al. A dysregulated balance of proinflammatory and anti-inflammatory host cytokine response early during therapy predicts persistence and mortality inStaphylococcus aureusbacteremia. Crit Care Med 2015;2016;44(4):671–9.
11. Rose WE, Eickhoff JC, Shukla SK, Pantrangi M, Rooijakkers S, Cosgrove SE, Nizet V, Sakoulas G. Elevated serum interleukin-10 at time of hospital admission is predictive of mortality in patients with Staphylococcus aureus bacteremia. J Infect Dis. 2012;206(10):1604–11.
12. Remick DG. Cytokine therapeutics for the treatment of sepsis: why has nothing worked? Curr Pharm Des. 2003;9(1):75–82.
13. Drewry AM, Ablordeppey EA, Murray ET, Beiter ER, Walton AH, Hall MW, Hotchkiss RS. Comparison of monocyte human leukocyte antigen-DR expression and stimulated tumor necrosis factor alpha production as outcome predictors in severe sepsis: a prospective observational study. Crit Care. 2016;20(1):334.
14. DeLorenze GN, Nelson CL, Scott WK, Allen AS, Ray GT, Tsai AL, Quesenberry CP Jr, Fowler VG Jr. Polymorphisms in HLA class II genes are associated with susceptibility toStaphylococcus aureusinfection in a white population. J Infect Dis. 2016;213(5):816–23.
15. Brown AF, Murphy AG, Lalor SJ, Leech JM, O’Keeffe KM, Mac Aogain M, O’Halloran DP, Lacey KA, Tavakol M, Hearnden CH, et al. Memory Th1 cells are protective in invasiveStaphylococcus aureusinfection. PLoS Pathog. 2015;11(11):e1005226.
16. Archer NK, Harro JM, Shirtliff ME. Clearance ofStaphylococcus aureusnasal carriage is T cell dependent and mediated through interleukin-17A expression and neutrophil influx. Infect Immun. 2013;81(6):2070–5. 17. Bagnoli F, Fontana MR, Soldaini E, Mishra RP, Fiaschi L, Cartocci E, Nardi-Dei V,
Ruggiero P, Nosari S, De Falco MG, et al. Vaccine composition formulated with a novel TLR7-dependent adjuvant induces high and broad protection against
Staphylococcus aureus. Proc Natl Acad Sci U S A. 2015;112(12):3680–5. 18. Brady RA, Bruno VM, Burns DL. RNA-seq analysis of the host response to
Staphylococcus aureusskin and soft tissue infection in a mouse model. PLoS One. 2015;10(4):e0124877.
19. Brown AF, Leech JM, Rogers TR, McLoughlin RM.Staphylococcus aureus
colonization: modulation of host immune response and impact on human vaccine design. Front Immunol. 2014;4:507.
20. Krishna S, Miller LS. Innate and adaptive immune responses against
Staphylococcus aureusskin infections. Semin Immunopathol. 2012;34(2):261–80. 21. Molinaro R, Pecli C, Guilherme RF, Alves-Filho JC, Cunha FQ, Canetti C,
Kunkel SL, Bozza MT, Benjamim CF. CCR4 controls the suppressive effects of regulatory T cells on early and late events during severe sepsis. PLoS One. 2015;10(7):e0133227.
22. Fowler VG Jr, Proctor RA. Where does aStaphylococcus aureusvaccine stand? Clin Microbiol Infect. 2014;20(Suppl 5):66–75.
23. Greenberg JA, David MZ, Hall JB, Kress JP. Immune dysfunction prior to
Staphylococcus aureusbacteremia is a determinant of long-term mortality. PLoS One. 2014;9(2):e88197.
24. Landelle C, Lepape A, Voirin N, Tognet E, Venet F, Bohe J, Vanhems P, Monneret G. Low monocyte human leukocyte antigen-DR is independently associated with nosocomial infections after septic shock. Intensive Care Med. 2010;36(11):1859–66.
25. Monneret G, Finck ME, Venet F, Debard AL, Bohe J, Bienvenu J, Lepape A. The anti-inflammatory response dominates after septic shock: association of low monocyte HLA-DR expression and high interleukin-10 concentration. Immunol Lett. 2004;95(2):193–8.
human T regulatory cell analysis on fresh and viably frozen cells, correlation with epigenetic analysis, and comparison of cord and adult blood. J Immunol Methods. 2013;387(1-2):81–8.
27. Kleeberger CA, Lyles RH, Margolick JB, Rinaldo CR, Phair JP, Giorgi JV. Viability and recovery of peripheral blood mononuclear cells cryopreserved for up to 12 years in a multicenter study. Clin Diagn Lab Immunol. 1999;6(1):14–9.
28. Fitzmaurice GM, Laird NM, Ware JH. Applied longitudinal analysis. 2nd ed. Hoboken, NJ: Wiley; 2011.
29. Hwang SY, Shin TG, Jo IJ, Jeon K, Suh GY, Lee TR, Yoon H, Cha WC, Sim MS. Neutrophil-to-lymphocyte ratio as a prognostic marker in critically-ill septic patients. Am J Emerg Med. 2017;35(2):234–9.
30. Salciccioli JD, Marshall DC, Pimentel MA, Santos MD, Pollard T, Celi LA, Shalhoub J. The association between the neutrophil-to-lymphocyte ratio and mortality in critical illness: an observational cohort study. Crit Care. 2015;19:13.
31. Cosmi L, Maggi L, Santarlasci V, Liotta F, Annunziato F. T helper cells plasticity in inflammation. Cytometry A. 2014;85(1):36–42.
32. Kaiko GE, Horvat JC, Beagley KW, Hansbro PM. Immunological decision-making: how does the immune system decide to mount a helper T-cell response? Immunology. 2008;123(3):326–38.
33. Osuchowski MF, Craciun F, Weixelbaumer KM, Duffy ER, Remick DG. Sepsis chronically in MARS: systemic cytokine responses are always mixed regardless of the outcome, magnitude, or phase of sepsis. J Immunol. 2012;189(9):4648–56.
34. Acosta-Rodriguez EV, Rivino L, Geginat J, Jarrossay D, Gattorno M, Lanzavecchia A, Sallusto F, Napolitani G. Surface phenotype and antigenic specificity of human interleukin 17-producing T helper memory cells. Nat Immunol. 2007;8(6):639–46.
35. Rivino L, Messi M, Jarrossay D, Lanzavecchia A, Sallusto F, Geginat J. Chemokine receptor expression identifies pre-T helper (Th)1, Pre-Th2, and nonpolarized cells among human CD4+central memory T cells. J Exp Med. 2004;200(6):725–35.
36. Gogos C, Kotsaki A, Pelekanou A, Giannikopoulos G, Vaki I, Maravitsa P, Adamis S, Alexiou Z, Andrianopoulos G, Antonopoulou A, et al. Early alterations of the innate and adaptive immune statuses in sepsis according to the type of underlying infection. Crit Care. 2010;14(3):R96.
37. Janols H, Wullt M, Bergenfelz C, Bjornsson S, Lickei H, Janciauskiene S, Leandersson K, Bredberg A. Heterogeneity among septic shock patients in a set of immunoregulatory markers. Eur J Clin Microbiol Infect Dis. 2014;33(3):313–24. 38. McNeely TB, Shah NA, Fridman A, Joshi A, Hartzel JS, Keshari RS, Lupu F,
DiNubile MJ. Mortality among recipients of the Merck V710Staphylococcus aureusvaccine after postoperativeS. aureusinfections: an analysis of possible contributing host factors. Hum Vaccin Immunother. 2014;10(12):3513–6. 39. Krishack PA, Wang K, Rzhetsky A, Solway J, Sperling AI, Verhoef PA.
Preexisting type 2 immune activation protects against the development of sepsis. Am J Respir Cell Mol Biol. 2017;57(5):628–30.
40. Zein JG, Love TE, Erzurum SC. Asthma is associated with a lower risk of sepsis and sepsis-related mortality. Am J Respir Crit Care Med. 2017;196(6):787–90.
41. Nseir S, Di Pompeo C, Diarra M, Brisson H, Tissier S, Boulo M, Durocher A. Relationship between immunosuppression and intensive care unit-acquired multidrug-resistant bacteria: a case-control study. Crit Care Med.
2007;35(5):1318–23.
42. Poutsiaka DD, Davidson LE, Kahn KL, Bates DW, Snydman DR, Hibberd PL. Risk factors for death after sepsis in patients immunosuppressed before the onset of sepsis. Scand J Infect Dis. 2009;41(6-7):469–79.
43. Rubin LG, Levin MJ, Ljungman P, Davies EG, Avery R, Tomblyn M, Bousvaros A, Dhanireddy S, Sung L, Keyserling H, et al. 2013 IDSA clinical practice guideline for vaccination of the immunocompromised host. Clin Infect Dis.
2014;58(3):309–18.