M. Diver,∗ G.R.M. Robb, and G.-L. Oppo
Institute of Complex Systems, SUPA, and Department of Physics, University of Strathclyde, Glasgow, G4 0NG, Scotland
(Dated: January 27, 2014)
We present a theoretical analysis of a Bose-Einstein condensate (BEC) enclosed in an optical cavity driven by an external laser beam. In the limit where the cavity field is adiabatically eliminated, the interaction between the condensate and the cavity displays a range of nonlinear dynamical behaviours, such as multi-stability, quasi-periodicity, and conservative chaotic oscillations. We show that chaotic oscillations are ubiquitous when repulsive atom-atom interactions are included in the model. Despite the complexity of the full coupled BEC-cavity system, the essential features of its nonlinearand chaoticbehaviour are low-dimensional and are well described by considering the evolution of only a few motional states of the BEC.
PACS numbers: Keywords:
1. INTRODUCTION
The interaction between Bose-Einstein condensates (BECs) and optical fields has been a subject of intense activity and interest since the first realisation of BECs in the mid-1990s [1, 2]. In particular, optical lattices have been a valuable tool in BEC experiments, allowing the mimicking of atomic lattices in condensed matter sys-tems and consequently the investigation of fundamental problems such as quantum phase transitions [3]. Initially, optical lattices used in cold atoms and BEC experiments were static entities, but experiments have since demon-strated BECs enclosed in a high-quality optical cavity [4], where a standing-wave cavity mode plays the role of an optical lattice that is dynamic in character and that evolves self-consistently with the BEC [5]. This results in nonlinear behaviour such as optical bistability, which can be described via a simplified model of the BEC-cavity system using only two motional modes of the condensate coupled with a single optical cavity mode [6, 7]. When the position of one of the cavity mirrors is allowed to oscillate, it has been shown that the behaviour of the BEC-cavity system can be chaotic in nature [8]. Theo-retical studies have in the main neglected the atom-atom interactions, but recent work has shown that the inclu-sion of (repulsive) interactions between condensate atoms has a strong effect on the system’s nonlinearity [9, 10].
In this paper we consider the full model of a BEC-cavity system that solves the Gross-Pitaevskii equation coupled to the cavity field and driven by an external laser. As well as considering the limiting case where atom-atom interactions are neglected, we also include repulsive atom-atom interactions for two specific BEC configura-tions corresponding to transverse and longitudinal BEC alignments with the cavity. Using this model, we show
∗Correspondence should be addressed to M. Diver
that even when atom-atom interactions are neglected, the system displays a variety of behaviours, specifically quasi-periodic and chaotic oscillations, which are an in-trinsic feature of the coupling between the cavity field and the BEC. With the addition of repulsive atom-atom interactions, we further show that the region of optical bistability is shifted to higher input intensities (in agree-ment with [10]), and that chaotic oscillations are, beyond a critical pump intensity, ubiquitous.
The results from the full model suggest that some ob-served behaviours of the BEC-cavity system, which have been attributed to stochastic effects [6], could actually be deterministic, chaotic phenomena arising from the non-linear nature of the cavity-BEC interaction. Further, al-though the behaviour of the system is rather complex, its dynamics are low-dimensional, and consequently it should be possible to describe its main features by us-ing a reduced model involvus-ing a limited number of BEC motional states. We demonstrate a strong correspon-dence between the full numerical simulation and a re-stricted model incorporating a reduced number of mo-tional states. We determine the minimum number of modes necessary to describe the nonlinear and chaotic features of the BEC-cavity interaction correctly.
2. BEC IN A CAVITY DRIVEN BY A LASER
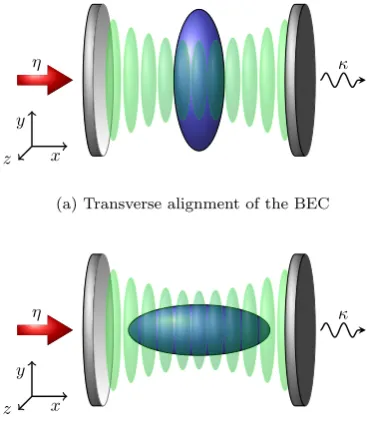
The system described by our model is shown schemat-ically in Fig. 1, and consists of a BEC coupled to a single mode of a Fabry-P´erot optical cavity, which is pumped by a blue-detuned laser. The pump field, with frequency ωp, is dispersively coupled with the atomic resonanceωa,
with the corresponding detuning given by ∆a=ωp−ωa,
and the detuning between the pump and cavity field at ωc is given by ∆c = ωp −ωc. The potential depth of
the lattice formed by the standing-wave cavity mode is characterised by~U0, whereU0=g20/∆ais the frequency
η κ
x y
z
(a) Transverse alignment of the BEC
η κ
x y
z
(b) Longitudinal alignment of the BEC
FIG. 1: (Colour online.) A sketch of the BEC-cavity sys-tem, where the single-mode cavity field interacts with a cigar-shaped condensate that is aligned (a) transverse to the cavity axis, and (b) along the cavity axis. In both cases, the cav-ity is driven by a pump laserη; losses are given byκ. In an experimental setup, the addition of a detector can be used to record the cavity’s transmitted light, which can provide a measure of, e.g., the atom-atom interaction [9].
between an atom and a cavity photon. The pump-atom detuning ∆a is assumed to be sufficiently large such that
theN atoms in the cavity can be assumed to remain in their ground state with negligible spontaneous emission. The cavity photon number |α|2 is affected by the input
pump beam, cavity losses, and by the interaction of the BEC with the cavity mode.
Starting with the three-dimensional Gross-Pitaevskii equation, and following the derivation described in e.g. [11, 12], we arrive at a mean-field, one-dimensional de-scription of the condensate dynamics, where the equation of motion for the coupled BEC-cavity system is (cf. [13])
i~Ψ(X, T˙ ) =
−~2 2m
∂2
∂X2 +|α(T)| 2~U
0sin2(kX)
+g1D|Ψ|2
Ψ(X, T), (1)
where the cavity photon number is given by
|α|2= η2
κ2+ (∆
c−U0O)2
. (2)
The 1-D atom-atom interaction parameter is given by g1D =g3D/(πσyσz) = 2~ω⊥a, where g3D = 4π~2a/m is
the 3D atom-atom interaction parameter, a is the scat-tering length of the BEC, andmis the atomic mass. σy,z
are the dimensions of the trap in they andzdirections.
The transverse trap frequency is ω⊥ = √ωyωz, where
ωy,z = 2~/(mσy,z2 ) are the trap frequencies in the (y, z)
directions. The overlap integral O = hΨ|sin2(kX)
|Ψi describes the driving of the cavity mode by the con-densate, where k = 2π/λ and λ are, respectively, the wavenumber and wavelength of the optical field, κ is the cavity decay rate, and η is the cavity pumping rate. The BEC wave function Ψ is normalised such that hΨ|Ψi=N.
In this paper we consider a condensate formed by87Rb
atoms, withm= 1.44×10⁻²⁵ kg, and with parameters
that correspond to the experimental setup described in [4], so that ∆a = 2π×58 GHz, g0 = 2π×14.1 MHz,
κ = 2π×1.3 MHz, λ = 780 nm, and the number of atoms N = 105. The results are however applicable to
wide ranges of the parameter values.
In Eq. (2), it has been assumed that the optical cavity field,α, decays significantly faster than the timescale of the BEC dynamics in the optical lattice produced by the cavity mode; i.e., the cavity decay rateκis significantly greater than the recoil frequency ωr = ~k2/2m. This
assumption is well justified in many BEC-cavity exper-iments, such as in the case of [4], where κ exceeds ωr
by a factor of∼100. For the purposes of this paper we first concentrate on coupling between atoms solely via the cavity field. We initially assume close proximity to a Feshbach resonance, allowing us to set the scattering length to zero (and thus g1D = 0) in order to neglect
atom-atom interactions. Later we consider two specific instances where g1D > 0, corresponding to two distinct
experimental setups. The first instance, shown in Fig. 1a, considers the situation where the BEC is aligned trans-versely to the cavity axis to simulate a configuration sim-ilar to that used at ETH [4, 6, 14, 15] and designed to minimise the effect of interactions between the atoms. The second instance, shown in Fig. 1b, involves a more common cigar-shaped BEC aligned in the direction of the cavity axis (as in, e.g., [16, 17]).
For the purposes of our analysis, we rewrite Eq. (1) in terms of dimensionless variables and parameters using the transformationt=T /T0, whereT0 =mL2/4~, with
L =λ/2 being the lattice period, x= 2X/L, andψ = Ψp
L/N, giving
˙
ψ(x, t) = i 2
∂2ψ
∂x2 −i|α| 2V
0sin2 πx
2
ψ−iΛ|ψ|2ψ, (3)
where Λ =g1DN T0/(~L) andV0=U0T0are
dimension-less parameters that characterise the scattering length and BEC-lattice coupling strength, respectively. Note that the dimensionless BEC wave function ψ is nor-malised such thathψ|ψi= 1, and thus
|α|2= η
2
κ2 1 + U
0NO0
2κ −
∆c
κ
2!−1
, (4)
where the overlap integralO0 =hψ|sin2(πx/2)
[image:2.595.78.262.59.275.2]if the flow is conservative or dissipative. When the cavity-field dynamics are incorporated, the system is clearly dissipative because of the losses thorough the cavity mirror and relaxes to a sub-space where such dissipations are balanced by the cavity pumping rate. When the cavity field dy-namics is adiabtically eliminated as done in [8] and in Eq. (4), the dynamics starts and evolve
on such sub-space. By evaluating the Jacobian J
of Eqs. (3)-(4) and their complex conjugate, it is possible to demonstrate that
SJ+JTS= 0 (5)
where the skew-symmetric matrixSis of the form
S=
0 I −I 0
(6)
with I being the identity matrix [18]. This
im-plies that the flow (3)-(4) is symplectic and it conserves the volume in phase space. It is impor-tant to stress that the volume is conserved on the sub-space of the full phase space. This is further confirmed by a zero divergence of the flow and the conservation in time of the total atomic den-sity. We note that a symplectic flow may not be Hamiltonain in character although Hamiltonian flows are always symplectic [19]. In our case, the full Hamiltonian character of the interaction
me-diated through the integral O0 =hψ|sin2(πx/2)|ψi
cannot, at present, be established. We are how-ever in the presence of a conservative dynamical system.
3. BISTABILITY, NONLINEAR DYNAMICS,
AND CHAOS IN A NON-INTERACTING CONDENSATE
3.1. Bistability
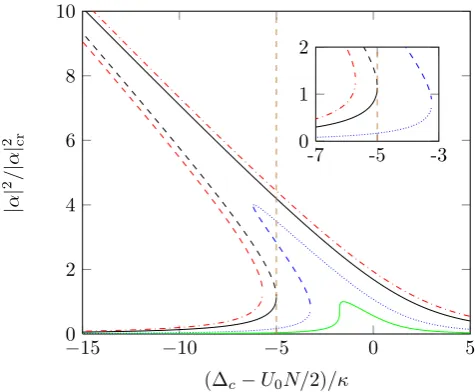
Eqs. (3) and (4) have steady-state solutions, depicted in Fig. 2 for the case where atomic collisions are neglected (Λ = 0), that show nonlinear resonance and bistability when the pump intensity exceeds a critical value [4, 6]. In order to investigate the nonlinear dynamics of the sys-tem, we solve the full Eqs. (3) and (4) using a split-step FFT method for a fixed value of the pump-cavity detun-ing, ∆c−N U0/2 = −5κ. We use the pump rate η as a
controllable parameter for investigation of the dynamics of the bistable region of the resonance curves. Note that, although we use a fixed value for the detuning here, the system behaviour described is generic, and that similar results are obtained for a wide range of values of ∆c if
the pump intensity is also modified accordingly.
The system conserves the total number of atoms N during the dynamical evolution. For this reason, it is important to specify the initial condition correspond-ing to particular experimental conditions. In this paper
-7 -5 -3
0 1 2
−15 −10 −5 0 5
0 2 4 6 8 10
(∆c−U0N/2)/κ
|
α
|
2 /|
α
|
2 cr
FIG. 2: (Colour online.) Resonance curves of increasing size forη/κ = 0.32 (green, smallest), 0.64 (blue, dotted), 1.16 (black, solid), and 1.40 (red,dashed-dotted,largest). The vertical dashed line (brown), at ∆c−U0N/2 =−5κ,
in-dicates the detuning used to investigate the behaviour of the system for increasing pump intensities, and the inset shows the region near this detuning in more detail, for the val-ues η/κ = 1.40 (red, leftmost dashed-dotted curve), 1.16 (black, middle curve), and 0.64 (blue, rightmost dotted curve). They-axis is normalised by |α|2
cr, the
crit-ical value beyond which bistability occurs. (Note that the scattering length here is set to zero.) Quantities are di-mensionless.
we consider the BEC initially at rest in a homogeneous state where the number of atoms is uniformly distributed across the optical cavity. We shall see that the choice of this initial condition corresponds to the dynamics on in-variant manifolds when considering modal expansion of the BEC wave function Ψ in Sec. 5.
3.2. Nonlinear dynamics and chaos
Examples of cavity photon-number evolution as a func-tion of time are shown in Fig. 3 for three values of η (η/κ= 0.99,1.08, and 1.40), corresponding to three dis-tinct cases of crossing the bistable region of the nonlinear resonance curves indicated by the dotted line in Fig. 2. As was demonstrated in [4], the photon-number evolu-tion displays nonlinear oscillaevolu-tions. In order to distin-guish between the different kinds of nonlinear oscillation that occur, we study the frequency spectrum of the in-tracavity intensity/photon number and the evolution of the BEC for these different pumping rates. Fig. 4 shows the temporal spectra of the cavity photon number |α|2
[image:3.595.318.556.53.249.2]indi-cating regular oscillation when η/κ= 0.99 (see inset in Fig. 4), while there is a much broader spectrum sugges-tive of chaotic behaviour when η/κ = 1.08, and when η/κ = 1.40, the spectrum is composed of a number of distinct frequencies characteristic of quasi-periodic non-linear oscillations.
In order to further investigate the nonlinear behaviour of the full system, we obtain phase-space plots using the modes
cn(t) = 1
LD Z LD/2
−LD/2
ψ(x, t) e−iπnxdx, (7)
where LD is the length of the BEC in units of x, i.e.,
LD= 2LBEC/L, whereLBEC is the length of the BEC.
Using the conjugate pair X = −LD
√
8NRe(c0(c∗1 +
c∗
−1)/2) and P = LD
√
8NIm(c0(c∗1 +c∗−1)/2), we are
then able to plot the system’s evolution in phase space (Fig. 5). By constructing Poincar´e sections of the phase-space orbits, we are then able to evaluate the true pe-riodicity of the system. Poincar´e sections are evaluated at the zero-crossing of the real part of the first motional state of the condensate,c1. The sections resulting from
this approach corresponding to the orbits of Fig. 5 are provided in Fig. 6.
At very low pump intensities (η/κ <0.10 for our pa-rameters), the system displays periodic behaviour in both the photon number|α|2and the BEC dynamics, as shown
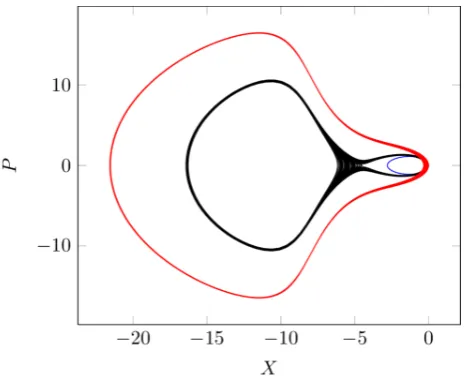
by the Poincar´e sections (which correspond to a single point). For values of η/κ above 0.33, the system enters the nonlinear regime (consider, for example, the reso-nance curve given in Fig. 2 forη/κ = 0.64). For values of η/κabove this, but below η/κ= 1.07, quasi-periodic behaviour is apparent in the Poincar´e sections (cf. the innermost orbit of Fig. 5 with the corresponding projec-tion in Fig. 6). We note however that, even for values of η/κ as large as 0.99, this quasi-periodicity is barely visible in the oscillations of thecavity-fieldintensity, as demonstrated by the inset in Fig. 3a.
Just above η/κ = 1.07, the system evolution ap-proaches the separatrix that separates the motion con-fined around a single stationary point to orbits that cir-cle around all three stationary points. The unstable sep-aratrix is embedded in the orbit projection displayed in Fig. 5 for η/κ = 1.08 where weakly chaotic motion is observed. The critical value ofη/κcorresponding to the cross-over between confined and extended orbits in the (X, P) plane (i.e., when the initial condition is exactly located on the separatrix) is estimated from the condi-tion of tangency of the resonance curves, with respect to the detuning ∆c, to be atη/κ≈1.16 (see inset of Fig. 2).
From our numerical simulations,we observe a first
interval of chaotic motion for η/κ in the range 1.07– 1.21, which includes the critical value of tangency. Since Eqs. (3)-(4) conserve the volume in phase space (see Section 2), the chaotic motion is “conserva-tive” in nature, in contrast to dissipative chaos.
We are now able to explain the evolution of the photon number |α|2 with increasing values of η as displayed in
Fig. 3. For values ofη/κ <1.07, such as that of Fig. 3a, |α|2displays a clear (quasi-)periodic evolution. Near the
separatrix (e.g., at η/κ = 1.08, as in Fig. 3b), chaotic oscillations in the photon number become apparent; this behaviour is characteristic of conservative chaos. Finally for values beyond the separatrix region, the oscillation of the photon number is often quasi-periodic or locked between the two competing frequencies such as that used in Fig. 3c.
For a BEC-cavity system where the scattering length a≈0 (e.g., if operating close to a Feshbach resonance), we observe after the separatrix chaos an alternation of quasi-periodic and chaotic behaviours (see the Poincar´e sections in Figs. 6a and 6b). The appearance and disap-pearance of chaotic dynamics is due to successive tran-sitions from quasi-periodic motion to frequency lockings, and vice-versa, typical of the quasi-periodic route to chaos [20].
3.3. Spatial behaviour of the BEC
In addition to the (temporal) frequency spectra of the previous section, we also consider the time-averaged spa-tial spectra of the BEC wave function/order parameter, Ψ(x, t), as shown in Fig. 7 forη/κ= 0.99,1.08, and 1.40 corresponding to the phase-space plots of Fig. 5.
The spatial frequency componentscn with spatial
pe-riods λ/2n are calculated from the integration of the full model equations using Eq. (7). The amplitude of the zero-frequency (spatially uniform) component of the BEC, c0, dominates the amplitudes of the
non-zero spatial-frequency components for all the parame-ter ranges considered here (see for example the cases of Fig. 7). The significance of the additional spatial modes varies depending on the value of η. In Fig. 7a, where η/κ= 0.99, the dynamics is dominated by the first spa-tial mode/motional state of the BEC, i.e., the compo-nent of the BEC with spatial period equal to λ/2, with the second spatial harmonic having an amplitude that is smaller by three orders of magnitude. Higher harmonics have negligible amplitude. Fig. 7b, where η/κ = 1.08, shows the presence of additional spatial modes while the relative amplitude of each spatial frequency component to the next is reduced compared to Fig. 7a. This indi-cates that the spatial behaviour of the BEC is now more complex due to the chaotic motion. The distribution of excited spatial modes in Fig. 7c, where η/κ = 1.40, is similar to that of Fig. 7b, whose peaks are indicated on Fig. 7c for comparison. While the dominant spatial modes have now become even more significant, it should be noted that the highest frequency component visible in the spectrum of Fig. 7b at±12.5 is now absent, indicat-ing a simpler dynamical regime than that of Fig. 7b.
al-0.081305 0.081310 0.081315
60 65 70 75 80 85 90 0.04
0.05 0.06 0.07 0.08
t
|
α
|
2
(a)η/κ= 0.99
60 65 70 75 80 85 90 0
0.2 0.4 0.6 0.8 1 1.2
t
(b)η/κ= 1.08
60 65 70 75 80 85 90 0
0.5 1 1.5 2
t
(c)η/κ= 1.40
FIG. 3: (Colour online.) The temporal evolution of the photon number|α|2
, for η/κ = 0.99 (Fig. (a), where the upper panel is a magnification of the top part of the oscillatory trajectory), 1.08 (Fig. (b)), and 1.40 (Fig. (c)), showing weakly quasi-periodic, chaotic, and quasi-periodic oscillations, respectively. Note that all quantities are dimensionless (see text before Eq. (3)).
though the dynamics for values ofη/κlarger than one are quite complex, the exponential decrease of the mode am-plitude with increasing|n|demonstrates that the number of active modes is always finite and limited to less than nine.
0 1 2
0 0.005 0.01
0 2 4 6 8 10
0 0.02 0.04 0.06 0.08 0.10 0.12
1/t
|
fft(
|
α
|
2)|
(arb.
units)
FIG. 4: (Colour online.) Frequency spectra for η/κ = 1.08 (black, thick line) and 1.40 (blue, dashed line), with inset showing η/κ = 0.99 (red, thick line) alongside η/κ = 1.40
(blue, dashed line)in greater detail (note the leftward fre-quency shift for the higher value of η/κ). The spectra for
η/κ= 0.99 and 1.40 both exhibit characteristic quasi-periodic behaviour, while the broadened spectrum for η/κ= 1.08 in-dicates chaos. Quantities are dimensionless.
FIG. 5: (Colour online.) Phase-space orbits forη/κ = 0.99 (blue, innermostorbit), 1.08 (black, figure-of-eightorbit), and 1.40 (red, outermostorbit), showing regular oscillations, (weakly) chaotic dynamics, and quasi-periodic behaviour, re-spectively. Quantities are dimensionless.
4. WIDESPREAD CHAOS IN A REPULSIVE
BEC
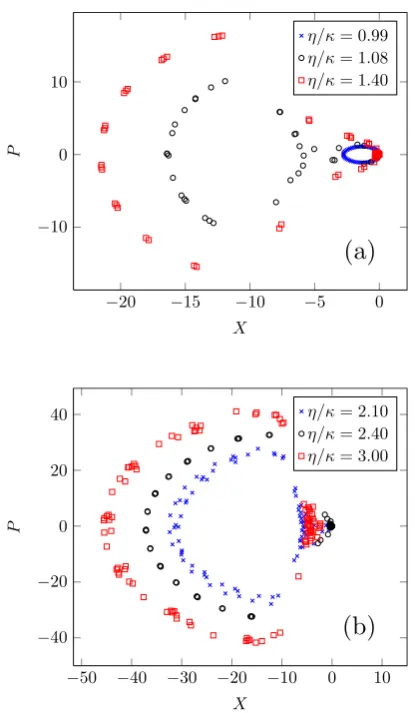
[image:5.595.66.551.54.234.2] [image:5.595.323.556.303.491.2] [image:5.595.56.294.423.620.2]−20 −15 −10 −5 0
−10 0 10
(a)
X
P
η/κ= 0.99
η/κ= 1.08
η/κ= 1.40
−50 −40 −30 −20 −10 0 10
−40
−20 0 20 40
(b)
X
P
η/κ= 2.10
η/κ= 2.40
η/κ= 3.00
FIG. 6: (Colour online.) (a) Poincar´e sections constructed from the orbits shown in Fig. 5, for the values η/κ = 0.99 (blue crosses), 1.08 (black circles), and 1.40 (red squares). (b) Poincar´e sections for η/κ= 2.1 (blue crosses), 2.4 (black circles), and 3.0 (red squares). Quantities are dimension-less.
interactions on the one-dimensional model, typical values of the scattering length in87Rb show that the magnitude
of the interaction term can still be significant: for our pa-rameters, Λ = 85.5 for a transversely aligned BEC, com-pared to Λ = 204 for a longitudinally aligned condensate. The significance of atom-atom interactions is too great to be neglected (see, e.g., [10]); as mentioned in Sec. 1, for example, recent experiments have shown that the reso-nance of the BEC-cavity system is altered by the presence of atom-atom interactions. In this section, we therefore extend our analysis of the BEC-cavity’s chaotic dynam-ics to include repulsively interacting condensates (Λ>0) and show that chaotic dynamics becomes a ubiquitous feature of the BEC-cavity interaction. Poincar´e sections for representative instances of repulsive condensates are used to indicate the presence of wide-ranging chaotic be-haviour, while, for the purposes of quantifying the degree of chaos exhibited by each of the two alignments, we
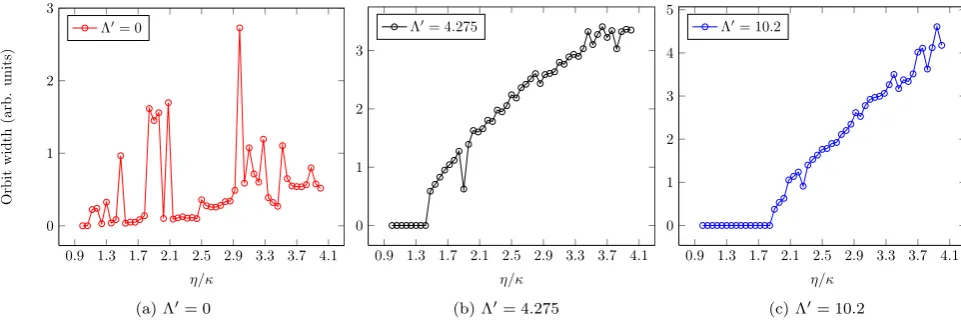
eval-uate the widths along the X-axis of the orbits in the phase space (X, P), such as those shown in Fig. 5. To do this, we record the thicknesses at the negative-to-positive zero crossing ofP (this ensures that we record only the leftmost part of the phase-space orbit). As the measured widths of the plots increase, so too does the spread of the data points in the corresponding Poincar´e sections. Transient behaviours have been discarded. In order to focus on the main features, we restrict our consideration to values of η/κ over the range 0.90–4.10; that is, only the quasi-periodic and chaotic domains are considered.
Fig. 6 shows the Poincar´e sections for three different values of pump intensityη, exhibiting the variety of be-haviours for the non-interaction model. Similarly, we now evaluate the sections for both the transverse (Λ = 85.5) and longitudinal (Λ = 204) BEC alignments. For Λ>0, the onset of chaos is attained at larger values of η with respect to the non-interaction case: where previously the onset of chaotic dynamics was apparent fromη/κ≈1.07, we find that it is now shifted upwards to η/κ ≈ 1.47 (η/κ ≈ 1.88) for Λ = 85.5 (Λ = 204). With η ad-justed accordingly, we obtain Fig. 8 (Λ = 85.5) and Fig. 9 (Λ = 204).
The sections for the two alternative alignments both show that chaos is now a predominant feature of the in-teraction dynamics. As in Fig. 6, the section below the onset of chaotic dynamics displays quasi-periodicity. Be-yond this however, we find that the behaviour is exclu-sively chaotic, with the two largest values ofη/κin each of Figs. 8 and 9 showing a spread in the distribution of points that increases in a roughly linear fashion with in-creasingη.
Beyond a critical value ofη, the widths of the phase plots, given in Figs. 10a–c, tend to increase in a roughly linear fashion with η for Λ > 0, while for the model neglecting atom-atom interactions (Λ = 0), the onset of chaotic behaviour is sporadic. It should be apparent that, for this system, chaotic motion cannot be neglected even when close to a Feshbach resonance.
As an additional measure of chaoticity, we also cal-culate the number of temporal frequency components of the photon-number evolution that exceed a fixed thresh-old value. For small values ofη, where a minimal number of components stray above the cut-off point, there is good agreement between the plots of the spectral components and the orbit widths. In fact, the plot of the spectral components in the cavity field, for Λ = 0, is in good agreement with the orbit widths up to η/κ ≈ 3.2. For Λ > 0, there are two main domains of behaviour, viz. before and after the respective critical points. From the onset of chaos at the critical points ofη/κ= 1.47 (1.88) for Λ = 85.5 (204), a substantial increase in the number of high-magnitude components is apparent.
[image:6.595.72.280.46.403.2]-3 -2 -1 0 1 2 3 -9
-7 -5 -3 -1
n
log
10
[
cn
amplitudes]
η/κ= 0.99
(a)η/κ= 0.99
-4 -3 -2 -1 0 1 2 3 4 -9
-7 -5 -3 -1
n
η/κ= 1.08
(b)η/κ= 1.08
-4 -3 -2 -1 0 1 2 3 4 -9
-7 -5 -3 -1
n
η/κ= 1.08
η/κ= 1.40
(c)η/κ= 1.40
FIG. 7: (Colour online.) Averaged spatial spectra forη/κ= 0.99,1.08, and 1.40, showing the amplitudes of the spatial frequency componentscn. Fig. (a) indicates the two main modes that describe the BEC wave function. In (b), additional
modes are apparent, and the prominence of the main mode is lessened as a consequence of the increased influence of the new modes. Once we reachη/κ= 1.40, we see that the highest-frequency mode apparent in (b) has disappeared. Quantities are dimensionless.
−25 −20 −15 −10 −5 0 −20
0 20
X
P
η/κ= 1.43 η/κ= 1.77 η/κ= 2.22
FIG. 8: (Colour online.) Phase-space orbits for a repulsive BEC (Λ = 85.5) whenη/κ= 1.43 (blue crosses), 1.77 (black circles), and 2.22 (red squares), showing quasi-periodic oscil-lations and chaotic dynamics. Quantities are dimension-less.
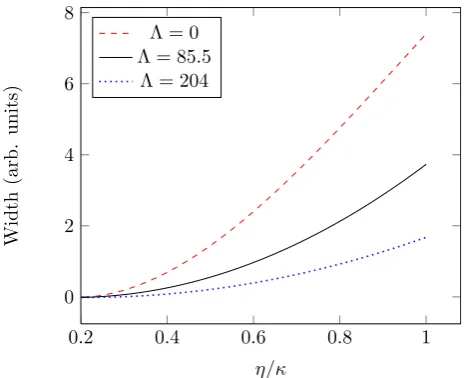
Figs. 11 and 12, in agreement with [10]. We have extrap-olated that for high enough values of Λ, the bistability will disappear. As shown in Fig. 11, for a fixed value of η, the bistable region is decreased as Λ is increased; for an interaction strength of Λ = 204, corresponding to an axially aligned condensate, there is no bistability from η/κ≈0.34 (the bistability threshold for the Λ = 0 case) up to η/κ ≈ 0.63. In an environment where the interaction strength can be tuned (e.g., by manipulating the scattering length near a Feshbach resonance), this provides the opportunity to use the BEC-cavity system as anoptical switch [21]. This mechanism could poten-tially be used instead of, or in addition to, other switching
−25 −20 −15 −10 −5 0 −40
−20 0 20 40
X
P
η/κ= 1.80 η/κ= 2.27 η/κ= 2.84
FIG. 9: (Colour online.) Phase-space orbits for a repulsive BEC (Λ = 204) whenη/κ= 1.80 (blue crosses), 2.27 (black circles), and 2.84 (red squares), showing quasi-periodic oscil-lations and chaotic dynamics. Quantities are dimension-less.
methods such as the introduction of a transverse beam above a threshold intensity [22] or the addition of a Kerr medium into the cavity [23].
5. REDUCED MODEL OF THE BEC-CAVITY
NONLINEAR DYNAMICS
[image:7.595.66.555.59.212.2] [image:7.595.60.295.291.479.2] [image:7.595.325.555.295.485.2]0.9 1.3 1.7 2.1 2.5 2.9 3.3 3.7 4.1 0
0.2 0.4 0.6 0.8 1.0
η/κ
Width
of
X
(arb.
units)
Λ = 0
(a) Λ = 0
0.9 1.3 1.7 2.1 2.5 2.9 3.3 3.7 4.1 0
0.5 1.0
η/κ
Λ = 85.5
(b) Λ = 85.5
0.9 1.3 1.7 2.1 2.5 2.9 3.3 3.7 4.1 0
0.5 1.0
η/κ
Λ = 204
(c) Λ = 204
0.9 1.3 1.7 2.1 2.5 2.9 3.3 3.7 4.1
0 200 400 600
η/κ
Coun
t
of
high-v
alued
com
p
onen
ts Λ = 0
(d) Λ = 0
0.9 1.3 1.7 2.1 2.5 2.9 3.3 3.7 4.1
0 20 40 60 80
η/κ
Λ = 85.5
(e) Λ = 85.5
0.9 1.3 1.7 2.1 2.5 2.9 3.3 3.7 4.1
0 20 40 60 80 100
η/κ
Λ = 204
(f) Λ = 204
FIG. 10: (Colour online.) Alternative approaches for quantifying the chaotic dynamics of the BEC-cavity system. The plots of (a)–(c) show the thickness of phase-space portraits, such as those from Fig. 5, for a range of values ofη; plots (d)–(f) show for the same range the number of components in the power spectra for|α|2
(normalised to unity) with a magnitude greater than 10−3. Quantities are dimensionless.
0.2 0.4 0.6 0.8 1
0 2 4 6 8
η/κ
Width
(arb.
units)
Λ = 0 Λ = 85.5
Λ = 204
FIG. 11: (Colour online.) The width of the region of bista-bility for both the non-interaction case(red dashed curve)
and the two alternative alignments, for Λ = 85.5 (black middle curve) andΛ = 204(blue dotted curve). Quan-tities are dimensionless.
0 50 100 150 200
0 2 4 6
Λ
Width
(arb.
units)
η/κ= 0.44 η/κ= 0.72 η/κ= 1.00
[image:8.595.59.556.57.385.2] [image:8.595.324.555.455.642.2] [image:8.595.60.293.457.646.2]and chaotic, the spatial dynamics of the BEC is rel-atively simple, being dominated by only a few spatial frequencies, which are integer multiples of the “lattice wavenumber” kL = 4π/λ. In several previous studies
(e.g., [6, 7, 16]), a highly simplified model involving only a spatially uniform BEC plus a component with spatial periodλ/2 was used to describe the BEC-cavity dynam-ics. This model, although a dramatic simplification of the spatial description of the BEC, was still capable of describing some of the oscillatory and nonlinear features of the system behaviour, e.g., the bistability shown in Fig. 2 [4]. It should be noted, however, that it does not reproduce other important aspects of the system’s non-linear dynamics, e.g., chaos.
The spatial spectra shown in Fig 7 suggest that the simplified model of [4, 6, 7] would be inadequate to de-scribe the BEC-cavity system when, e.g.,η/κ= 1.08, as higher-order spatial frequency components attain a suffi-ciently large amplitude to have a significant influence on the system dynamics. The presence of a limited number of spatial modes, however, suggests that the dynamics of the BEC remains confined to a small number of variables even when the system is chaotic. Here we derive a simpli-fied model of the BEC-cavity interaction using a projec-tion onto a number of spatial modes, which is capable not only of reducing to the model of [6], but also of describing chaos and including atom-atom interactions. Our model shows that, in contrast to the Λ = 0 case where the dy-namics is mostly quasi-periodic, in cases where Λ > 0, chaos is ubiquitous beyond a critical input value. Fur-thermore, our model gives an alternative — deterministic — account for previously experimentally observed inter-mittent oscillations [6] attributed to stochastic detector noise.
5.1. Modal expansion
For our reduced model, we assume that the BEC wave function is periodic on the scale of the lattice periodλ/2 and can therefore be well-described by a finite series of Nmax spatial modes
ψ(x, t) =√1 nL
Nmax
X
n=−Nmax
cn(t)einπx, (8)
where nL = LBEC/(λ/2) is the number of lattice sites
occupied by the BEC. Substituting ψ(x, t) as defined in Eq. (8) into Eq. (3) we obtain
dcn
dt =−i n2π2
2 cn−i |α|2V
0
2
cn−
cn−1
2 −
cn+1
2
−iΛ0
Nmax
X
k,m=−Nmax
ckc∗mcn+m−k (9)
where Λ0 = Λ/nL, while the overlap integral, O0 in
Eq. (4), becomes
O0=Dψ sin
2πx
2 ψ
E
=1 2
" 1−
Nmax
X
n=−Nmax
c∗n(cn−1+cn+1) #
. (10)
In what follows, we investigate cases that involve trun-cating the modal expansion (i.e., reducing the value of Nmax), and comparing the predictions of these reduced
models with the results from the full model presented above, in order to determine the level of model com-plexity and dimension required to capture the relevant features of the interaction dynamics.
The model of [6], which involves only a spatially uni-form BEC component plus a component with spatial pe-riodλ/2, is recovered by imposingNmax= 1 in Eqs. (8)–
(10),c−1=c1 and|c0|2>>|c1|2. While thisNmax = 1
model is capable of describing some of the nonlinear fea-tures of the system behaviour when the BEC is non-interacting (Λ = 0), such as the bistability shown in Fig. 2 and the regular oscillations in Fig. 3 (cf. [6]), it cannot show chaotic dynamics. As shown in Sec. 3.2, chaos does occur for a non-interacting BEC, and is a dominant feature of the nonlinear dynamics in a repul-sive condensate (Λ > 0) (see Sec. 4). It is then neces-sary to go beyond the Nmax = 1 case in order to
de-scribe the full nonlinear dynamics of the BEC-cavity in-teraction. We consequently show that extension of the spatial-mode model to five modes (i.e.,Nmax= 2, so that
n= 0,±1,±2) gives good agreement with the results of the full model of Eq. (3), even in cases where the system dynamics is chaotic.
5.2. The three-mode and the two-mode models (n= 0,±1)
A key feature of the modal expanded equations Eqs. (8)–(10) is symmetry. In the case of three modes n= 0,±1, for example, the six dynamical equations are invariant upon the exchange of then=±1 indices. When writing the modal equations in amplitude and phase by usingcn = µnexp(iφn) the index symmetry is reflected
[image:9.595.72.295.663.722.2]FIG. 13: (Colour online.) Projection of the three-dimensional evolution of system (13)–(15) on the (X, D) plane showing a clear two-dimensional dynamics and no chaotic motion. The parameters are: top (red) curve (Λ0= 0, η/κ= 1.2), interme-diate (black) curve (Λ0= 4.275, η/κ= 1.8) and bottom (blue) curve (Λ0 = 10.2, η/κ = 2.5). Quantities are dimension-less.
FIG. 14: (Colour online.) Phase-space portraits as calculated from the five-mode model (Eq. (8)) whenNmax = 2 when a
non-interacting condensate (Λ = 0) for the valuesη/κ= 0.99 (blue, innermostorbit), 1.08 (black,figure-of-eightorbit), 1.40 (red, outermostorbit). See Fig. 5 for a comparison with the results of the full model. Note that quantities are dimensionless.
and that of the difference of the modal phases
d(µ1−µ−1)
dt =
µ0|α|2V0
2 sin
φ1−φ−1
2
(11)
cos
φ1+φ−1−2φ0
2
+ Λ0µ20(µ1−µ−1) sin (φ1+φ−1−2φ0)
d(φ1−φ−1)
dt =
µ0|α|2V0
4 (12)
cos(φ1−φ0)
µ1 −
cos(φ−1−φ0)
µ−1
+ Λ0 µ21−µ2−1
−Λ0µ20 µ
−1
µ1 −
µ1
µ−1
cos (φ1+φ−1−2φ0).
These equations demonstrate the existence of an in-variant manifold since for initial conditions satisfying c−1 =c1 there is no evolution of the differences of their
phases and their amplitudes so that c−1 = c1 remains
valid at all times. The invariant manifold is then charac-terised by the dynamics of only two modes, e.g., c0 and
c1. The dynamics outside this invariant manifold
corre-sponding to non-trivial initial conditions is outside the scope of this paper and will be discussed elsewhere.
By using again the decomposition in amplitudes and phases, it is also possible to demonstrate that there are only three coupled dynamical variables, the amplitudes µ0andµ1and the phase difference ∆ =φ1−φ0. The
evo-lution of the phase sum is affected by these three variables but does not, in turn, affect their dynamics. Since the three equations forµ0 and µ1 and ∆ are complemented
by the conservation condition of |c0|2+ 2|c1|2 = 1/2,
the dynamical variables reduce from the initial six to just two variables, and chaotic dynamics becomes im-possible. Note that this conclusion is slightly different from the implementation made in [4, 6] where a reduc-tion of coupled variables is attained under the approx-imation |c0|2 ≡ 1/2, also used in [8]. To illustrate the
two-dimensional nature of the three-mode dynamics on the invariant manifold, we have introduced the variables R = Re(c0c∗1), I =Im(c0c∗1), in agreement with [4, 6],
andD=|c0|2−2|c1|2to obtain
dR dt = I
−π
2
2 + Λ0
4
D−1 2
(13)
dI dt =
π2 2 R−
|α|2V 0D
4 +
Λ0R 4
7D+1
2
(14)
dD
dt = 2I |α|
2V
0−8Λ0R (15)
where αof Eq. (4) now contains O0 = 1/2−2R. Note that the condition of the conservation of the total BEC mass has now been entered into the dynamical equations and that the divergence of the flow
dR˙ dR +
dI˙ dI +
dD˙
[image:10.595.53.301.68.270.2] [image:10.595.318.561.72.236.2]−25 −20 −15 −10 −5 0 −20
0 20
X
P
η/κ= 1.43 η/κ= 1.77 η/κ= 2.22
FIG. 15: (Colour online.) Poincar´e sections as calculated from the mode model (Eq. (8)) when Nmax = 2 for the case of a
repulsive condensate where Λ0= 4.275, forη/κ= 1.43(blue crosses), 1.77 (black circles), and 2.22 (red squares). See Fig. 8 for a comparison with the results of the full model.
Quantities are dimensionless.
as required by conservative dynamical systems.
In Fig. 13 from top to bottom, we show the results of the numerical integration of Eqs. (13)–(15) with X = −2√2N R for (Λ0 = 0, η/κ = 1.2), (Λ0 = 0.4275, η/κ= 1.8) and (Λ0 = 10.2, η/κ = 2.5). The two-dimensional structure of the invariant manifold is apparent. Note that for all these parameter values the simulation of the full equations displays chaotic motion (see Fig 10). We can then conclude that the three-mode and two-mode models with initial conditions on the invariant manifold cannot properly describe the nonlinear interaction of the BEC with light in an optical cavity.
5.3. The five-mode model (n= 0,±1,±2)
We now consider the dynamics generated by the cou-pling of five modes by using Eq. (8) withNmax= 2. The
symmetry of the system reduces again the total num-ber of coupled variables in the case of initial conditions satisfying c−1 = c1 and c−2 = c2 since the equations
are invariant upon exchange of the ±1 and±2 indices. In the five-mode case, however, it is possible to demon-strate that all phase differences are coupled with each other thus leaving a final five-dimensional system when including the mass-conservation rule. A five-dimensional nonlinear system can display quasi-periodicity and chaos. Fig. 14 shows phase-space plots for the five-mode model with initial conditions satisfying c−1 = c1 and
c−2 = c2. There is excellent agreement between this
figure and the corresponding results from the full model (Fig. 5). In particular, we note a remarkable agreement forη/κ= 1.08 where the system is close to a separatrix
−25 −20 −15 −10 −5 0 −40
−20 0 20 40
X
P
η/κ= 1.80 η/κ= 2.27 η/κ= 2.84
FIG. 16: (Colour online.) Poincar´e sections as calculated from the mode model (Eq. (8)) whenNmax = 2 for the case of a
repulsive condensate where Λ0= 10.2, forη/κ= 1.80 (blue crosses), 2.27 (black circles), and 2.84 (red squares). See Fig. 9 for a comparison with the results of the full model.
Quantities are dimensionless.
and weakly chaotic motion occurs around the unstable fixed point around (X =−4.5, P = 0).
Further evidence of the accuracy of the nonlinear dy-namics of the five-mode model is provided in Figs. 15 and 16, where the Poincar´e sections for values of the param-eter Λ different from zero are presented. These figures should be compared respectively with Figs. 8 and 9 ob-tained by the numerical integration of the full model.
To complete the comparison between the full and the five-mode models we present in Fig. 17 the measurement of the width of the Poincar´e sections performed on the five-mode model. When compared with similar mea-surements performed on the full model and displayed in Fig. 10, we can conclude that the five-mode model cap-tures well all nonlinear feacap-tures of relevance, from the bistable and separatrix behaviour to the quasi-periodic and chaotic dynamics.
6. CONCLUSION
[image:11.595.60.295.49.238.2] [image:11.595.324.555.51.243.2]fur-0.9 1.3 1.7 2.1 2.5 2.9 3.3 3.7 4.1 0
1 2 3
η/κ
Orbit
width
(arb.
units)
Λ0= 0
(a) Λ0= 0
0.9 1.3 1.7 2.1 2.5 2.9 3.3 3.7 4.1
0 1 2 3
η/κ
Λ0= 4.275
(b) Λ0= 4.275
0.9 1.3 1.7 2.1 2.5 2.9 3.3 3.7 4.1
0 1 2 3 4 5
η/κ
Λ0= 10.2
(c) Λ0= 10.2
FIG. 17: (Colour online.) Measurement of the orbit widths taken from the integration of the five-mode model. In each of the three cases, the results depict behaviour in agreement with that shown for the three values of Λ (i.e., 0, 85.5, and 204) given in Fig. 10. Quantities are dimensionless.
ther research into the nonlinear dynamics of macroscopic quantum systems.
Although the results from our analysis suggest that the behaviour of the BEC-cavity system is rather complex, it is remarkable that its dynamics are low-dimensional and describable by a simplified model involving as few as five BEC spatial modes/motional states. Our results suggest that when starting from a homogeneous state, the light-matter interaction remains confined to a few spatial modes of progressively smaller and smaller amplitude. The situation may be different if one considers initial conditions away from the homogeneous state, possibly leading to localisation and solitonic states. This will be the subject of future investigations.
Further investigations stemming from the work
pre-sented here concern the introduction of a modulated pump laser field. Our aim is to study further the be-haviour of condensates in disordered and chaotic regimes and investigate novel nonlinear and quantum phenomena involving both long-range (cavity-mediated) and short-range (collision-mediated) interactions.
Acknowledgments
We thank A. Politi for useful discussions. We
acknowledge financial support from the Engineering and Physical Sciences Research Council (EP/HO49339).
[1] B. P. Anderson and M. A. Kasevich, Science282, 1686 (1998).
[2] P. J. Y. Louis, E. A. Ostrovskaya, C. M. Savage, and Y. S. Kivshar, Phys. Rev. A67, 013602 (2003).
[3] M. Greiner, O. Mandel, T. Esslinger, T. W. H¨ansch, and I. Bloch, Nature415, 39 (2002).
[4] S. Ritter, F. Brennecke, K. Baumann, T. Donner, C. Guerlin, and T. Esslinger, Appl. Phys. B 95, 213 (2009).
[5] H. Ritsch, P. Domokos, F. Brennecke, and T. Esslinger, Rev. Mod. Phys.85, 553 (2013).
[6] F. Brennecke, S. Ritter, T. Donner, and T. Esslinger, Science322, 235 (2008).
[7] D. Nagy, P. Domokos, A. Vukics, and H. Ritsch, Eur. Phys. Jour. D55, 659 (2009).
[8] K. Zhang, W. Chen, M. Bhattacharya, and P. Meystre, Phys. Rev. A81, 013802 (2010).
[9] A. Dalafi, M. Naderi, M. Soltanolkotabi, and S. Barzan-jeh, Phys. Rev. A87, 013417 (2013).
[10] D. Nagy, G. Szirmai, and P. Domokos, Eur. Phys. Jour. D67, 124 (2013).
[11] N. Efremidis and D. Christodoulides, Phys. Rev. A67, 063608 (2003).
[12] R. Carretero-Gonz´alez, D. J. Frantzeskakis, and P. G. Kevrekidis, J. Phys. B: At. Mol. Opt. Phys. 21, R139 (2008).
[13] P. Horak, S. M. Barnett, and H. Ritsch, Phys. Rev. A
61, 033609 (2000).
[14] F. Brennecke, T. Donner, S. Ritter, T. Bourdel, M. K¨ohl, and T. Esslinger, Nature450, 268 (2007).
[15] K. Baumann, C. Guerlin, F. Brennecke, and T. Esslinger, Nature464, 1301 (2010).
[16] J. M. Zhang, F. C. Cui, D. L. Zhou, and W. M. Liu, Phys. Rev. A79, 033401 (2009).
[17] D. Nagy, G. Szirmai, and P. Domokos, Eur. Phys. Jour. D48, 127 (2008).
[18] R. Abraham and J. E. MarsdenFoundations of Mechan-ics(Addison-Wesley, New York, 1978)
[19] G. Gaeta and P. Morando, Journal of Nonlinear Math. Phys.10, 539 (2003)
[image:12.595.64.545.62.222.2]Univer-sity Press, Oxford, 2000).
[21] A. Dalafi, M. H. Naderi, M. Soltanolkotabi, and S. Barzanjeh, J. Phys. B: At. Mol. Opt. Phys.46, 235502 (2013).
[22] S. Yang, M. Al-Amri, J. Evers, and M. S. Zubairy, Phys.
Rev. A83, 053821 (2011).

![Fig. 2 [4]. It should be noted, however, that it does not](https://thumb-us.123doks.com/thumbv2/123dok_us/1631442.116376/9.595.72.295.663.722/fig-noted-does.webp)