O R I G I N A L R E S E A R C H A R T I C L E
Comparison of Modes of Administration and Alternative Formats
for Eliciting Societal Preferences for Burden of Illness
Donna Rowen1• John Brazier1•Anju Keetharuth1• Aki Tsuchiya1,2•
Clara Mukuria1
The Author(s) 2015. This article is published with open access at Springerlink.com
Abstract
Background Proposals for value-based assessment, made by the National Institute of Health and Care Excellence (NICE) in the UK, recommended that burden of illness (BOI) should be used to weight QALY gain. This paper explores some of the methodological issues in eliciting societal preferences for BOI.
Aims This study explores the impact of mode of admin-istration and framing in a survey for eliciting societal preferences for BOI.
Methods A pairwise comparison survey with six arms was conducted online and via face-to-face interviews, involving two different wordings of questions and the inclusion/exclusion of pictures. Respondents were asked which of two patient groups they thought a publically funded health service should treat, where the groups varied by life expectancy without treatment, health-related quality of life (HRQOL) without treatment, survival gain from treatment, and HRQOL gain from treatment. Responses across different modes of administration, wording and use of pictures were compared using chi-squared tests and probit regression analysis controlling for respondent socio-demographic characteristics.
Results The sample contained 371 respondents: 69 were interviewed and 302 completed the questionnaire online. There were some differences in socio-demographic
characteristics across the online and interview samples. Online respondents were less likely to choose the group with higher BOI and more likely to treat those with a higher QALY gain, but there were no statistically signifi-cant differences by wording or the inclusion of pictures for the majority of questions. Regression analysis confirmed these results. Respondents chose to treat the group with larger treatment gain, but there was little support for treating the group with higher BOI. Respondents also preferred to treat the group with treatment gains in life expectancy rather than HRQOL.
Conclusions Mode of administration did impact on responses, whereas question wording and pictures did not impact on responses, even after controlling for the socio-demographic characteristics of respondents in the regres-sion analysis.
Key Points for Decision Makers
Mode of administration impacted on responses to questions eliciting societal preferences for burden of illness.
In general, question wording and the inclusion of pictures did not impact on responses to questions eliciting societal preferences for burden of illness.
1 Introduction
Economic evaluation is used to determine whether new healthcare interventions are cost effective and hence should be reimbursed. Cost-utility analysis can be used to & John Brazier
1 Health Economics and Decision Science, School of Health
and Related Research (ScHARR), University of Sheffield, Regent Court, 30 Regent Street, Sheffield S1 4DA, UK
2 Department of Economics, University of Sheffield,
Sheffield, UK
determine whether the intervention is cost effective by generating the cost per quality-adjusted life-year (QALY) gained. The QALY combines length of life with quality of life with the latter based on average individual preferences for different health states.
This study is concerned with the role of mode of administration and alternative formats of questions on responses to questions about the social value of a QALY. One position is to assume that one QALY is always of equal societal worth regardless of who receives the QALY; ‘‘a QALY is a QALY’’ [1], and this is often the implicit basis for cost-utility analyses. However, it has been sug-gested that some people are more deserving of QALY gains than others, such as on the basis of age, severity of disease or responsibility [2–5], and so their QALYs should be given a higher weight (and hence others a lower weight). Recently, there has been policy interest in the UK in two particular attributes. The National Institute of Health and Care Excellence (NICE) attaches more value to life expectancy gains in patients near to their end of life than those who are not (the ‘end of life’ criterion [6]), though the weighting it uses is not based on public preferences. More recently, there has been policy interest in a broader notion of severity that captures health-related quality of life (HRQOL) and survival known as ‘burden of illness’ (BOI) [7, 8]. BOI operationalises the idea of disease severity using the prospective QALY loss suffered by patients with a condition such as breast cancer (allowing for current treatments), compared with their expected QALYs in the absence of the condition, from the decision point relating to a new treatment. As far as we are aware, no other prior study has elicited preferences for this version of severity.
In order to elicit societal preferences for different attri-butes, there are a number of methodological decisions to be made: (i) elicitation technique, (ii) mode of administration and (iii) survey framing. The method for eliciting prefer-ences selected for this study is a discrete choice experiment (DCE) that asks respondents a series of pairwise compar-isons of groups of patients who vary in the attributes of interest. DCE is a well established technique that has started to be used to estimate social value weightings for QALYs [9]. DCE can be used in internet online surveys to provide speedy and comparatively cheap means of collecting data. However, there may be concerns about the quality of the data from poor understanding and engagement by respon-dents with the task of making social choices.
Two key modes of administration that can be used to collect preference data are face-to-face interviews and internet-based online surveys. Face-to-face interviews have been most widely used to elicit preferences, but in recent years there has been increased interest in collecting pref-erence data online [10–12]. Each mode has advantages and disadvantages that can impact on the data that are
generated and therefore the choice of mode needs careful consideration. Face-to-face interviews are expensive and time consuming and as a result often have a lower sample size. The interviewer can monitor understanding, poten-tially leading to higher quality data and completion rates, yet there are concerns that there may be an interviewer effect where responses are influenced by the presence of the interviewer. Online surveys enable a large number of responses to be collected quickly and relatively cheaply but raise concerns about the quality of the data as without an interviewer present there is no guarantee that the respon-dent has understood or engaged with the survey. Neither face-to-face interviews nor online surveys typically achieve samples that are fully representative of the general population. Face-to-face interviews usually involve inter-viewing respondents in their own home and so depend on who is at home at the time the interviewer visits, whereas online surveys are restricted to respondents who have access to the internet, and, if an online panel is used to recruit respondents, then respondents who have self-se-lected to answer online surveys. This means that mode of administration has important implications for the sample of respondents.
There is a limited literature examining the impact of mode of administration for the elicitation of societal pref-erences regarding how QALYs are distributed. Two studies examined the use of the person trade-off elicitation tech-nique and compared responses collected online and face-to-face via computer-assisted personal interview [10, 11], finding overall broadly similar responses across the dif-ferent modes of administration. Another study examined the use of binary choice health state valuation questions online and in a face-to-face computer-assisted personal interview (CAPI), again finding overall similar responses across the different modes of administration [12].
This study seeks to explore the impact of mode of administration; framing of questionnaire wording (e.g. labelling choice options using a label that says condition or patient group); and use of pictures on a survey, based on a framework designed to elicit societal preferences for BOI, and makes recommendations for future surveys using a similar framework. A pairwise comparison survey with six arms was conducted, where three arms were administered in an online survey and three arms were administered using face-to-face interviews.
2 Methods
2.1 The Framework
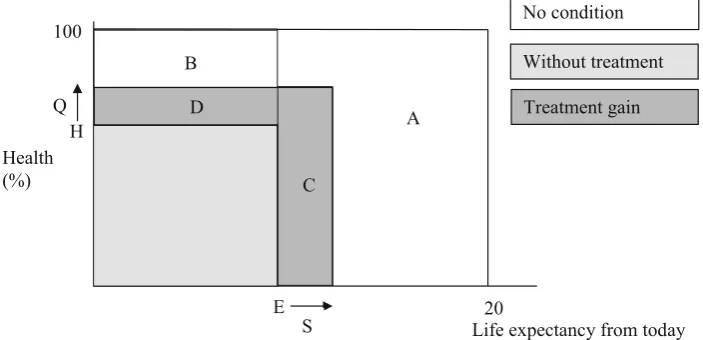
The concept of BOI is presented in Fig.1. Prospective BOI is measured from now, the point at which the healthcare intervention is being considered (for simplification in the survey it is assumed that the patient either has or does not have treatment). From this point, patients have an HRQOL without the treatment, represented as health level H with life expectancy E. Patients given the treatment will gain HRQOL Q and years of survival S. If the patient did not have the condition, they would have HRQOL at 100 % for 20 years. BOI is generated as the difference between the expected prospective health profile without the condition and the prospective health profile with the condition but without the treatment, calculated asA ?B?C?D. This can be separated into QALY loss due to premature
mortality (areas A?C in Fig.1) and QALY loss from morbidity (areas B ?D in Fig.1). Treatment gain mea-sured in QALYs is equal to the area of C for survival plus D for HRQOL.
2.2 Survey Arms
The same questions (outlined below) were asked using six different arms. The arms were selected to provide evidence to inform the following research questions:
• Do responses differ when the questionnaire is admin-istered online or in a face-to-face interview?
• Do responses differ by the framing used to word the questions?
• Do responses differ by the inclusion of pictures in the questions?
The arms differed by:
• Modetwo different modes of administration were used: face-to-face interviews and online.
• Wording two different wordings of questions were used. One wording involved a condition label and the scenario was described using change in HRQOL and life expectancy due to having the condition and change in HRQOL and life expectancy due to treatment. The other wording involved a patient group label and the scenario was described using the levels of HRQOL and life expectancy without and with treatment. The labels were chosen as the different groups of patients can be
Where: E = life expectancy without treatment, H = HRQOL without treatment, S =
survival gain from treatment, Q = Health Related Quality of Life gain from treatment,
Quality Adjusted Life Year gain = C+D and Burden of Illness = A+B+C+D
A B
D
C B
E
Life expectancy from today Health
(%)
Without treatment
Treatment gain No condition
20 S
H Q 100
[image:3.595.122.474.459.629.2]thought of as either belonging to different patient groups or conditions, but these terms may not be equally clear or easy to understand for respondents. The two methods of describing the scenario (using change or levels) were chosen as, whilst change is a simpler concept, it does not explicitly provide the information of the level following the change, whereas providing the levels in contrast does not explicitly provide the size of the change. It is unclear which is clearest and easiest to understand for respondents.
• Video an introductory video was used to introduce the survey and the concepts used in the survey with the exception of one arm involving face-to-face interview and no pictures, which had no video.
• Pictures for the latter wording, one questionnaire framing included pictures, the other included no pictures.
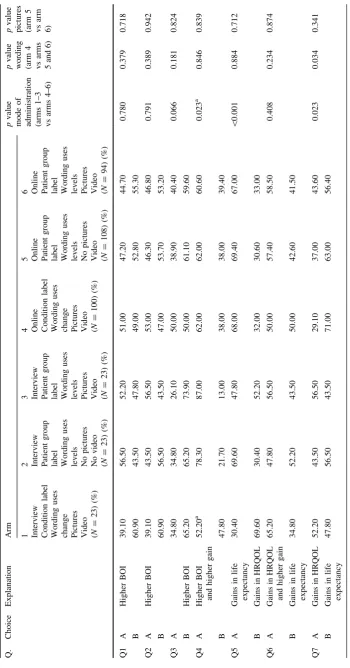
The framing of questions and mode of administration across each arm is summarised in Table1.
2.3 Pairwise Comparison Questions
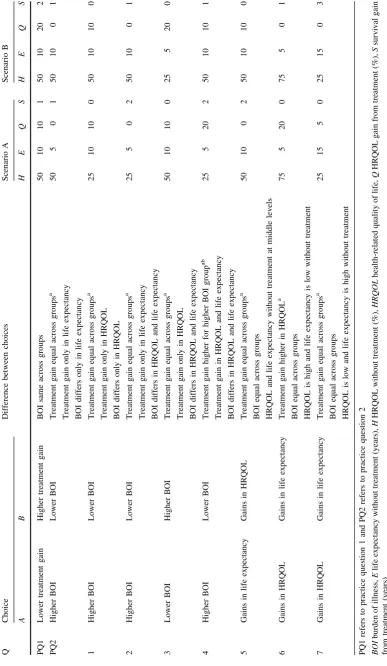
This study used pairwise comparison questions to inform the implementation of a DCE. Respondents were asked which group they thought the National Health Service (NHS) should treat, with no indifference option (see ‘‘Appendix’’). The questions used in this study are not based on a formal statistical design to select the scenarios as in a DCE, and instead, a smaller number of questions were selected (see Table2) to provide evidence to inform the following research questions:
• Do respondents choose to treat the group with larger QALY gain from treatment? (practice question 1 and question 4),
• Do respondents choose to treat the group with higher BOI? (practice question 2 and questions 1–4),
• Do respondents choose to treat the group with treatment gains in either HRQOL or in life expectancy (where treatment gain measured using QALYs is equal)? (questions 5–7),
The study was reviewed and approved in March 2012 by the School of Health and Related Research (ScHARR) Research Ethics Committee at the University of Sheffield.
2.4 The Survey
2.4.1 Interview Setting
Respondents were sampled to be representative of the UK in terms of age and gender. To try to ensure respondents in each arm had the same characteristics, interviewers
selected questionnaires sequentially through the arms to minimise the risk of bias from a correlation of interview location and type of questionnaire. Sampled respondents received a letter and information sheet informing them of the study and that interviewers would be calling at homes in their area. Interviewers knocked on doors and arranged a convenient time to conduct the interview. Respondents were interviewed in their own home by trained and expe-rienced interviewers who had worked on previous valua-tion surveys conducted by the University of Sheffield.
After giving informed consent, respondents in arms 1 and 3 watched a short video on a laptop explaining the questions. Respondents in arm 2 were read a short intro-duction by the interviewer with the same general content as the video but excluding the explanation of the pictures since these were not included in this arm. Each arm had two practice questions that involved the interviewer reminding respondents of the factors to consider when making their choice and subsequently an explanation of their choice with one chance for respondents to change their mind and treat the other group. This process was used to enhance respondent understanding of the survey. Fol-lowing the two practice questions, respondents completed seven interviewer-administered pairwise comparison questions, self-complete questions on attitudes (not repor-ted here), own health in EQ-5D (indicating no problem, some problem or severe problem in mobility, self-care, usual activities, pain or discomfort and anxiety or depres-sion) and socio-demographics and then interviewer-ad-ministered questions on their understanding and what they thought of the survey. At the end of the interview, the interviewer reported their perception of respondent under-standing, effort and concentration.
2.4.2 Online Setting
Respondents from an online panel were contacted via email to participate in the survey. Respondents were sampled to be representative of the UK in terms of age and gender except for a smaller sample of respondents aged over 65 years. At the start of the survey, respondents were presented with an information sheet and gave informed consent to participate in the survey. Respondents were then shown a short video explaining the questions. It could not be ensured that respondents watched the video, but the video had to be played in full before the respondent could proceed to the practice questions.
to seven attempts at each practice question before moving on automatically to the next question. Following the two practice questions, respondents completed seven pairwise comparison questions and questions on attitudes, own health in EQ-5D and socio-demographics, understanding and what they thought of the survey. All questions were compulsory.
2.5 Analysis
Responses between arms are compared using the chi-square test to determine whether responses differ by mode of administration (interview versus online, arms 1 and 3 vs arms 4 and 6), the wording of the questions (‘condition’ label and wording uses change versus ‘patient group’ label and wording uses levels, arm 4 vs arm 6), and the inclusion of pictures in the questions (pictures versus no pictures, arm 5 vs arm 6). The interview arms (arms 1–3, n=23 each arm) are not powered to assess statistically significant differences between the three of them.
Regression analysis is used to assess, for each of the seven questions, the impact of mode of administration and framing on the pairwise comparison responses whilst controlling for the underlying socio-demographics of respondents. The standard specification for each pairwise comparison question is
y ¼aþbxþdzþe ð1Þ
where the dependent variable,y*, represents the preference to treat the group with higher BOI for questions 1–4 and the preference to treat the group with gains in life expec-tancy for questions 5–7 (where BOI is the same across the pairs); x represents the vector of dummies for mode of administration (arms 1 and 3 vs 4 and 6), wording using levels (4 vs 6), and questions involving pictures and wording using levels (5 vs 6); z represents the vector of socio-demographic characteristics; and e represents the error term. As y* is unobserved, all questions are modelled as choices using the probit model and goodness-of-fit statistics are reported. STATA version 11 was used for all regression and statistical analyses.
3 Results
3.1 The Data
Sixty-nine respondents from the North of England were successfully interviewed, providing a response rate of 34 % of respondents who answered the door to the inter-viewer. Three hundred and two respondents completed the online survey, providing a completion rate of 64 % of
people who accessed the survey. All respondents com-pleted every question. No respondents have been excluded from the analysis.
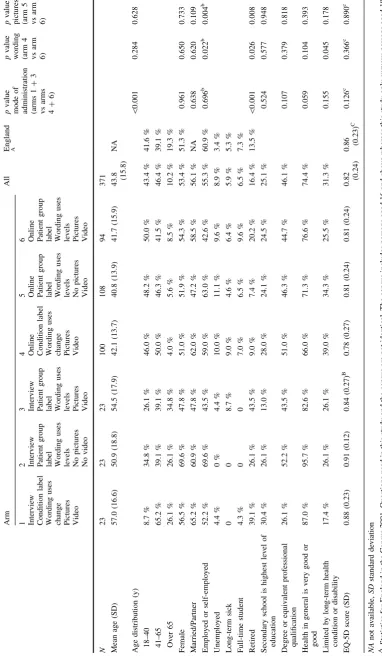
Characteristics of the interview and online samples are summarised in Table3 along with general population values for England. There were statistically significant differences in age, retired respondents and general health in the samples answering questions involving different modes of administration, and differences in employ-ed/self-employed and retired respondents in the samples answering questions involving different wording and pictures. In comparison with the general population of England, the interview samples were older and contained a larger proportion of retired respondents, whereas the online samples were younger, contained a smaller pro-portion of employed and retired respondents and were in poorer health.
3.2 Pairwise Comparison Questions
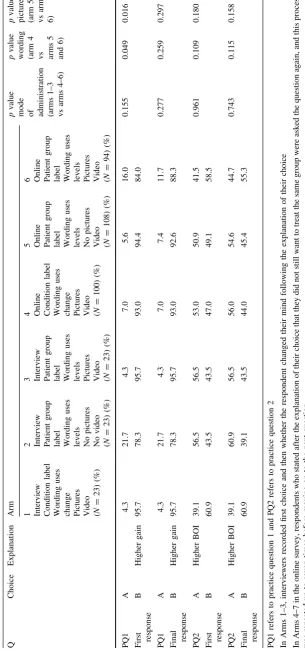
3.2.1 Mode of Administration
There were no statistically significant differences in responses to the practice questions across different modes of administration (see Table4). However, there were sta-tistically significant differences in responses to questions 3, 4, 5 and 7 across different modes of administration (see Table5). A larger proportion of respondents in the inter-viewer arms chose to treat the group with a higher burden of illness (questions 3 and 4) and with higher QALY gain (question 4). A larger proportion of respondents in the online arms chose to treat the group receiving treatment gains in life expectancy (questions 5 and 7).
3.2.2 Wording
Table 3 Sociodemographic characteristics Arm All England A p valu e mode of adm inistration (arms 1 ? 3 vs arms 4 ? 6) p value wordi ng (arm 4 vs arm 6) p va lue pict ures (arm 5 vs arm 6) 1 234 5 6 Intervie w Co ndition label Wordi ng uses change Pic tures Video Intervi ew Pat ient group label Wor ding uses level s N o pictures N o video Intervi ew Patient gr oup label Wording uses
levels Pictures Video
O nline Condi tion label Wordi ng uses
change Pictures Video
[image:8.595.65.448.60.717.2]Table
4
Responses
to
the
practice
questions
Q
Choice
Explanation
Arm
p
value
mode of administration (arms
1–3
vs
arms
4–6)
p
value
wording (arm
4
vs arms
5
and
6)
p
value
pictures (arm
5
vs
arm
6)
1
234
56
Interview Condition
label
Wording
uses
change Pictures Video (N
=
23)
(%)
Interview Patient
group
label Wording
uses
levels No
pictures
No
video
(
N
=
23)
(%)
Interview Patient
group
label Wording
uses
levels Pictures Video (N
=
23)
(%)
Online Condition
label
Wording
uses
change Pictures Video (N
=
100)
(%)
Online Patient
group
label Wording
uses
levels No
pictures
Video (N
=
108)
(%)
Online Patient
group
label Wording
uses
levels Pictures Video (N
=
94)
(%)
PQ1 First response
A
4.3
21.7
4.3
7.0
5.6
16.0
0.155
0.049
0.016
B
Higher
gain
95.7
78.3
95.7
93.0
94.4
84.0
PQ1 Final response
A
4.3
21.7
4.3
7.0
7.4
11.7
0.277
0.259
0.297
B
Higher
gain
95.7
78.3
95.7
93.0
92.6
88.3
PQ2 First response
A
Higher
BOI
39.1
56.5
56.5
53.0
50.9
41.5
0.961
0.109
0.180
B
60.9
43.5
43.5
47.0
49.1
58.5
PQ2 Final response
A
Higher
BOI
39.1
60.9
56.5
56.0
54.6
44.7
0.743
0.115
0.158
B
60.9
39.1
43.5
44.0
45.4
55.3
PQ1
refers
to
practice
question
1
and
PQ2
refers
to
practice
question
2
In
Arms
1–3,
interviewers
recorded
first
choice
and
then
whether
the
respondent
changed
their
mind
following
the
explanation
of
their
choice
In
Arms
4–7
in
the
online
survey,
respondents
who
stated
after
the
explanation
of
their
choice
that
they
did
not
still
want
to
treat
the
same
group
were
as
ked
the
question
again,
and
this
process
was
repeated
up
to
seven
times
before
moving
on
to
the
next
question
BOI
burden
of
[image:9.595.136.442.64.717.2]Table 5 Responses to the pairwise comparison questions Q. Choice Explanation Arm p value mode of administration (arms 1–3 vs arms 4–6) p value wording (arm 4 vs arms 5 and 6) p value pictures (arm 5 vs arm 6) 1 234 56 Interview Condition label Wording uses
change Pictures Video (N
= 23) (%) Interview Patient group label Wording uses levels No pictures No video ( N = 23) (%) Interview Patient group label Wording uses
levels Pictures Video (N
= 23) (%) Online Condition label Wording uses
change Pictures Video (N
= 100) (%) Online Patient group label Wording uses levels No pictures
Video (N
= 108) (%) Online Patient group label Wording uses
levels Pictures Video (N
[image:10.595.113.464.55.724.2]3.2.3 Pictures
The only statistically significant difference across the inclusion of pictures was for practice question 1 for the first response, where a smaller proportion of respondents answering questions including pictures chose to treat the group with higher treatment gain. However, for the final response to the practice question where respondents were allowed to change their mind responses did not differ by the inclusion of pictures.
3.2.4 Treatment Gain
Respondents overwhelmingly chose to treat the group with the highest treatment gain (practice question 1 and question 4).
3.2.5 Burden of Illness
The results vary by question, suggesting that the prefer-ences for BOI are sensitive to the characteristics of the scenario. For three questions there is no clear preference
for treating the group with higher BOI (practice question 2 and questions 1 and 2) and for one question there is a general preference for treating the group with higher BOI (question 3). A larger number of respondents chose to treat the group with the higher BOI and higher treatment gain (question 4).
3.2.6 Gains in HRQOL or Life Expectancy
Respondents in arm 2 and the online arms (arms 4–6) have a preference for treating the group with treatment gains in life expectancy, whereas there is no clear preference for arms 1 and 3 (questions 5 and 7). There is no preference for treating the group with gains in life expectancy where the treatment gain is higher in HRQOL (question 6).
3.3 Regression Analyses
[image:11.595.49.542.366.659.2]Across the seven regression models, the dummy variable representing the online mode of administration was sig-nificant for four questions (questions 3, 4, 5 and 7, Table6). Online respondents were less likely to treat the
Table 6 Regression analyses for the pairwise comparison questions
Pairwise comparison question 1 2 3 4 5 6 7
Dependent variable Choose to treat group with higher BOI Choose to treat group with gains in life expectancy
Online -0.133 -0.026 -0.528*** -0.696*** 0.464** 0.022 0.400**
Wording uses levels (arms 2, 3, 5 and 6)
-0.060 -0.146 0.205 -0.047 0.262 -0.091 -0.141
Wording uses levels and questions involve pictures (arms 3 and 6)
-0.029 0.097 0.073 0.030 -0.195 -0.057 -0.193
Female 0.012 -0.096 -0.024 0.059 -0.123 -0.197 -0.368***
Married 0.020 0.183 0.087 0.095 0.191 0.096 -0.064
Unemployed -0.008 0.004 0.215 -0.173 0.135 -0.374 0.333
Sick -0.163 -0.081 -0.107 0.020 -0.136 -0.408 0.469
Student -0.168 -0.167 0.347 0.195 0.207 0.160 -0.347
Retired -0.447 -0.303 -0.557* -0.421 0.205 -0.167 -0.327
Limited by long-term health condition or disability
0.115 0.178 0.267 -0.060 0.092 -0.028 -0.145
Secondary school is highest level of education
-0.443*** -0.251 -0.538*** -0.320* 0.087 0.244 0.215
Aged 41–65 years -0.354** -0.380** -0.350** -0.404** -0.126 -0.290* 0.064
Aged over 65 years 0.054 -0.016 -0.107 0.068 -0.203 0.091 0.571
Constant 0.412* 0.242 0.762*** 1.279*** -0.166 0.115 0.279
Observations 371 371 371 348 371 371 371
Log likelihood -245.3 -248.2 -229.9 -211.1 -233.0 -247.0 -234.6
PseudoR-squared 0.0449 0.0339 0.0842 0.0686 0.0329 0.0309 0.0551
Online is a dummy variable representing the online mode of administration. ‘Wording uses levels’ is a dummy variable that equals 1 if the wording of the questions uses levels and 0 otherwise (equals 1 for arms 2, 3, 5 and 6, equals 0 for arms 1 and 4). ‘Wording uses levels and questions involve pictures’ is a dummy variable that equals 1 if the wording of the questions uses levels and the questions also involve pictures and 0 otherwise (equals 1 for arms 3 and 6, equals 0 for arms 1, 2, 4 and 5)
group with higher BOI and were more likely to choose to treat the group with gains in life expectancy. The dummy variables for ‘wording uses levels’, and for ‘wording uses levels and questions involve pictures’ were not significant, suggesting that the framing used here did not have a sys-tematic impact on the pairwise comparison results, con-sistent with the results outlined above. Few socio-demographic variables were significant and none were consistently significant across all questions.
3.4 Respondent Views of the Survey
Overall, respondents reported that the questions were lar-gely easy to understand, the interviewer explanation was clear, the wording of the questions was clear, the video was useful and that pictures were helpful (Table7). The pro-portion of respondents reporting that the wording of the questions was clear was larger in the online arms and the difference was statistically significant, but there were no differences in the difficulty of questions, usefulness of the video or helpfulness of the pictures by mode of adminis-tration. There were no differences in respondent views of the survey by wording. The proportion of respondents reporting that the questions were easy to understand and that the video was not useful was larger in the arm that did not include pictures and the difference was statistically significant, but there were no differences in reporting that the wording of the questions was clear by the inclusion of pictures (Table7).
4 Discussion
Overall, there were differences in responses to the pairwise comparison questions between interviewer and online modes of administration, but there were few differences across different framings using different wordings and the inclu-sion/exclusion of pictures. Regression analyses controlling for the socio-demographic characteristics of respondents support these results. The findings are contrary to existing studies finding that responses were overall similar across the different modes of administration [10–12]. However, all these studies involved the use of a computer throughout the interviews, whereas our study used paper-based question-naires in the interviews, with a computer being used only for the introductory video. The use of computers throughout the interview may not enable the same interviewer interaction as face-to-face interviews, and hence for our study this inter-action may have impacted on responses.
The results suggest that the different wordings and inclusion/exclusion of pictures used here did not impact on responses, although a higher proportion of respondents in the arm without pictures found the questions easier to
understand. Mode of administration did impact on responses, but it cannot be judged which is most preferable. In terms of respondent views of the survey, a higher pro-portion of respondents in the online arms reported that the questions were clear, although both modes appear feasible. Overall, the results indicated support for choosing to treat the group with the larger treatment gain, with little support for treating the group with higher BOI, but this was dependent upon the characteristics of the scenarios in each question. Other studies have found a preference for treating patients who have less severe health problems (e.g. [9]), suggesting that a lack of support for BOI may not be sur-prising. Overall, there was a preference for treating the group with treatment gains in life expectancy rather than treatment gains in HRQOL, contrary to a study on the end-of-life criterion that found greater preferences for HRQOL improvement over life expectancy extension [16].
The key limitation of this study surrounds the extent to which respondents understood the task they were doing. Within the design of this study it was not possible to verify the actual understanding of respondents. Their answers to the question about their understanding were positive in most cases, but this has not been validated here. Most respondents answered the first practice question in a logi-cally consistent way. Nonetheless it is a complex task to choose between groups of patients varying in QALY gains and BOI and we cannot rule out a degree of misunder-standing that may invalidate the results surrounding the importance of QALY gain and BOI. This is likely to be less important for the comparison between modes of adminis-tration and ways of framing.
Another important limitation of this survey is the small sample size for each of the interview arms. To account for this, the differences in the interview arms have not been assessed statistically, but this means that the impact of the wording and the inclusion of pictures have not been assessed in the interview arms. In addition, the larger rel-ative size of the online data in the regression analyses may have impacted on the results.
Table
7
Respondents
views
of
the
survey Arm
p
value
mode
of
administration (arms
1–3
vs
arms
4–6)
p
value
wording (arm
4
v
s
arms
5
and
6)
p
value
pictures (arm
5
vs arm
6)
1
234
56
Interview Condition
label
Wording
uses
change Pictures Video
(%)
Interview Patient
group
label Wording
uses
levels No
pictures
No
video
(%)
Interview Patient
group
label Wording
uses
levels Pictures Video
(%)
Online Condition
label
Wording
uses
change Pictures Video
(%)
Online Patient
group
label Wording
uses
levels No
pictures
Video
(%)
Online Patient
group
label Wording
uses
levels Pictures Video
(%)
Pairwise
comparison
questions
were
0.800
0.579
0.084
Very
difficult
to
understand
0
0
0
1.0
0.9
1.1
Quite
difficult
to
understand
8.7
13.0
8.7
10.0
4.6
5.3
Neither
difficult
nor
easy
to
understand
8.7
8.7
21.7
19.0
19.4
24.5
Fairly
easy
to
understand
60.9
47.8
39.1
41.0
31.5
45.7
Very
easy
to
understand
21.7
30.4
30.4
29.0
40.7
23.4
Interviewer
explanation
was
clear
95.7
100.0
100.0
NA
NA
NA
NA
NA
NA
Wording
of
the
questions
was
clear
91.3
100.0
100.0
100.0
97.2
100.0
0.004
NA
0.104
Video
was
useful
78.3
NA
82.6
86.0
69.4
83.0
0.498
0.561
0.025
Pictures
were
helpful
87.0
NA
78.3
89.0
NA
86.2
0.368
0.550
NA
NA
not
[image:13.595.169.418.51.714.2]5 Conclusion
This study shows the importance of survey framing and mode of administration. The results indicate that mode of administration did impact on responses, but that framing in terms of question wording and inclusion of pictures had little impact on responses and had no impact after controlling for the socio-demographic characteristics of the samples.
Acknowledgments We are grateful to the survey respondents. We are grateful to Gavin Roberts and Danny Palnoch from DH for their comments throughout this project. We are also especially grateful to Angela Robinson for her advice on the development of the survey and for her suggestions on a previous draft of the paper.
Author contributions Donna Rowen coordinated the study and contributed to the study design, undertook the analyses and wrote a draft of the paper. John Brazier is the PI for the grant, contributed to design, analyses and writing of the paper, and is guarantor of the overall content. Anju Keetharuth and Aki Tsuchiya contributed to the design, analyses and writing of the paper. Clara Mukuria contributed to the analyses and writing of the paper.
Compliance with Ethical Standards
This is an independent report commissioned and funded by the Policy Research Programme in the Department of Health. The study was undertaken by the Policy Research Unit in Economic Evaluation of Health and Care Interventions (EEPRU) funded by the Department of Health Policy Research Programme. The views expressed are not necessarily those of the Department. Donna Rowen, John Brazier, Anju Keetharuth, Aki Tsuchiya and Clara Mukuria have no conflicts of interest. Ethical approval was provided by the ScHARR Ethics Committee in accordance with the Declaration of Helsinki. Informed consent was obtained from participants in the study.
Open Access This article is distributed under the terms of the Creative Commons Attribution-NonCommercial 4.0 International License (http://creativecommons.org/licenses/by-nc/4.0/), which per-mits any noncommercial use, distribution, and reproduction in any medium, provided you give appropriate credit to the original author(s) and the source, provide a link to the Creative Commons license, and indicate if changes were made.
Appendix
Arms 1 and 4 Question 1
Condition A
reduces health from 100% to 25%
AND reduces life expectancy from 20 years to 10
years
Treatment
restores health from 25% to 35%
BUT does not extend life expectancy
Condition B
reduces health from 100% to 50%
AND reduces life expectancy from 20 years to 10
years
Treatment
restores health from 50% to 60%
BUT does not extend life expectancy
Which group do you think the NHS should treat?
100 patients with Condition A or 100 patients with Condition B?
Arms 2 and 4 Question 1
Both groups of patients have a medical condition, and this affects their health and how long they live
Patient group A
Without treatment
will live for 10years from today
with 25%health
With treatment
will live for 10years from today
with 35%health
Patient group B
Without treatment
will live for 10years from today
with 50%health
With treatment
will live for 10years from today
with60%health
If these patients did not have a medical condition
they would live in 100% health for 20 years from today
Only 1 patient group can be treated, the other patient group will live for the rest of their life without treatment
Which patient group do you think the NHS should treat?
Patient group A Patient group B
Arms 3 and 6 Question 1
Both groups of patients have a medical condition, and this affects their health and how long they live
Patient group A
Without treatment
will live for 10years from today
with 25%health
With treatment
will live for 10years from today
with 35%health
Patient group B
Without treatment
will live for 10years from today
with 50%health
With treatment
will live for 10years from today
with60%health
If these patients did not have a medical condition
they would live in 100% health for 20 years from today
Only 1 patient group can be treated, the other patient group will live for the rest of their life without treatment
Which patient group do you think the NHS should treat?
Reference
1. Weinstein MC. A QALY is a QALY- or is it? J Health Econ. 1988;7:289–90.
2. Green C. Investigating public preferences on ‘severity of health’ as a relevant condition for setting health care priorities. Soc Sci Med. 2009;68(2247):2255.
3. Shah K. Severity of illness and priority setting in healthcare: a review of the literature. Health Policy. 2009;93:77–84. 4. Brazier JE, Ratcliffe J, Solomon JA, Tsuchiya A. Measuring and
valuing health for economic evaluation. Oxford: Oxford University Press; 2007.
5. Nord E. The trade-off between the severity of illness and treat-ment effects in cost-value analysis of health care. Health Policy. 1993;24:227–38.
6. National Institute of Health and Care Excellence (NICE). Appraising life-extending, end of life treatments. London: NICE; 2009(ref type: report).
7. Department of Health. Value based pricing: impact assessment; 2010 (ref type: report).
8. National Institute of Health and Care Excellence (NICE). Con-sultation paper: value based assessment of health technologies. 2014. London: NICE. Available athttps://www.nice.org.uk/Media/ Default/About/what-we-do/NICE-guidance/NICE-technology-appraisals/VBA-TA-Methods-Guide-for-Consultation.pdf (ref type: report). Accessed Dec 2014.
9. Lancsar E, Wildman J, Donaldson C, Ryan M, Baker R. Deriving distributional weights for QALYs through discrete choice experiments. J Health Econ. 2011;30:466–78.
10. Covey J, Robinson A, Jones-Lee M, Loomes G. Responsibility, scale and valuation of rail safety. J Risk Uncertain. 2010;40: 85–108.
11. Damschroder LJ, Baron J, Hershey JC. The validity of person trade-off methods: randomized trial of computer elicitation ver-sus face-to-face interview. Med Decis Mak. 2004;24:170–80. 12. Mulhern B, Longworth L, Brazier J, Rowen D, Bansback N,
Devlin N, Tsuchiya A. Binary choice health state valuation and mode of administration: Head to head comparison of online and CAPI. Value Health. 2013;16:104–13.
13. Roberts T, Bryan S, Heginbotham C, McCallum A. Public involvement in health care priority setting: an economic per-spective. Health Expect. 1999;2:235–44.
14. Bryan S, Roberts T. Public involvement in health care priority setting: an economic perspective. Health Expect. 1999;2(4): 235–44.
15. Bryan S, Roberts T. QALY-maximisation and public preferences: results from a general population survey. Health Econ. 2002;11(8):679–93.
16. Shah KK, Tsuchiya A, Wailoo A. Valuing health at the end of life: an empirical study of public preferences. Eur J Health Econ. 2014;15:389–99.