donor near the period minimum
.
White Rose Research Online URL for this paper:
http://eprints.whiterose.ac.uk/85670/
Version: Accepted Version
Article:
McAllister, M.J., Littlefair, S.P., Baraffe, I. et al. (14 more authors) (2015) PHL 1445: An
eclipsing cataclysmic variable with a substellar donor near the period minimum. Monthly
Notices of the Royal Astronomical Society, 451 (1). pp. 4633-4644. ISSN 0035-8711
https://doi.org/10.1093/mnras/stv956
[email protected]
https://eprints.whiterose.ac.uk/
Reuse
Unless indicated otherwise, fulltext items are protected by copyright with all rights reserved. The copyright
exception in section 29 of the Copyright, Designs and Patents Act 1988 allows the making of a single copy
solely for the purpose of non-commercial research or private study within the limits of fair dealing. The
publisher or other rights-holder may allow further reproduction and re-use of this version - refer to the White
Rose Research Online record for this item. Where records identify the publisher as the copyright holder,
users can verify any specific terms of use on the publisher’s website.
Takedown
If you consider content in White Rose Research Online to be in breach of UK law, please notify us by
PHL 1445: An eclipsing cataclysmic variable with a
substellar donor near the period minimum
M. J. McAllister
1, S. P. Littlefair
1, I. Baraffe
2, V. S. Dhillon
1, T. R. Marsh
3,
J. Bento
7, J. Bochinski
6, M. C. P. Bours
3, E. Breedt
3, C. M. Copperwheat
4,
L. K. Hardy
1, P. Kerry
1, S. G. Parsons
5, J. W. Rostron
3, D. I. Sahman
1,
C. D. J. Savoury
1, R. L. Tunnicliffe
31Dept of Physics and Astronomy, University of Sheffield, Sheffield, S3 7RH, UK
2Dept of Physics and Astronomy, University of Exeter, Exeter, EX4 4QL, UK
3Dept of Physics, University of Warwick, Coventry, CV4 7AL, UK
4Astrophysics Research Institute, Liverpool John Moores University, Liverpool, L3 5RF, UK
5Departmento de F´ısica y Astronom´ıa, Universidad de Valpara´ıso, Avenida Gran Bretana 1111, Valpara´ıso, 2360102, Chile
6Department of Physical Sciences, The Open University, Milton Keynes, MK7 6AA, UK
7Department of Physics and Astronomy, Macquarie University, NSW 2109, Australia
30 April 2015
ABSTRACT
We present high-speed, three-colour photometry of the eclipsing dwarf nova PHL 1445, which, with an orbital period of 76.3 min, lies just below the period minimum of
∼82 min for cataclysmic variable stars. Averaging four eclipses reveals resolved eclipses of the white dwarf and bright spot. We determined the system parameters by fitting a parameterised eclipse model to the averaged lightcurve. We obtain a mass ratio of
q=0.087±0.006 and inclination i=85.2±0.9◦. The primary and donor masses were
found to be Mw=0.73±0.03M⊙ and Md=0.064±0.005M⊙, respectively. Through
multicolour photometry a temperature of the white dwarf of Tw=13200±700 K and
a distance of 220±50 pc were determined.
The evolutionary state of PHL 1445 is uncertain. We are able to rule out a signif-icantly evolved donor, but not one that is slightly evolved. Formation with a brown dwarf donor is plausible; though the brown dwarf would need to be no older than 600 Myrs at the start of mass transfer, requiring an extremely low mass ratio (q=0.025) progenitor system. PHL 1445 joins SDSS 1433 as a sub-period minimum CV with a substellar donor. These existence of two such systems raises an alternative possibility; that current estimates for the intrinsic scatter and/or position of the period minimum may be in error.
Key words: binaries: close - binaries: eclipsing - stars: dwarf novae - stars: individual: PHL 1445 - stars: cataclysmic variables - stars: brown dwarfs
1 INTRODUCTION
Cataclysmic variable stars (CVs) are close binary systems, with each system containing a white dwarf primary and low mass secondary. The secondary star is large enough to fill its Roche lobe and therefore mass is transferred to the white dwarf. In systems with a low magnetic-field white dwarf, this transferred mass does not immediately accrete onto the surface of the white dwarf, instead forming an accretion disc around it in order to conserve angular momentum. A bright spot forms where the gas stream from the donor impacts the disc. For a general review of CVs, see Hellier (2001).
The structure of CVs can, at some inclinations, result in complex eclipses, with the accretion disc, white dwarf and bright spot all being eclipsed by the secondary star in quick succession. High-time resolution photometry allows each of these individual features to be observed and their timings determined, which can then be used to determine accurate system parameters (eg. Wood et al. 1986).
Steady mass transfer from the donor secondary to the white dwarf primary is possible due to angular momentum loss from the system. Without angular momentum loss, mass loss from the donor increases the size of the Roche lobe un-til it is no longer filled by the donor, causing mass transfer
to cease. Angular momentum loss reduces the size of the Roche lobe, countering the effect of donor mass loss and al-lowing steady mass transfer. Mass transfer in CVs leads to an evolution towards smaller system separations and there-fore shorter orbital periods.
As CVs evolve to shorter orbital periods, their donors are driven further away from thermal equilibrium. This is a consequence of mass loss from the donor, more specifically a consequence of the donor’s thermal time scale increasing at a more rapid rate than its mass loss time scale. As mass continues to be transferred from the donor, it eventually enters the substellar regime, and this is approximately where it is far enough away from thermal equilibrium for its radius to no longer decrease in response to further mass loss. The degenerate nature of the substellar donor can even cause its radius to increase in response to mass loss, resulting now in an increasing system separation and orbital period.
CV evolution theory therefore predicts the existence of an orbital period minimum, and this is what is observed, with the period minimum currently estimated to be at
81.8±0.9 min (Knigge, Baraffe & Patterson 2011). An
ac-cumulation of systems is also expected to be found at the period minimum - the “period spike” - due to systems spend-ing more time at this stage in their evolution. This feature
has been observed at 82.4±0.7 min (G¨ansicke et al. 2009),
in excellent agreement with the period minimum. There are, however, a handful of CVs that have periods below this pe-riod minimum.
An example of such a CV, with an orbital period of 76.3 min, is PHL 1445. PHL 1445 was first catalogued as a faint blue object by Haro & Luyten (1962) in the Palomar-Haro-Luyten catalogue, and again (as PB 9151) by Berger & Fringant (1984). It was identified as a CV system by Wils (2009) through spectroscopic analysis of the 6dF Galaxy Survey target 6dFGS g0242429-114646, found to be coinci-dent with PHL 1445. Its spectrum showed double-peaked emission lines, indicating a high inclination and possibly deeply eclipsing system (Wils 2009). The eclipsing nature of PHL 1445 was confirmed by Wils et al. (2011) through follow-up photometry, which also gave the first determina-tion of the system’s orbital period.
There are multiple ways for a hydrogen rich CV to have an orbital period shorter than the period minimum. These include Galactic halo membership (Patterson, Thorstensen & Knigge 2008; Uthas et al. 2011), an evolved donor (Thorstensen et al. 2002; Podsiadlowski, Han & Rappa-port 2003) or formation with a brown dwarf donor (Kolb & Baraffe 1999; Politano 2004). Obtaining PHL 1445’s donor mass and temperature may help reveal why it lies below the period minimum.
In this paper we present high-time resolution
ultra-cameclipse lightcurves of PHL 1445, with system
parame-ters determined through lightcurve modelling of an average lightcurve. Individual lightcurves are also given the same treatment, in order to see how certain parameters vary be-tween eclipses. The observations are described in section 2, the results displayed in section 3, and the analysis of these results in section 4.
2 OBSERVATIONS
PHL 1445 was observed over seven observing runs (Aug 2011
- Jan 2014) using ultracam (Dhillon et al. 2007) on the
4.2-m William Herschel Telescope (WHT), La Palma. Fif-teen eclipses were observed in total, the majority observed
simultaneously in the SDSS-u′
g′
r′
colour bands, the rest in
SDSS-u′g′i′. A complete journal of observations is shown in
Table 1.
Data reduction was carried out using the ultracam
pipeline reduction software (see Feline et al. 2004). A nearby, photometrically stable comparison star was used to correct for any transparency variations during observations. The standard stars Feige 22 (observed at the start of the night on 16th Jan 2012) and SA92-342 (observed at the end of the night on 30th Jul 2013) were used to transform the
photom-etry into theu′g′r′i′z′ standard system (Smith et al. 2002).
The photometry was corrected for extinction using
nightly measurements of the r′-band extinction from the
Carlsberg Meridian Telescope1
, and subsequently converted
intou′,g′andi′-band extinction using the information
pro-vided in La Palma Technical Note 31.2
The typical out-of-eclipse photometric errors were
esti-mated at 4%, 2% & 2% in theu′,g′ andr′ bands,
respec-tively. These errors increased to approximately 12%, 8% & 7% when both the white dwarf and bright spot were eclipsed.
3 RESULTS
3.1 Orbital ephemeris
Mid-eclipse times (Tmid) were determined assuming that the
white dwarf eclipse is symmetric around phase zero:Tmid=
(Twi+Twe)/2, where Twi and Twe are the times of white
dwarf mid-ingress and mid-egress, respectively.TwiandTwe
were determined by locating the minimum and maximum
times of the smoothed g′-band lightcurve derivative. The
Tmiderrors (see Table 1) were adjusted to giveχ2 = 1 with
respect to a linear fit. The eclipse observed on 26th Aug 2011 is the exception here, as no white dwarf features can be seen in the eclipse due to PHL 1445 being in outburst. In
this instance, the time of minimum light was used forTmid.
All eclipses, with the exception of the Aug 2011 outburst eclipse, were used to determine the following ephemeris:
HM JD= 55867.123984(12) + 0.0529848884(13)E
This ephemeris was used to phase-fold the data for the analysis that follows.
3.2 Lightcurve morphology and variations
Aside from the single outburst eclipse mentioned above, all other observations listed in Table 1 show a strong white dwarf eclipse feature. The same cannot be said for a bright
1
http://www.ast.cam.ac.uk/ioa/research/cmt/camc_ extinction.html
2 http://www.ing.iac.es/Astronomy/observing/manuals/ps/
Date Start Phase End Phase Filters Tmid Texp NBLUE Nexp Seeing Airmass Phot?
(HMJD) (seconds) (arcsecs)
2011 Aug 26 -1264.338 -1263.098 u′g′i′ 55800.15106(3) 2.685 2 2098 0.8-1.7 1.35-1.69 No
2011 Nov 01 -0.604 0.131 u′g′r′ 55867.12400(3) 2.137 2 1119 1.0-2.7 1.39-1.51 No
2012 Jan 14 1391.856 1392.217 u′g′r′ 55940.87898(3) 1.979 3 827 1.2-2.5 1.33-1.37 No
2012 Jan 14 1393.696 1394.177 u′g′r′ 55940.98490(3) 1.979 3 1102 1.3-3.5 1.90-2.36 No
2012 Jan 15 1412.678 1413.119 u′g′r′ 55941.99163(3) 1.979 3 1008 1.1-1.9 2.03-2.53 Yes
2012 Jan 16 1429.792 1430.500 u′g′r′ 55942.89237(3) 1.979 3 1619 1.1-6.4 1.36-1.80 Yes
2012 Jan 16 1430.500 1431.183 u′g′r′ 55942.94534(3) 1.979 3 1561 1.1-6.4 1.36-1.80 Yes
2012 Jan 22 1541.725 1542.147 u′g′r′ 55948.82668(3) 1.979 3 966 0.9-3.0 1.32 Yes
2012 Sep 08 5888.678 5889.173 u′g′i′ 56179.15198(3) 2.982 3 754 1.0-1.8 1.36-1.44 No
2012 Oct 13 6546.740 6547.175 u′g′r′ 56214.01605(3) 3.480 3 571 1.4-3.3 1.52-1.69 Yes
2013 Jul 30 12023.706 12024.176 u′g′i′ 56504.21431(3) 3.852 3 557 1.3-2.9 1.54-1.74 Yes
2013 Dec 31 14925.879 14926.216 u′g′r′ 56657.97642(3) 3.922 3 394 1.5-2.5 1.55-1.69 Yes
2014 Jan 01 14941.796 14942.260 u′g′r′ 56658.82417(3) 3.628 3 584 1.0-1.9 1.38-1.47 Yes
2014 Jan 01 14944.657 14945.127 u′g′r′ 56658.98310(3) 3.628 3 591 1.0-1.9 1.54-1.74 Yes
[image:4.612.42.551.86.261.2]2014 Jan 02 14960.781 14961.153 u′g′r′ 56659.83095(3) 3.628 3 467 0.8-1.3 1.37-1.43 Yes
Table 1.Journal of observations. The dead-time between exposures was 0.025 s for all observations. The GPS timestamp on each data point is accurate to 50µs.Tmidrepresents the mid-eclipse time, whileTexp&Nexprepresent the exposure time and number of exposures,
respectively. NBLUE indicates the number ofu′-band frames which were co-added on-chip to reduce the impact of readout noise. The
last column indicates whether or not the observations were photometric.
spot feature, as a bright spot ingress can be discerned in most cases, but not one eclipse shows a clear egress. The reason for the lack of clear bright spot egress in any of these lightcurves is the strong flickering seen in this system. The flickering appears to begin immediately after white dwarf egress at around phase 0.03 (see Figure 1), implying that its source is close to the white dwarf, either in the inner disc or boundary layer.
To help reduce the prominence of the strong flickering present, and to be able to locate the position of the bright spot egress, it was necessary to average multiple eclipses to-gether. The 10 eclipses showing signs of a bright spot ingress were phase-folded using the ephemeris above and averaged, allowing a broad, faint bright spot egress feature to emerge. Averaging also seemed to reduce the strength of the bright spot ingress. After analysing each individual eclipse, it was apparent that the position of the bright spot ingress varied significantly across the range of observations due to changes in accretion disc radius. This is the reason for the bright spot ingress feature becoming broad and weak in the aver-age eclipse.
To fix this issue, four eclipse lightcurves (phases 0, 1413, 1430 & 1431) observed not too far apart in time (Nov 2011 - Jan 2012), with clear bright spot ingresses at a similar po-sition were phase-folded and averaged. It is apparent from Figure 1 that these four chosen eclipses occurred when PHL 1445 was in the lower of two distinct photometric states (clear gap visible in top plot just before white dwarf ingress), although this was not a criterion for choosing candidates for the average. A further two eclipses were observed within this time span (both on 14th Jan), but were not used due to a mixture of bad observing conditions and lack of a visi-ble bright spot ingress. This new average lightcurve revealed much sharper bright spot features than that consisting of all 10 eclipses, and it is worth noting that the position of the bright spot egress remained unchanged from the 10-eclipse average. The total rms of this average lightcurve’s residuals is approximately 7%, which is significantly larger than the
typical photometric error (∼2%) and shows that while
flick-ering has been decreased through averaging, it continues to
Figure 1.T op: All 14 quiescent PHL 1445g′-band eclipses
ob-served.Bottom: Four PHL 1445g′-band eclipses chosen to create
an average.
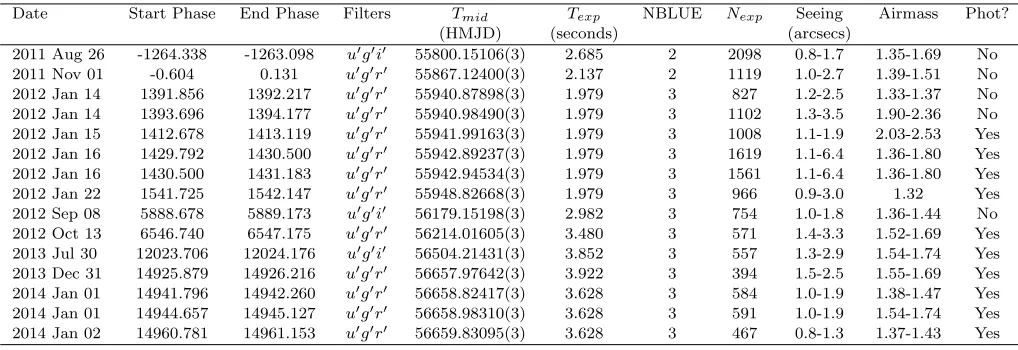
be an issue. A model was then fit to this average lightcurve, in order to obtain the system parameters (Figure 2).
3.3 Phase-folded average lightcurve modelling
The model of the binary system used here to calculate eclipse lightcurves contains contributions from the white dwarf, bright spot, accretion disc & secondary star, and is described in detail by Savoury et al. (2011). We note briefly that the
model constrains the mass ratio (q), white dwarf radius as a
fraction of the binary separation (Rw/a), white dwarf eclipse
phase full-width at half-depth (∆φ) and white dwarf flux;
[image:4.612.298.550.325.540.2]parame-ters were found to change significantly between models, and an F-test (Press et al. 2007) showed the extra complexity is not justified for PHL 1445. The model requires a number of assumptions, including that of an unobscured white dwarf (Savoury et al. 2011). The validity of this assumption has recently been questioned by Spark & O’Donoghue (2015), through fast photometry observations of the dwarf nova OY Car. It is not yet completely clear that the results of Spark & O’Donoghue (2015) cannot be explained by flickering in the boundary layer & inner disc, and coupled with agreement between photometric & spectroscopic parameter estimates (Savoury et al. 2012; Copperwheat et al. 2012) we feel an unobscured white dwarf is still a reasonable assumption to make.
As discussed in section 3.2, four PHL 1445 eclipses were phase-folded and averaged, with the resulting lightcurves in
u′
,g′
andr′
bands shown in Figure 2. Initial Markov chain
Monte Carlo (MCMC) fits to the u′, g′ and r′ band data
were carried out. All model parameters were left to be fit freely, apart from the white dwarf limb-darkening parameter
(Uw), which was kept fixed at an initial value of 0.345. The
reason for keepingUwfixed is because we cannot accurately
constrain this parameter with the quality of data available. The white dwarf fluxes returned from these initial model fits were then fitted - again using MCMC routines - to white dwarf atmosphere predictions (Bergeron, Wesemael & Beauchamp 1995), in order to derive initial estimates of
the temperature, loggand distance. Reddening was also
in-cluded as a parameter, in order for its uncertainty to be taken into account when determining the error in temper-ature, but is not constrained by our data. All priors used were uninformative and uniform. Systematic errors of 5% were added to the white dwarf fluxes returned by the model fitting, as the formal errors did not take into account any uncertainties in our absolute photometry.
With rough estimates of the white dwarf temperature
and loggknown, more reliableUw values could be obtained
using the data tables in Gianninas et al. (2013). Limb-darkening parameters of 0.469, 0.390 and 0.340 were
de-termined for u′
,g′
and r′
bands, respectively. The typical
value of 0.345 for Uw was replaced with these new values
and - again keeping Uw fixed - the eclipse model fits were
carried out for a second and final time.
3.4 System parameters
The mass ratio (q), white dwarf eclipse phase full-width at
half-depth (∆φ), and scaled white dwarf radius (Rw/a)
pos-terior probability distributions returned by the MCMC fits described in section 3.3 can be used along with Kepler’s third law, the system orbital period and a temperature-corrected white dwarf mass-radius relationship (Wood 1995) to cal-culate the posterior probability distributions of the system parameters (Savoury et al. 2011). These system parameters include:
(i) mass ratio,q;
(ii) white dwarf mass,Mw;
(iii) white dwarf radius,Rw;
(iv) white dwarf logg;
(v) donor mass,Md;
[image:5.612.297.555.74.616.2](vi) donor radius,Rd;
Figure 2. Model fits (red) to average PHL 1445 lightcurves (black) in r′ (top), g′ (middle) and u′ (bottom) bands. Also
shown are the different components of the model: white dwarf (dark blue), bright spot (light blue), accretion disc (green) and donor (purple). The residuals are at the bottom of each plot.
(vii) binary separation,a;
(viii) white dwarf radial velocity,Kw;
(ix) donor radial velocity,Kd;
(x) inclination,i.
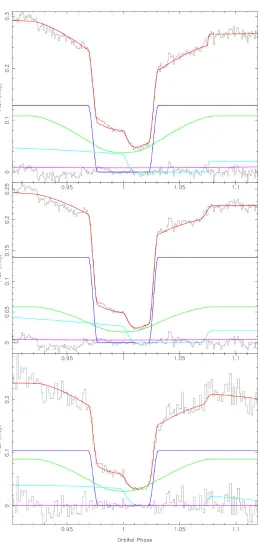
Combining the posterior probability distributions from
0.075 0.080 0.085 0.090 0.095 0.100 0.105 0.110 0.115 0.120 Mass Ratio (q)
83.0 83.5 84.0 84.5 85.0 85.5 86.0
Inclination (deg)
0.5 0.6 0.7 0.8 0.9 1.0 1.1 1.2
Mw(M⊙)
0.48 0.50 0.52 0.54 0.56 0.58 0.60 0.62 0.64
Separation (R⊙)
0.006 0.007 0.008 0.009 0.010 0.011 0.012 0.013 0.014 0.015 Rw(R⊙)
35 40 45 50 55 60
Kw(km s−1)
0.04 0.05 0.06 0.07 0.08 0.09 0.10 0.11
Md(M⊙)
420 440 460 480 500 520 540 560
Kd(km s−1)
0.095 0.100 0.105 0.110 0.115 0.120 0.125 0.130 0.135
[image:6.612.36.285.94.282.2]Rd(R⊙)
Figure 3. Normalised posterior probability density functions (black) for each parameter of the model. The red, green and blue distributions represent ther′,g′ andu′band fits, respectively.
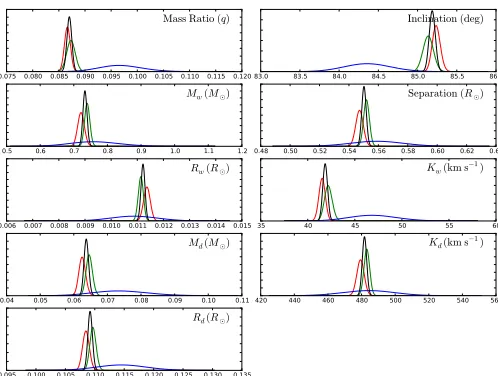
for each system parameter (Figure 3), with the peak of this distribution taken as the value of that particular system parameter. Upper and lower error bounds are derived from the 67% confidence levels. Figure 4 shows a corner plot for
theg′ band fit, which exposes degeneracies between certain
system parameters.
The system parameters were calculated twice in total.
The value for logg returned from the first calculation was
used to constrain the loggprior in a second MCMC fit
in-volving the white dwarf atmosphere predictions (Bergeron, Wesemael & Beauchamp 1995). This second MCMC fit also used white dwarf fluxes from four wavelength bands instead
of the three used previously. The additional i′
-band white dwarf flux was obtained through fitting the eclipse model to
the individuali′-band eclipse from the Sep 2012 observation
(see section 3.5 for more details on this and other individual eclipse fitting). A systematic error of 3% had to be added to
the fluxes in order to reach aχ2
of∼1, which is of the same
order as the out-of-eclipse photometric error (∼2%) and
ap-proximately half that of the error associated with flickering
(∼5%). The use of an additional bandpass and a constraint
on loggresulted in more precise values for the white dwarf
temperature and distance. This new temperature was then used to obtain a more reliable white dwarf mass-radius re-lationship, which was used in the second calculation of the system parameters.
Figure 5 shows a white dwarf colour-colour plot, con-taining both the colour of the white dwarf in PHL 1445 and models from Bergeron, Wesemael & Beauchamp (1995). As expected, there is good agreement between the colour of
the white dwarf and the temperature and loggvalues
deter-mined from fitting to these models.
The calculated system parameters can be found in Ta-ble 2. The errors in the first three columns of TaTa-ble 2 are those resulting from the MCMC fitting only, and do not ac-count for uncertainties related to the assumptions associated with the model (see Savoury et al. 2011) or those arising from the effects of flickering. Flickering affects the system parameters because it decreases the accuracy to which the
0.6 0.4 0.2 0.0 0.2 0.4 0.6 0.8 1.0
u-g 1.0
0.8 0.6 0.4 0.2 0.0 0.2 0.4 0.6 0.8
g-i
log g = 7.0
log g = 9.0
T = 7500 K
T = 9500 K
[image:6.612.300.544.95.281.2]T = 15500 K T = 20000 K
Figure 5.White dwarf colour-colour plot. The PHL 1445 white dwarf is shown by the red data point and the black lines represent white dwarf models of varying loggfrom Bergeron, Wesemael & Beauchamp (1995).
eclipse timings - especially bright spot ingress & egress - can be measured. As this particular system displays strong flick-ering, it is clear that the errors on the system parameters from the model are underestimated, even though multiple lightcurves have been averaged.
To probe the effects of flickering, four additionalg′
band average lightcurves were produced and fit with the eclipse model. Each of these new lightcurves contained a different combination of three of the four individual lightcurves used
in the originalg′band average lightcurve. The spread of
sys-tem parameters obtained from these four MCMC fits gives a more realistic idea of the errors involved; the errors in the final column of Table 2 include our estimate of the uncer-tainty introduced by flickering.
3.5 Individual lightcurve modelling
After determining various system parameters using an av-erage eclipse lightcurve, the eclipse model could now be fit to individual lightcurves (as long as they showed signs of a bright spot ingress), using the model fit parameters as a
starting point. The eclipse model parametersq, ∆φ,Rw/a
andUwdon’t vary with time, so these parameter values were
kept fixed in the individual fits.
In total there were 10 eclipses that showed signs of a bright spot ingress feature, and therefore qualified for indi-vidual MCMC fitting, including the four used in the phase-folded average fitting. All but one of these eclipses was
ob-served in the wavelength bands u′g′r′; the other in u′g′i′.
Each individual eclipse was fit in each of the three bands, with the starting model parameters depending on the band.
The onei′
-band eclipse (08 Sep 2012) was given the overall
g′-band model parameters as a starting point in the MCMC
fitting, but using an i′-band U
w value of 0.301
(Gianni-nas et al. 2013). Successful fits to bright spot ingress were
achieved for all 10 eclipses. Sinceqand ∆φwere held fixed,
and bright spot ingress/egress timings are functions ofq, ∆φ
0.720 0.735 0.750 0.765
Mw
(M
⊙
)
0.0108 0.0110 0.0112 0.0114
Rw
(R⊙
)
0.062 0.064 0.066 0.068
Md
(M
⊙
)
0.108 0.109 0.110 0.111
Rd
(R⊙
)
0.544 0.548 0.552 0.556
Se
pa
rati
on
(R⊙
)
40.8 41.6 42.4 43.2
Kw
(km
s
−
1)
480 484 488
Kd (km
s
−
1)
0.0855 0.0870 0.0885 0.0900Mass Ratio (
q)
85.00 85.15 85.30
Inclination (deg)
0.720 0.735 0.750 0.765
Mw(M⊙)
0.0108 0.0110 0.0112 0.0114
Rw(R⊙)
0.062 0.064 0.066 0.068
Md(M⊙)
0.108 0.109 0.110 0.111
Rd(R⊙)
0.544 0.548 0.552 0.556
Separation (R⊙)
40.8 41.6 42.4 43.2
Kw (km s−1)
480 484 488
Kd (km s−1)
[image:7.612.44.511.62.486.2]85.00 85.15 85.30 Inclination (deg)
Figure 4.Corner plot ofg′ band fit showing correlations of varying strengths between system parameters.
Band r′ g′ u′ Combined Sys err (%) due Final
to flickering estimates
q 0.0866±0.0006 0.0873±0.0008 0.096±0.004 0.08701±0.0005 7 0.087±0.006
Mw (M⊙) 0.722±0.010 0.740±0.008 0.76±0.08 0.733±0.006 4 0.73±0.03
Rw(R⊙) 0.01137±0.00013 0.01114±0.00010 0.0109±0.0009 0.01122±0.00008 3 0.0112±0.0003
Md(M⊙) 0.0625±0.0010 0.0646±0.0010 0.073±0.009 0.0637±0.0007 7 0.064±0.005
Rd(R⊙) 0.1085±0.0006 0.1097±0.0006 0.115±0.004 0.1092±0.0004 4 0.109±0.004
a(R⊙) 0.547±0.003 0.552±0.002 0.559±0.018 0.5502±0.0016 2 0.550±0.011
Kw(km s−1) 41.5±0.3 42.2±0.4 47±3 41.8±0.3 6 42±3 Kr(km s−1) 479±2 483.1±1.7 484±16 481.7±1.4 1 482±5
i(◦) 85.24±0.05 85.14±0.07 84.4±0.3 85.19±0.04 1 85.2±0.9
logg 8.2±0.3 8.2±0.3
Tw(K) 13200±700 13200±700
d(pc) 220±50 220±50
Table 2.System parameters for PHL 1445. The errors in the combined column are returned by the model and are purely statistical. The errors in the final column take into account the systematic error due to flickering.Twanddrepresent the temperature and distance
[image:7.612.40.553.516.661.2]Figure 6.Model fits (red) to individual PHL 1445g′-band eclipses (black). The additional coloured lines are explained in Figure 2. The
separation (Rdisc/a),Rdisc/acould be constrained for all 10
eclipses.
The individual g′-band lightcurves and corresponding
eclipse model fits are shown in Figure 6. Individual eclipse fitting should enable us to analyse how various parameters vary from eclipse to eclipse, for example disc radii and com-ponent fluxes. However, due to the strong flickering present in each lightcurve, it is important to check these fits are genuine and interpret the results with care. Looking at the individual fits in Figure 6, it is clear that not all achieve a true fit to the bright spot features (e.g. cycle numbers 5889, 14942 & 14945), and this will be taken into account in the following discussion.
The individual eclipse fitting carried out on PHL 1445
provided nine separate sets of u′
g′
r′
fluxes for the white dwarf, accretion disc and bright spot. Following section 3.4, a systematic error of 3% was added to all fluxes returned by the individual fits. There was no evidence for a varying white dwarf temperature across these nine observations.
3.5.1 Accretion disc
Individual eclipse fitting produced a value of Rdisc/a for
all 10 eclipses. This value from the model is actually the bright spot’s distance from the white dwarf as a fraction of the binary separation, but we assume the bright spot is
lying at the edge of the accretion disc. With theu′
-band fits being the least reliable due to the low quality of lightcurves,
only the ther′
, i′
- andg′
-bandRdisc/awere used. For each
eclipse, an average of the r′, i′- and g′-band R
disc/a was
plotted againstTmidto show how the disc varies with time,
as shown in Figure 7. The plot is split into two due to a sizeable time gap between observations.
The individual errors displayed in Figure 7 are from the model fits, and are dramatically underestimated due to the effects of flickering. There is a systematic error on the disc radius of approximately 10% due to flickering, and this is represented by the bar in the bottom-left corner of Figure 7. Without the introduction of this systematic error the disc changes appear to be very large, for example take the suc-cessive eclipses of 1430 and 1431. In the time of just one
orbital period (76.3 mins),Rdisc/aincreases from
approxi-mately 0.288 to 0.380, implying a disc expansion velocity
of 7200 m s−1
, which is significantly faster than the 2 m s−1
“viscous velocity” of material within the disc. As Figure 6 shows, both of these eclipses have clear bright spot ingress features. The fit to the bright spot ingress in the 1431 eclipse is far better than that in the 1430 eclipse, and this may be the real reason for the large disc radius expansion observed over this orbital cycle. The poor fit to the bright spot ingress in cycle 1430, and in many other individual eclipses (Fig-ure 6), is most likely due to the large amount of flickering, which we address with the introduction of a 10% systematic error. It must be noted that in some individual eclipses with weak bright spot features (e.g. cycle numbers 1542 & 5889) the bright spot ingress is hardly fit at all, resulting in much
more uncertain values ofRdisc/ain these cases.
The left plot in Figure 8 shows how the flux of the disc varies with disc radius. Again, the individual errors are underestimated, and the errors introduced by flickering are represented by the bars in the top-left corner of each plot. To measure the reliability of these flux changes, we again turn to
55860 55880 55900 55920 55940 55960
MJD
0.0 0.1 0.2 0.3 0.4 0.5 0.6
Rdisc / a
56100 56200 56300 56400 56500 56600 56700
0.0
0.1
0.2
0.3
0.4
0.5
[image:9.612.303.541.89.255.2]0.6
Figure 7.PHL 1445 accretion disc radius (Rdisc) as a fraction
of the binary separation (a) vs time (in MJD). Individual errors are purely statistical, and in most cases the error bars are smaller than the data points. The bar in the bottom-left corner gives an indication of the real error due to flickering. The figure is split into two due to a large gap in time (∼200 days) between observations.
the successive eclipse cycles 1430 & 1431. Here we find that
in one orbital period the disc flux increases by∼0.025 mJy,
but at the same time the white dwarf flux drops by the same amount. Such a change in white dwarf flux over one orbital cycle is not expected, and it is clear by looking at Figure 6 that a fraction of the white dwarf flux in cycle 1430 has in the following cycle been fit by the disc component instead. This may not be the case for all individual eclipse fits, but it does question the reliability of the model disc flux values. The most likely cause for this is the large amount of flickering in these individual eclipse lightcurves, which confirms the need for a large systematic error to account for it. Despite the large errors, there does appear to be a positive correlation between these two disc parameters. There is no evidence for changes in disc temperature, so the trend in Figure 8, if real, appears to be simply due to a larger disc radius resulting in a larger disc surface area and therefore flux.
3.5.2 Bright spot
The bright spot fluxes were also plotted against Rdisc/a
(see right plot in Figure 8). Unlike the disc fluxes, on the whole the bright spot fluxes appear to stay relatively stant across the different disc radii. Assuming the main con-tributor to bright spot flux is the relative velocity of the gas stream as it impacts with the disc, we modelled the gas stream and calculated its velocity relative to the disc for a
number of disc radii across the range 0.2< Rdisc/a <0.6 .
The relative velocity of the gas stream only increased by a factor of two across this range, which could explain why we see little variation in bright spot fluxes.
An attempt was also made to determine bright spot temperatures from the bright spot fluxes. The bright spot fluxes in each band from each eclipse were used to calcu-late bright spot colours, and then compared to local ther-mal equilibrium (LTE) hydrogen slab models calculated us-ing synphot iniraf. Due to the large error bars on the
varia-0.25 0.30 0.35 0.40 0.45 0.50 0.55
0.00 0.05 0.10 0.15 0.20 0.25 0.30
Disc flux (mJy)
0.25 0.30 0.35 0.40 0.45 0.50 0.55
0.00 0.02 0.04 0.06 0.08 0.10 0.12 0.14
0.25 0.30 0.35 0.40 0.45 0.50 0.55
Rdisc / a
0.00 0.05 0.10 0.15 0.20
0.25 0.30 0.35 0.40 0.45 0.50 0.55
0.00 0.02 0.04 0.06 0.08 0.10 0.12 0.14 0.16
Bright spot flux (mJy)
0.25 0.30 0.35 0.40 0.45 0.50 0.55
0.00 0.02 0.04 0.06 0.08 0.10 0.12
0.25 0.30 0.35 0.40 0.45 0.50 0.55
Rdisc / a
[image:10.612.34.547.97.300.2]0.00 0.02 0.04 0.06 0.08 0.10 0.12 0.14
Figure 8.PHL 1445 accretion disc flux (left) and bright spot flux (right) vs radius (Rdisc) as a fraction of the binary separation (a).
Red, green and blue data points representr′,g′ andu′ band observations, respectively. Individual errors are purely statistical, and in
most cases the error bars are smaller than the data points. The bars in the top-left corners of each plot give an indication of the real error due to flickering.
tions in temperature & density associated with the models, accurate bright spot temperatures could not be determined in this particular case.
4 DISCUSSION
4.1 Component masses
We find a white dwarf mass of 0.73±0.03M⊙in PHL 1445,
which is much larger than that of white dwarfs in single
and pre-CV systems (Zorotovic, Schreiber & G¨ansicke 2011;
Kepler et al. 2007), but is identical to the average white
dwarf mass in CV systems below the period gap (0.73±
0.05M⊙) found by Knigge (2006). It is however lower than
the mean white dwarf mass found by Savoury et al. (2011)
within a group of 14 short period CVs (0.81±0.04M⊙).
We expect this mass for the white dwarf in PHL 1445 to be reliable, as previous mass determinations using this method agree with those obtained through spectroscopic methods (Tulloch, Rodr´ıguez-Gil & Dhillon 2009; Savoury et al. 2012; Copperwheat et al. 2012).
As for the donor in PHL 1445, we find it has a mass of
0.064±0.005M⊙. This is just below the hydrogen burning
mass limit of∼0.075M⊙(Kumar 1963; Hayashi & Nakano
1963), which suggests it is substellar.
4.2 Flickering
One particular feature of the PHL 1445 eclipses is high am-plitude flickering. This is much larger than the flickering observed in other known CVs with substellar donors (see section 4.4), and appears to be originating from the inner accretion disc, near the white dwarf. The accretion disc and bright spot fluxes as a fraction of the white dwarf flux were
calculated inu′
, g′
andr′
, and compared with those from other CVs with substellar donors. PHL 1445’s disc fluxes are
nearly double those of the second highest disc flux system, which suggests the enhanced flickering is associated with a brighter disc.
4.3 Evolutionary state of PHL 1445
It is known that PHL 1445 consists of an accreting white dwarf and a donor star, but what is not known is the nature of this donor star. It is possible that PHL 1445 lies below the period minimum because it contains an unusual donor star, one most likely off the main sequence. We have determined a mass, radius and flux for the donor star of PHL 1445, allowing us to investigate this.
One possibility is that PHL 1445 is a Galactic halo ob-ject. A system belonging to the Galactic halo would typi-cally have a metal-poor donor star, meaning a smaller than expected radius for its mass and therefore a higher den-sity. Due to the inverse relation between density of a Roche lobe-filling donor star and the orbital period of a system, a metal-poor donor is one way for a CV system to have an orbital period below the period minimum (Patterson, Thorstensen & Knigge 2008). This was found to be the case for SDSS J150722.30+52309.8 (SDSS 1507), another CV with an orbital period (67 mins) below the minimum (Patterson, Thorstensen & Knigge 2008; Uthas et al. 2011). SDSS 1507’s halo membership is supported by both its
unusually high space velocity (167 km s−1
), calculated from its distance & proper motions by Patterson, Thorstensen & Knigge (2008) and sub-solar metallicity determined from UV spectroscopy by Uthas et al. (2011). Using our distance to PHL 1445 and proper motions listed in the PPMXL cat-alog (Roeser, Demleitner & Schilbach 2010), a transverse
velocity of 39±9 km s−1
was calculated. This is significantly lower than that for SDSS 1507, and is very close to the
average transverse velocity of 33 km s−1
Thorstensen & Knigge 2008), which is evidence against PHL 1445 being a member of the Galactic halo.
Another explanation for the short orbital period is a donor star that is already evolved at the start of mass trans-fer. One way of determining the evolutionary stage of a star is through its composition, which can be determined from its spectrum. A spectrum for PHL 1445 is shown in Wils (2009), but this isn’t useful to us as it’s dominated by the other components of the CV, not the donor. This isn’t sur-prising, as we also fail to directly detect the donor (see Fig-ure 2). Through model fitting we do obtain an upper limit for the donor flux, which is actually a measure of the total un-eclipsed flux from the system.
Thorstensen et al. (2002) show that an evolved donor
with a central hydrogen abundance ofXc= 0.05, in a system
with PHL 1445’s orbital period should have a temperature in excess of 4000 K, while Podsiadlowski, Han & Rappaport
(2003) show an Xc = 0.1 evolved donor in a similar
sys-tem to have a sys-temperature somewhere between 1500-2000K. Through knowledge of PHL 1445’s donor angular diameter and flux from the eclipse model, we are able to rule out a 4000 K donor, but do find some agreement with a 1500-2000 K donor.
g′-r′ colours were estimated for both a 4000 K and
1800 K donor. The colour for the 4000 K donor was found
through the linear relation betweenTeff andg′-r′(Fukugita
et al. 2011), but this relation doesn’t extend to below
∼3800 K so semi-empirical model isochrones had to be used
in order to obtain a colour for the 1800 K donor (Baraffe et al. 1998; Allard, Homeier & Freytag 2011; Bell et al. 2014).
From these colours,r′-band zero-magnitude angular
diame-ters were calculated and used together with the donor
angu-lar diameter to produce an apparent r′-band donor
magni-tude at each temperature (Boyajian, van Belle & von Braun 2014). It must be noted that the colour obtained for the 1800 K donor lies outside the valid range given by Boyajian, van Belle & von Braun (2014) for their magnitude-angular diameter relation.
Donor fluxes of (15.9±1.1)×10−2
mJy & (0.33±
0.18)×10−2
mJy were calculated for 4000 K & 1800 K, re-spectively. The 4000 K donor is approximately 13 times the
(1.27±0.08)×10−2mJy upper limit for ther′-band donor
flux from the eclipse model, while the 1800 K donor flux is approximately 4 times smaller. Analysis of the donor flux
hence shows that a slightly evolved donor (Xc = 0.1)
can-not be ruled out for PHL 1445, and may be the reason for its unusually short orbital period.
PHL 1445 could also lie below the period minimum be-cause it formed directly with a brown dwarf donor. These systems can start out with periods much shorter than the period minimum, but evolve towards longer orbital periods like post-period bounce CVs (Kolb & Baraffe 1999). We in-vestigate whether PHL 1445 could have formed with a brown dwarf donor by studying the relation between donor mass and orbital period (see Figure 9). Figure 9 shows a number of different evolutionary tracks. The red track is from Knigge, Baraffe & Patterson (2011) and represents a CV with a main sequence donor. These CVs evolve from longer periods to shorter ones until the period minimum (vertical dashed line) is reached, at which point the track inverts and heads back to longer periods. The green track is from Thorstensen et al. (2002) and represents a system containing an evolved donor
withXc = 0.05. Above we rule out the possibility of such
a highly-evolved donor, and this is supported by the fact that the PHL 1445 data point lies comfortably below this line. The solid blue line is from Kolb & Baraffe (1999) and represents a system that formed with a brown dwarf donor. It would appear that the PHL 1445 data point lies far from this track, but this track is computed from an old model, using a gravitational-radiation (GR) based angular momen-tum loss rate and ignoring deformation of the donor. Knigge, Baraffe & Patterson (2011) showed that tracks with these
assumptions cannot fit the observed locus of CVs in theMd
vsPorb diagram, and that models which include
deforma-tion and an angular momentum loss rate of 2.47xGR are required. The main sequence donor track (red) in Figure 9 takes into account both a 2.47xGR angular momentum loss rate and deformation (Renvoiz´e et al. 2002), and for the ad-ditional brown dwarf donor tracks (blue: dashed, dot-dashed and dotted) we have done the same. All three of these tracks
have been calculated from a model containing a 0.75M⊙
primary and a donor of initial mass 0.07M⊙, with an
addi-tional variable parameter being the age of the donor at start
of mass transfer (tinit). This is an important parameter with
regards to understanding the subsequent evolution of such a system, since a substellar object has a time-dependent ra-dius. The dashed, dot-dashed and dotted blue lines represent
tinit’s of 2 Gyr, 1 Gyr and 600 Myr respectively. The latter of
these tracks - with atinitof 600 Myr - is consistent with the
PHL 1445 data point, but how feasible is such a proposed system?
In order for mass transfer to start so early in the sys-tem’s lifetime, the primary star must have evolved off the main sequence very quickly to leave a white dwarf ready for mass transfer. This puts a lower limit on the initial primary
mass of 2.8M⊙ (Girardi et al. 2000). Considering the
sec-ondary has an initial mass no greater than 0.07M⊙, this
would mean an initial mass ratio of approximately 0.025 or less. This is extremely low, and main sequence star/brown dwarf binaries with extreme mass ratios are rare, but it would seem they are able to form (Grether & Lineweaver 2006). Binaries with such low mass ratios have been ob-served, for example HIP 77900B, which has a mass ratio as low as 0.005 (Aller et al. 2013), although its separation is also extreme at 3200 AU. There is also observational evi-dence for binaries with A-type star primaries to have a bias towards low mass ratios of less than 0.1 (Kouwenhoven et al. 2005). It is thus a possibility that PHL 1445 formed directly from a binary system with a very low mass ratio containing
a>2.8M⊙primary and brown dwarf secondary.
4.4 PHL 1445: a possible period-bouncer?
Another CV, SDSS J143317.78+101123.3 (SDSS 1433) has also been found to host a substellar donor (Littlefair et al. 2008; Savoury et al. 2011). SDSS 1433 - with an orbital
period of 78.1 mins and donor mass of 0.0571±0.0007M⊙
- was claimed to be a post-period bounce system by both Littlefair et al. (2008) and Savoury et al. (2011). Current
estimates now place the period minimum at 81.8±0.9 min
(Knigge, Baraffe & Patterson 2011), suggesting that SDSS 1433 may not, in fact, be a period bouncer.
1.0 1.1 1.2 1.3 1.4 1.5 1.6 1.7
Porb (hrs) 0.00
0.02 0.04 0.06 0.08 0.10 0.12
Md
(
M⊙
)
PHL 1445
SDSS 1433 SDSS 1507
[image:12.612.104.481.86.347.2]SDSS 1035
Figure 9.Donor mass (Md) vs orbital period (Porb) for PHL 1445 and other substellar donor CVs: SDSS 1433, SDSS 1035 & SDSS
1507 (Savoury et al. 2011). Also plotted are a number of evolutionary tracks: main sequence donor (red line; Knigge, Baraffe & Patterson 2011), evolved donor withXc= 0.05 (green line; Thorstensen et al. 2002) and brown dwarf donor (solid blue line; Kolb & Baraffe 1999).
The three additional blue lines also show tracks for brown dwarf donors but with modified physics and varying donor age at start of mass transfer (tinit). The dashed, dot-dashed and dotted blue lines representtinit’s of 2 Gyr, 1 Gyr and 600 Myr, respectively. The vertical
dashed black line represents the location of the CV period minimum determined by Knigge, Baraffe & Patterson (2011), with the shaded area representing the error on this value. The bar across the top of the plot shows the FWHM of the CV period spike observed by G¨ansicke et al. (2009).
formed with a brown dwarf donor. This is supported by
plotting SDSS 1443 on the same Md vs Porb diagram as
PHL 1445 (see Figure 9). SDSS 1433 also appears to lie on the evolutionary track associated with a brown dwarf donor of age 600 Myr at start of mass transfer, and therefore may have had a progenitor system with the same, extremely low mass ratio as that of PHL 1445. The chances of finding two systems with such similar, extreme initial mass ratios should be very low, so the fact we do raises some suspicion.
There are currently only four CV systems that have been found to contain substellar donors: PHL 1445, SDSS 1433, SDSS 1507 and SDSS J103533.03+055158.4 (SDSS 1035) (Littlefair et al. 2008; Savoury et al. 2011). SDSS 1507 was mentioned in the previous section, and lies below the pe-riod minimum due to being a member of the Galactic halo. SDSS 1035 has an orbital period slightly above the period minimum (82.1 min, Savoury et al. 2011), and is thought to be a period-bouncer. So out of a sample of just four systems known to contain substellar donors, 50% of them may have formed with a brown dwarf donor, and in progenitor systems with a similar mass ratio.
This does not fit with the observation of a “brown dwarf desert” (Duquennoy & Mayor 1991; Marcy & Butler 2000; Grether & Lineweaver 2006), the lack of brown dwarfs ob-served in binaries with main sequence primaries and
separa-tions <3 AU. The link between the “brown dwarf desert”
and CVs formed with brown dwarf secondaries is made by Politano (2004). Through population synthesis, Politano
(2004) find that the majority of progenitors of zero age CVs with brown dwarf secondaries have orbital separations and primary masses that coincide with this “desert”, explaining the dearth of CVs with substellar donors and periods below the period minimum.
The “desert” is not completely arid, however, and a number of such systems do exist (Duchˆene & Kraus 2013). Taking all of this into consideration, we would expect to see significantly more post period-bounce systems than those formed directly with a brown dwarf donor, not the equal numbers found. This may be due to an observational bias against period-bounce CVs, but it is unclear what would cause this. It is therefore unlikely that PHL 1445 and SDSS 1433 are systems that formed with a brown dwarf donor, which opens up the possibility that both may actually be normal CVs, lying within the intrinsic scatter of the period minimum.
The current period minimum at 81.8±0.9 min
(ver-tical dashed line in Figure 9) was determined by Knigge, Baraffe & Patterson (2011) through fitting a semi-empirical donor-based CV evolution track (red track in Figure 9) to the masses of a sample of CV donors. This sample of donors
contains an intrinsic dispersion ofσint= 0.02 dex (Knigge,
Baraffe & Patterson 2011), introducing an intrinsic scatter around the period minimum of equal value. This is
equiva-lent to an intrinsic dispersion ofσint= 3.7 min, significantly
to the∼20% dispersion in white dwarf masses of the
sam-ple (Knigge 2006). The majority of the remaining error can probably be attributed to a distribution in mass-loss rates, associated with residual magnetic braking below the CV pe-riod gap. This residual magnetic braking may explain why Knigge, Baraffe & Patterson (2011) require additional angu-lar momentum loss below the period gap in order to produce a CV evolution track that is in agreement with the donor sample.
An independent measure of the intrinsic scatter can be
obtained from the “period spike” analysis in G¨ansicke et al.
(2009). The position of the period spike at 82.4±0.7 min is
a good match to the period minimum from Knigge, Baraffe
& Patterson (2011), and G¨ansicke et al. (2009) - assuming
a Gaussian distribution - find a FWHM of 5.7 min for this feature (see Figure 9). The intrinsic scatter on the period
spike is therefore σint = 2.4 min. Using σint of the period
spike from G¨ansicke et al. (2009) as the dispersion of systems
around the period minimum, PHL 1445 and SDSS 1433 turn
out to be 2.3σand 1.5σoutliers, respectively.
In the sample of short period eclipsing CV systems in Savoury et al. (2011), four systems have periods between 80 - 86 mins, making them period spike systems according to
G¨ansicke et al. (2009). Assuming PHL 1445 and SDSS 1433
are also systems near the period minimum brings the total to six. We must also assume here that no selection biases were involved with Savoury et al. (2011) choosing systems for model fitting. If CVs are distributed around a period minimum of 81.8 min, with an intrinsic scatter of 2.4 min, then the chances of finding these two outlying systems in such a small sample are approximately 6%. This confirms the seemingly unlikely occurrence of finding two period min-imum systems with periods as short as SDSS 1433 and PHL 1445, if the existing estimates for the position of the period
minimum andσintare correct.
It may be that the intrinsic scatter around the period minimum is underestimated, or that the position of the pe-riod minimum is incorrect. Being able to join the three sub-stellar donor systems, PHL 1445, SDSS 1433 and SDSS 1035 with a single evolutionary track in Figure 9 would provide evidence for the latter of these two possibilities, as this would suggest all three are period minimum systems that are of similar nature but just at different evolutionary stages. This would involve tweaking the parameters of the evolutionary model (e.g. angular momentum loss) and is beyond the scope of this paper, but the results would be of interest.
5 CONCLUSIONS
We have presented high-speed, three-colour photometry of the short-period eclipsing dwarf nova PHL 1445. Four eclipses were averaged to overcome the presence of flickering, making bright spot features visible and therefore enabling the determination of system parameters through eclipse model fitting. These system parameters include mass ratio
q = 0.087±0.006, orbital inclination i = 85.2±0.9◦,
pri-mary mass Mw = 0.73±0.03M⊙ and donor mass Md =
0.064±0.005M⊙, amongst others. The white dwarf
temper-atureTw = 13200±700 K and photometric distance to the
systemd= 220±50 pc were also found through multi-colour
white dwarf flux fitting to model-atmosphere predictions.
We considered a number of possible reasons for PHL 1445 having an orbital period below the period minimum and determined their plausibility. PHL 1445’s small proper motion does not make Galactic halo membership likely.
Analysis of the donor’s r′-band flux was used to rule out
a significantly evolved donor, but one that is only slightly
evolved (Xc = 0.1) remains a possibility. Formation with
a brown dwarf donor cannot be ruled out; although the brown dwarf would have to be older than 600 Myrs at start of mass transfer, which requires a progenitor system with an
extremely low mass ratio ofq= 0.025. Both PHL 1445 and
SDSS 1433 - another CV with a substellar donor - lie below the period minimum for CVs, and their frequency may be evidence for error in the estimates for the intrinsic scatter and/or position of the period minimum.
6 ACKNOWLEDGEMENTS
MJM acknowledges the support of a UK Science and Technology Facilities Council (STFC) funded PhD. SPL, VSD and ULTRACAM are supported by STFC grant ST/J001589/1. TRM and EB are supported by STFC grant ST/L000733/1. SGP acknowledges financial support from FONDECYT in the form of grant number 3140585. The re-sults presented in this paper are based on observations made with the William Herschel Telescope operated on the island of La Palma by the Isaac Newton Group in the Spanish Observatorio del Roque de Los Muchachos of the Instituto de Astrof´ısica de Canarias. This research has made use of NASA’s Astrophysics Data System Bibliographic Services.
REFERENCES
Allard F., Homeier D., Freytag B., 2011, in Astronomical Society of the Pacific Conference Series, Vol. 448, 16th Cambridge Workshop on Cool Stars, Stellar Systems, and the Sun, Johns-Krull C., Browning M. K., West A. A., eds., p. 91
Aller K. M. et al., 2013, ApJ, 773, 63
Baraffe I., Chabrier G., Allard F., Hauschildt P. H., 1998, A&A, 337, 403
Bell C. P. M., Rees J. M., Naylor T., Mayne N. J., Jeffries R. D., Mamajek E. E., Rowe J., 2014, MNRAS, 445, 3496 Berger J., Fringant A.-M., 1984, A&AS, 58, 565
Bergeron P., Wesemael F., Beauchamp A., 1995, PASP, 107, 1047
Boyajian T. S., van Belle G., von Braun K., 2014, AJ, 147, 47
Copperwheat C. M. et al., 2012, MNRAS, 421, 149 Dhillon V. S. et al., 2007, MNRAS, 378, 825 Duchˆene G., Kraus A., 2013, ARA&A, 51, 269 Duquennoy A., Mayor M., 1991, A&A, 248, 485
Feline W. J., Dhillon V. S., Marsh T. R., Stevenson M. J., Watson C. A., Brinkworth C. S., 2004, MNRAS, 347, 1173 Fukugita M., Yasuda N., Doi M., Gunn J. E., York D. G.,
2011, AJ, 141, 47
G¨ansicke B. T. et al., 2009, MNRAS, 397, 2170
Girardi L., Bressan A., Bertelli G., Chiosi C., 2000, A&AS, 141, 371
Grether D., Lineweaver C. H., 2006, ApJ, 640, 1051 Haro G., Luyten W. J., 1962, Boletin de los Observatorios
Tonantzintla y Tacubaya, 3, 37
Hayashi C., Nakano T., 1963, Progress of Theoretical Physics, 30, 460
Hellier C., 2001, Cataclysmic Variable Stars: How and Why they Vary. Springer-Praxis, New York
Kepler S. O., Kleinman S. J., Nitta A., Koester D., Cas-tanheira B. G., Giovannini O., Costa A. F. M., Althaus L., 2007, MNRAS, 375, 1315
Knigge C., 2006, MNRAS, 373, 484
Knigge C., Baraffe I., Patterson J., 2011, ApJS, 194, 28 Kolb U., Baraffe I., 1999, MNRAS, 309, 1034
Kouwenhoven M. B. N., Brown A. G. A., Zinnecker H., Kaper L., Portegies Zwart S. F., 2005, A&A, 430, 137 Kumar S. S., 1963, ApJ, 137, 1121
Littlefair S. P., Dhillon V. S., Marsh T. R., G¨ansicke B. T.,
Baraffe I., Watson C. A., 2007, MNRAS, 381, 827
Littlefair S. P., Dhillon V. S., Marsh T. R., G¨ansicke B. T.,
Southworth J., Baraffe I., Watson C. A., Copperwheat C., 2008, MNRAS, 388, 1582
Marcy G. W., Butler R. P., 2000, PASP, 112, 137
Patterson J., Thorstensen J. R., Knigge C., 2008, PASP, 120, 510
Podsiadlowski P., Han Z., Rappaport S., 2003, MNRAS, 340, 1214
Politano M., 2004, ApJ, 604, 817
Press W. H., Teukolsky S. A., Vetterling W. T., Flannery B. P., 2007, Numerical Recipes: The Art of Scientific Com-puting (Third Edition). Cambridge University Press, New York
Renvoiz´e V., Baraffe I., Kolb U., Ritter H., 2002, A&A, 389, 485
Roeser S., Demleitner M., Schilbach E., 2010, AJ, 139, 2440 Savoury C. D. J. et al., 2011, MNRAS, 415, 2025
Savoury C. D. J., Littlefair S. P., Marsh T. R., Dhillon V. S., Parsons S. G., Copperwheat C. M., Steeghs D., 2012, MNRAS, 422, 469
Smith J. A. et al., 2002, AJ, 123, 2121
Spark M. K., O’Donoghue D., 2015, MNRAS, 449, 175 Thorstensen J. R., Fenton W. H., Patterson J., Kemp J.,
Halpern J., Baraffe I., 2002, PASP, 114, 1117
Tulloch S. M., Rodr´ıguez-Gil P., Dhillon V. S., 2009, MN-RAS, 397, L82
Uthas H., Knigge C., Long K. S., Patterson J., Thorstensen J., 2011, MNRAS, 414, L85
Wils P., 2009, Information Bulletin on Variable Stars, 5916, 1
Wils P., Krajci T., Hambsch F.-J., Muyllaert E., 2011, In-formation Bulletin on Variable Stars, 5982, 1
Wood J., Horne K., Berriman G., Wade R., O’Donoghue D., Warner B., 1986, MNRAS, 219, 629
Wood M. A., 1995, in Lecture Notes in Physics, Berlin Springer Verlag, Vol. 443, White Dwarfs, Koester D., Werner K., eds., p. 41
Zorotovic M., Schreiber M. R., G¨ansicke B. T., 2011, A&A,