DEVELOPMENT OF THE PROJECTION
FROM THE EYE TO THE SUPERIOR
COLLICULUS IN THE TAMMAR WALLABY
(Macropus eugenii)
BY
DING, YUCHUAN (M.Sc.,
B. Med.)
A Thesis Submitted For The Degree Of Doctor Of Philosopy
Of
The Australian National University
Canberra, Australia
TABLE OF CONTENTS
1 V VI VII XI l Contents Declaration Acknowledgements Abstract AbbreviationsPublications inside back cover
Chapter 1: Introduction General Overview
Life Of Marsupial Wallaby
Origin and distribution of marsupials Marsupials as typical mammals Reproductive method of marsupials Growth and development of the tammar Primary Visual Pathway In Marsupial Mammals
Cellular structure of the retina Ganglion cell layer
Optic nerve
Anatomy of the superior colliculus
Topography of retinocollicular projections Outline of the project and the methods used
Chapter 2: Time Course Of Initial Development
Of The Retinal Projection To The Superior Colliculus Introduction
Materials And Methods Animals
Results
HRP injections
l l
10-12 days 30
14-16 days 31
18 days 32
20-23 days 32
26-29 days 33
35 days 33
39 days 34
46 days 34
Discussion 35
Development of the distribution of retinal axons
in the contralateral SC 35
The development of the retinocollicular projection
on the ipsilateral side 36
The consideration of techniques between the
autoradiography and the HRP 37
Comparison with other mammals 38
Early development of the retinotectal projection
in non-mammalian vertebrates 40
Summary 42
Chapter 3: The Sequence Of Axon Outgrowth From
The Developing Retina To The Superior Colliculus 44
Introduction 44
Materials And Methods 46
Animals 46
Dil placement 47
Histology 47
Analysis 48
Results 50
4-5 days 51
8-9 days 52
11-15 days 52
16-18 days 53
26-36 days 55
41-46 days 56
Discussion 58
Technical considerations 58
The extension of retinal ganglion cells projecting
l l l Establishment of the distribution pattern of ganglion cells
with crossed and uncrossed axons in other species 64 Possible mechanisms to establish the
distribution of contralaterally and ipsilaterally projecting ganglion cells
Summary
Chapter 4: The Development Of Topography In The Retinal Projection To The Superior Colliculus Introduction
Materials And Methods
Animals Labelling axons Histology Analysis Results Discussion
DiI placement in the retina
Developing organization of the retinal projection in the SC
Quantification of DiI deposits in the retinal and labelled axons and terminal zones in the SC
A two stage process in the development of the marsupial mammalian retinocollicular projection
Technical consideration
Comparison with previous work in the wallaby Projection to the ipsilateral SC
Formation of terminal zones
The possible mechanisms controlling the formation of
67 69 71 71 75 75 76 77 78 79 80 81 95 97 97 98 100 103 104
retinotopic projections to the SC in the wallaby 106 Evidence for mammalian ties between marsupial
mammals and placental mammals 112
Comparison with the development of the retinotectal
projection in non-mammalian vertebrates 116
Summary 119
Chapter 5: Retinotopic Organization In The Optic Nerve During Development
Introduction
Materials And Methods
120
120
iv
Animals 126
Labelling axons 126
Histology 126
Analysis 127
Results 128
Dil labelling in the retina 128
Order and distribution of labelling in the optic nerve 128 Quantitative data of Dil deposit in the retina
and the distribution of labelled axons in the optic nerve 134
Discussion 136
Summary
Order in the developing optic nerve and the correlation with retinotopy in the SC
Retinotopy in other mammalian optic nerve in relation to formation of the visual map
Chapter 6: General Conclusion
Literature Cited
136
139 142
143
V
Declaration
I declare here that all material in this thesis has not been submitted previously for a degree in any university and I believe that any material previously published or written by other persons is indicated by due reference in the text. This work was supported by an Australian National University Ph.D Scholarship and a Tuition Fee Scholarship.
vi
Acknowledgements
First of all, I would like to give my most sincere thanks to Professor R.F. Mark, for being the best supervisor one could ask for, who allowed me access to the specific project working on the tammar wallaby and always gave me very helpful and friendly supervision.
I also wish to extend my many smcere thanks particularly to my supervisor, Dr L.R. Marotte for teaching me all the techniques which I used in the Ph.D. project and for the excellent help in all other aspects to produce this thesis. It would have been impossible for me to submit my Ph.D thesis successfully without her support and advice.
I am very grateful to Dr I.A. Hendry for his thoughtful suggestions on the preparation for the thesis.
Many thanks of mine are also given to Ms A. Devlin, Mr K. Williams for care and supply of pouch young wallabies, Ms M. Porter for her histological assistance and thoughtful reading of the thesis, and Mrs M. Donohue for her assistance in word processing.
vii
Abstract
This thesis describes four studies on the development of the retinocollicular projection in the marsupial mammal, the tammar wallaby (Macropus eugenii).
(1). The time course of initial development of the retinal projection to the superior colliculus (SC). The anterograde tracer horseradish peroxidase (HRP) was injected into the eye in vivo in animals of various
ages starting on the day of birth, to label retinal axons.
(2). The sequence of axon outgrowth from the developing retina to the
SC. The fluorescent lipophilic carbocyanine dye, 1,l'-dioctodecyl-3,3,3',3'-tetramethylindocarbocyanine perchlorate (DiI), was placed into the rostral SC in vitro in animals of various ages starting from 4 days after birth to retrogradely label ganglion cells projecting to the SC. The positions of labelled ganglion cells in wholemounts of the retina were recorded by a NeuroTrace computer system.
(3). The development of topography in the retinal projection to the SC. A
viii
(4). Retinotopic organization in the optic nerve during development. The optic nerves of animals used in (3) were examined and the position of labelled axons mapped.
The timing and sequence of events leading to the formation of the retinocollicular projection across the entire surface of the SC was established. At 4 days after birth, the first axons from the retina reach the contralateral SC at the rostrolateral border, and subsequently they spread caudally and medially over the SC. By 18 days, the axons reach the caudal pole and reach the medial border along most of the rostro-caudal extent except for the far rostro-caudal pole by 26 days. On the ipsilateral side, the first axons reach the rostrolateral edge of the SC at 5 days. They then spread over the SC also in a caudomedial direction and cover the rostrolateral part of the SC prior to 46 days. At 46 days after birth, the retinal projection covers the whole SC both contralaterally and ipsilaterally.
unchanged. The ipsilaterally projecting ganglion cells are located initially in the central dorsal retina at 4-5 days and are then distributed diffusely over the retina up to 15 days. At 16 days, the beginning of the adult pattern is first seen, in which the ganglion cells become primarily restricted to the periphery of the temporoventral retina. The results suggests that the retinal projection, at least to the contralateral SC, may be topographically organized as it grows into the SC.
The degree of retinotopic organization in the contralateral and ipsilateral SC was investigated in more detail. From 8 to 40 days, developing retinal axons are distributed in a coarse topographic order. Beginning at 41 days, axons from the temporal retina begin to form their terminal arborizations in the correct topographic area in the rostral SC. From 52-55 day, axons from all retinal quadrants form their terminals in the topographically appropriate region although the more widely distributed labelled axons are still prominent. From 61-68 days, clearly defined terminal zones appear with the loss of more widely distributed axons. At 90-95 days, discrete terminals are present.
A similar coarse retinotopic order in the optic nerve was demonstrated at all stages of development. Temporal axons remain on the corresponding side of the optic nerve laterally and the nasal axons on the medial side. An inversion of axons from dorsal and ventral retina occurs. The axons gradually migrate from the corresponding dorsal and ventral regions towards the opposite side of the optic nerve. The order in the optic nerve may be sufficient to generate initially the coarse retinotopy of collicular innervation from dorsal and ventral retina, since the dorsal and ventral axons reverse their initial position in the optic nerve to enter the SC in the lateral and medial optic tract, respectively.
However, it can not explain the final retinotopy of synaptic connections between the optic nerve fibres and collicular neurons.
X
xi
Abbreviations
Dil l,1'-dioctodecyl-3,3,3',3'-tetramethylindocarbocyanine perchlorate (DiI)
cILGN
dorsal lateral geniculate nucleusHRP
horseradish peroxidaseLGN
lateral geniculate nucleusNMDA
N-methyl-D-aspartateSAi
stratum album intermediumSAP
stratum album profundumSC
superior colliculusSGI
stratum griseum intermediumSGP
stratum griseum profundumSGS
stratum griseum superficialeso
stratum opticumsz
stratum zonaleTMB
tetramethylbenzidine1
Chapter 1. Introduction
GENERAL OVERVIEW
Wonder at the complexity of nature reaches its maximum when we consider the working of the brain. With this unlikely looking organ an animal plans its movements, decides on strategies of behaviour, regulates
its internal to external environment, so as to adapt itself to the world
around it.
Like other organs, the brain consists of relatively few basic cell types, neurons and three distinct class of supporting neuroglial cells. A
fundamental characteristic of brain architecture, however, is that each of
the more than 1010 neurons making up a mammalian brain has a distinctive function (Lund, '78). This function is determined not only by what class of neuron it is but also by its specific spatial distribution. The
spatial distribution of specific neurons enables the individual neuron to
receive a mass of information from a restricted and unique set of sources, and then transmit to another select group of cells. Specific connections are
formed from the spatial interrelation of two interconnected regions and the topographic map of one region is delivered to the next.
The cellular organization and pattern of synaptic connections in the adult
brain is the end result of an enormous number of changes having occurred
during development. The processes responsible for the elaboration of the
2
which the organization and function of the adult brain is achieved has come to occupy a central position in neurobiological studies.
In attempts to elucidate the mechanisms controlling the formation of orderly nerve patterns, the visual system has proved to be most fruitful. Lund ('78) has summarized a number of reasons to demonstrate that the visual system is especially suitable for developmental studies. (1) the various parts are well circumscribed; (2) a map of the visual world is maintained in the visual areas of the brain, and this can be modified experimentally; (3) there is a considerable degree of dynamic interaction between its various components; (4) the eye is uniquely accessible to experimental manipulation that does not directly involve the rest of the central nervous system; and (5) the visual image can be more readily controlled than almost any other sensory stimulus.
E th
u ena
.
~
:~:ates(pl
acenta
1
s
Primitive: rodents.
· ··· ·· Amen can opossum
Th ·
erla
{
ative "cats"135 Polyprotodonta . .
(C armvorous . ) Tasmanian devil
Metatheria
(Marsupials)
128
Peramelids
-(Herbivorous)
Australian bandicoots
Wallaby
[image:16.647.31.637.20.802.2]Koala Possum
3
the projection from the eye to the superior colliculus and was carried out in wallaby (Macropus eugenii).
LIFE OF MARSUPIAL WALLABY
Some important information on the life of the wallaby used in the present
study as an experimental animal is set out below.
Origin and distribution of marsupials
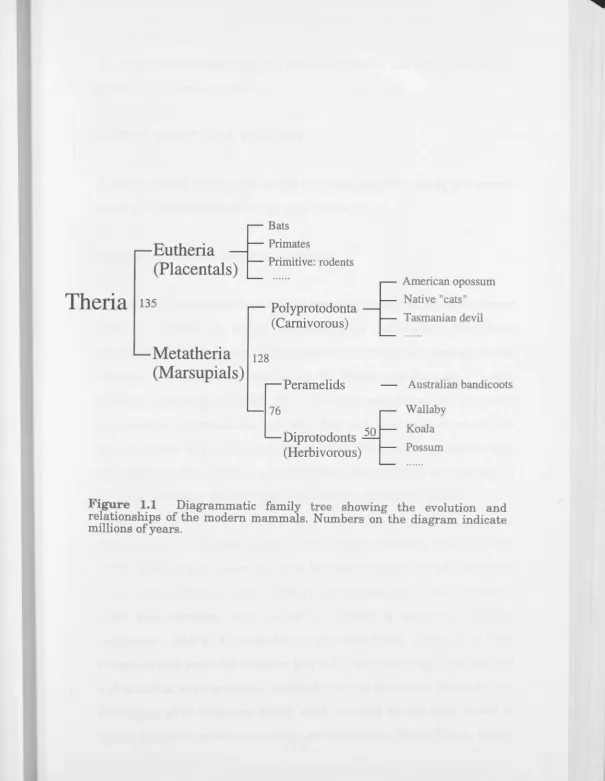
All modern mammals belong to the subclass of the Theria, which separated into two groups of higher mammals, the infraclasses Metatheria
(Marsupials) and Eutheria (Placentals) some 135 million years ago in the Cretaceous (Fig.1.1) (Tyndale-Biscoe, '73; Romer and Parsons, '77). The
pouched mammals comprise the infraclass metatheria. In the order marsupialia, the young are born at a tiny and immature stage and the mother carries on her belly a pouch in which the newborn young are kept and nurtured for a further period of development. Male marsupials are normally pouchless and play little or no part in rearing the young.
Marsupials are currently found in two widely separated reg:1.0ns of the world, America and Australia. South America has been proved a haven for many marsupials during the Tertiary period some 65 million years ago, when that continent was isolated. A variety of marsupials (mainly
4
and feed mainly on insects (Stonehouse and Gilmore, '77). The American marsupials belong exclusively to the polyprotodont radiation.
Marsupials in Australia have elaborated considerably. By the Cretaceous this continent was separated from the rest of the world's land-masses and remained isolated. Few placental mammals had reached Australia at the
time of separation and none have been able to reach it after, such that the marsupials had little opposition there. They expanded and diversified to fill almost every type of adaptive niche. The Australian metatherian (marsupial) mammals are classified in three orders, polyprotodonts, diprotodonts and peramelida. Polyprotodont marsupials include such pouched carnivorous forms as the native "cats" and the Tasmanian devil, the "native wolf', as well as many smaller insectivorous species such as the Dasywida. Diprotodonta with chisel-like front teeth are mainly herbivorous. Peramelida, intermediate between polyprotodonts and diprotodonts, include the Australian bandicoots (Romer and Parsons, '77).
Macropodidae, the most advanced super family are derived from the suborder Diprotodonta. There are 56 living species at least in this group alone, and they are exemplified by the tammar wallaby (Macropus eugenii) (Kirsch and Calaby, '77).
Marsupials as typical mammals
5
neuroanatomy are so similar to those found in characteristic placental mammals that they can not be distinguished on histological grounds. There are differences within the marsupials, particularly between the more primitive ones such as American opossum and the advanced Australian diprotodonts such as tammar wallaby, but the differences between members of the placental and marsupial groups are in general no bigger than variations within either one. Parallels in the organization of the pyramidal tract, the auditory cortex, the visual thalamus, the somatosensory thalamus and visual cortex have been proved by electrophysiological experiments (Mark and Marotte, '92).
Reproductive method of marsupials
Marsupials, in most respects typical mammals, differ importantly from the placentals only in the method of reproduction, the most obvious being a short intra-uterine gestation followed by a protracted development in the pouch, outside of the mother's body. During the time in the pouch, the young are attached to teats of the abdominal mammary gland, nurtured by the mother's milk instead of a placental circulation. Neonatal marsupials, such as tammar wallaby, are born at less than 0.01 % of the mother's weight and for the most part at a very early stage of development. Their physiological systems including the visual pathway develop during ensuing lengthy lactation (Tyndale-Biscoe and Janssens, '88). This slower maturation, nevertheless, follows the same sequence of developing organs, compared with most common placental laboratory mammals such as the rodent.
6
breeding animals, with the first birth usually occurring in February and continuing to July. Embryonic diapause, in which development is suspended and can not be resumed even in the presence of apparently favourable conditions, is associated with a corpus luteum that is tonically suppressed by the pituitary, mediated by prolactin (Hearn, '73, '74). Two reproductive states have been termed lactational and seasonal quiescence (Tyndale-Biscoe et al., '74). During lactational quiescence from January or February to June in the Southern Hemisphere the corpus luteum is suppressed by sucking of the pouch young; removal of the young or denervation of the sucked gland will lead to reactivation. Females carrying a diapausing blastocyst will give birth and come into oestrus 26 to 28 days later (Renfree and Tyndale-Biscoe, '78; Renfree, '79; Merchant, '79). In seasonal quiescence from July to December, removal of the pouch young
will not lead to reactivation of the dormant blastocyst. The dopamine agonist bromocriptine is known to depress the circulating level of prolactin
in all species of mammals. Injection of 5 mg/kg wt of bromocriptine (Sandoz, Australia) early in seasonal quiescence will reverse this inhibition to the development of the corpus luteum. The embryo reactivates and birth of pouch young occur 26 to 28 days later (Tyndale-Biscoe and Hinds, '84). This feature of reproduction whereby the dormant blastocyst may be reactivated is particularly favourable to the early developmental studies
since the harvesting of pouch young can be controlled on schedule.
Growth and development of the tammar
7
al., '82). At about 140 days, the eyes open. By 160 days, the young is able to stand unaided and the pelage is thickening. At 180 days the young puts its head out of the pouch and nibbles grass. It is able to make its first excurs10n from the pouch at about 190 days. The young still needs to return to the mother to suckle for several more weeks until 250 days when it leaves the pouch permanently. It is then known as a runner.
PRIMARY VISUAL PATHWAY IN MARSUPIAL MAMMALS
The primary visual pathway in mammalian vertebrates is a part of the central nervous system. Organization of the visual system in marsupial mammals conforms to a plan which is essentially similar to that seen in placental mammals (for review see Mann, '64; Dowling, '70; Rodieck, '73; Johnson, '77; Lund, '78; Dunlop et al., '88; Mark and Marotte, '92). The visual system includes the retina, optic nerve, optic chiasm, optic tract, superior colliculus, lateral geniculate nucleus and visual cortex. The visual image is received in the retina, and transmitted through the optic nerve which comprises axons from retinal ganglion cells that converge at the optic disc to form the nerve. The optic nerve runs to the chiasm on the ventral surface of the forebrain. In the chiasm, some of the optic fibres from the retina of each eye cross the midline decussation and intermingle with axons from the other eye, while others remain on the same side. The degree of the decussation of fibres at the chiasm is probably related to the extent of binocular overlap depending on the placement of the eyes frontally or laterally in different species. Fibres crossed and uncrossed at the chiasm form the optic tract terminating in the primary visual centres.
8
various pre-tectal and accessory optic nuclei. The dLGN displays a feature
of mammals, in which there is a pronounced lamination of cells and fibres
with its separated eye-specific bands. Cells in the dLGN send axons to the
visual cortex, which end in different layers of the cortex, primarily in layer
IV.
Tracing the axons of retinal ganglion cells from their receptive fields in the
retina to the primary target, the SC has provided a great deal of
information about how specific connections concerned with topographic
specificity are formed, and how developmental synaptogenesis extends to
precise connections between ganglion cell terminals and the cell bodies of
the SC. Anatomical features of the primary visual pathway including
retina, ganglion cells, optic nerve and the SC, involved in the present
study, will now be described in detail.
Cellular structure of the retina
Anatomical analysis on the retina of marsupials (for review see Johnson, '77; Dunlop et al., '88) shows that its cellular structure follows the same
general plan for all mammalian vertebrates, which was first demonstrated
in the pioneering work of Roman y Cajal (1892, 1911). The mature retina consists of a thin plate having three cellular layers (the outer and inner nuclear layers and ganglion cell layer), that are separated by two plexiform
layers (the outer and inner plexiform layers). The cellular layers contain morphologically and functionally distinct neurons, in which the outer
nuclear layer contains the photoreceptors including rods and cones; and
the inner nuclear layer contains all horizontal bipolar and interplexiform
cells, most amacrine cells and a few ganglion cells; the ganglion cell layer
9
displaced amacrine cells. Synaptic connections between these neurons are made in the outer and inner plexiform layers. A visual image is received in
the retina by photoreceptors on the outer nuclear layer at the very back of the eye, passing through the optics of the eye, such as cornea, aqueous humor, pupil, lens and vitreous body. The image is relayed through the bipolar cells by means of synaptic connections with photoreceptors in the outer plexiform layer, to the ganglion cells in the ganglion cell layer. Two sets of interneurons, horizontal cells and amacrine cells modify the input
at the relay points (Dowling, '70). The ganglion cells are the only retinal neurons to send axons to the central retinorecipient nuclei, such as the SC.
An avascular retina, which relies on a well developed choroidal circulation
to supply nutrients and oxygen diffusion is a feature in marsupials although not restricted to them (Johnson, '01; Freeman and Tancred, '78;
Chase, '82; Dunlop et al., '88) A few fine capillaries arise from the optic disc and radiate a short distance across the nerve fibre layer in kangaroos and phalangers (Johnson, '01), and a more extensive retinal circulation is found in the retina of native cat (Dunlop et al., '88). Variations of the proportions
of choroidal and of retinal circulation are also documented in placental mammals. The retinal vessels cover the entire retina in human, monkey, cat and rat, while an avascular retina is found in guinea pig (for review see Stone and Dreher, '87; Dunlop et al., '88). Rabbit provides an example of partial vascularization with vessels being confined to the myelinated visual
10
Ganglion cell layer
There are two main neuronal types, ganglion cells and displaced amacrine cells in the ganglion cell layer in marsupial mammals as well as in placental mammals (Rodieck, '73; Hughes, '85; Dunlop et al., '88). Ganglion cell axons run across the ganglion cell layer in the innermost surface of the retina and converge at the optic disc, where they leave the eye and enter the optic nerve. Displaced amacrine cells comprising the second cell type are intrinsic retinal neurons with no axon leaving the eye.
11
The distribution of retinal ganglion cells in placental mammals also shows a wide range of topographies. Ganglion cells of most species are distributed across the retinal surface in a non-uniform pattern. There are areas of elevated cell density such as the visual streak in rabbit (Oyster et al., '81; Stone, '83) and the area centralis in cats (Stone, '83; Hughes, '85) and rodents (Sengelaub et al., '86; McCall et al., '87). In primates, topographic distribution of retinal ganglion cells is characterized by a fovea (Stone and Johnston, '81; Provis et al., '83). A significant centro-peripheral gradient in ganglion cell density is found in the rodent (Tiao and Blakemore, '76; McCall et al., '87). In the cat and primates such as monkey and human, the centro-peripheral ratio of density is even greater (Van Buren, '63; Stone, '65; Rolls and Cowey, '70; Hughes, '75; Stone and Johnston, '81; Perry and Cowey, '85; Lia et al., '87).
12
Linden and Perry, '82; Potts et al., '82; McCall et al., '87), 151,000-170,000 in cat (Chalupa et al., '84; Wong and Hughes, '87; Robinson, '91), 90,000 in ferret (Henderson et al., '88), 291,000 in rabbit (Robinson et al., '87), and 1.41-1.81 million in monkey (Fischer and Kirby, '91).
13
Optic nerve
The ganglion cell axons run along the inner surface of the retina and gather together to form the optic nerve, as they exit the eye. The optic nerve is the second cranial nerve and like the retina is a part of the central nervous system by embryonic origin.
In the adult optic nerve, axon numbers are found to be in close agreement with retinal ganglion cell counts in marsupials such as brush tailed possum (Freeman and Watson, '78), North American oposssum (Kirby et al., '82), quokka wallaby (Braekevelt et al., '86), as well as in eutherians such as rat (Lam et al., '82; Perry et al., '83; Sefton and Lam, '84; Crespo et al., '85), cat (Williams et al., '83, '86; Robinson, '91) and rabbit (Robinson et al., '87). It appears that only ganglion cells in the retina send axons to the central target and each retinal ganglion cell has a single axon in the optic nerve.
Over-production and subsequent loss of axons during development have been reported in similar patterns amongst mammalian vertebrates, including a number of marsupials such as quokka (Braekevelt et al., '86), North American opossum (Kirby et al., '88) and Australian native cat (Crewther et al., '88) as well as other mammals such as rat (Lam et al., '82;
14
Dreher and Robinson, '88). The time-course of changes in the numbers of optic nerve axons varies dramatically from one species to another, occuring either in the middle of the gestation period or towards the end of the gestation period, and in some cases the changes even occur postnatally. However, when compared as a proportion of the "caecal period" or blind period ("CP", the interval between conception and natural eye opening), the changes in the number of axons are found to follow a roughly similar relative time course in those mammalian species studied. Although, during the first half of the caecal period, most events occur earlier in marsupials
than in eutherians, most events occur at the same stages of the caecal period in both marsupials and eutherians during the second half of the caecal period. The accelerated rate of visual development during the first half of the caecal period in marsupials may be related to the precocious development that they undergo prior to their very early birth (Robinson
and Dreher, '90). Possible factors underlying the reduction of axon numbers in the optic nerve are thought widely to be the death of ganglion cells rather than the retraction of axonal collaterals (Cunningham et al., '82; Sengelaub and Finlay, '82; Stone et al., '82; Potts et al., '82; Dreher et al., '83; Lia et al., '87; Perry et al., '83; Sengelaub et al., '86; McCall et al., '87; Robinson et al., '87, '89).
As in placental mammals, in adult marsupials studied so far, almost 100% of fibres in the optic nerve are found to be myelinated in brush tailed possum (Freeman and Watson, '78), North American oposssum (Didelphis uirginina, Kirby et al., '82), quokka (Beazley and Dunlop, '83; Braekevelt et al., '86) and grey kangaroo (Dunlop et al., '87), while 80% of fibres are found to be unmyelinated in opossum (Didelphis marsupialis, Hokoc and
15
protracted. In the quokka, for example, the myelinated axons are first seen at 85 days after birth, with only 15% of axons being myelinated by 130 days and 76% by 150 days. In contrast to quokka, however, 3% of axons in cat optic nerve are myelinated at birth, 22% by 8 days and 93% by 30 days (Ng and Stone, '82). In rat optic nerve, 85% of axons are myelinated within 3 weeks after birth (Foster et al., '82). The onset of myelination also
appears to be less rapid in marsupials than in eutherians. Partially wrapped axons are found initially in quokka wallaby (Braekevelt et al., '86), while few are seen in cat during early development (Moore et al., '76). Electron microscopy reveals, in the quokka, the presence of compacted strips of myelin-like membranes about 40 days before the first myelinated axons are seen (Dunlop et al., '88). In postnatal rat, however, compacted membranes partially enclose bundles of unmyelinated axons less than one week before the first differentiated nodes of Ranvier are observed (Hildebrand and Waxman, '84). Conflicting sequences of myelination along the length of the developing optic nerve have been demonstrated in
marsupials and eutherians on morphological studies. A preliminary study suggests that myelination of the optic nerve axons is initiated from the chiasm rather than the eye (Dunlop et al., '88). In contrast, contradictory
results were obtained from studies on various eutherians (for review see Moore et al., '76). A gradient of myelination from the brain towards the eye is revealed in optic nerve of human and kitten (Bembridge, '56; Banik et al., '68; Blunt et al., '72). However, myelination was found to be formed first near the retina and then proceed centrally in a study on kitten (Moore
16
Anatomy of the superior colliculus
The primary visual brain centre in non-mammalian vertebrates is the optic
tectum, which receives visual input and assists generating visually guided
behaviour. The evolution of the cerebral cortex in mammalian vertebrates
did not result in the elimination of the tectum, instead as the superior
colliculus (SC), this visual centre continues to play a function in the
organization of visually directed behaviour (Sprague et al., '73; Ingle, '73).
The mammalian SC is positioned caudal to the thalamus in the midbrain,
bordered rostrally by the pretectum, caudally by the inferior colliculus,
ventrally by the mesencephalic central gray and reticular formation. The
SC is a layered structure, which is divided into seven alternating fibrous
and cellular layers. The layers comprise from dorsal to ventral as follows:
stratum zonale (SZ), stratum griseum superficiale (SGS), stratum opticum
(SO), stratum griseum intermedium (SGI), stratum album intermedium
(SAI), stratum griseum profundum (SGP), and stratum album profundum
(SAP). The layered structure is usefully viewed as being composed of two
main subdivisions: superficial and deep (Harting et al., '73). As is
commonly done the three dorsal layers will be referred to as the superficial
layers and the four ventral layers will be ref erred to as the deep layers.
The layered system is found in all mammals studied (Ramon y Cajal, '11;
Olszewski and Baxter, '54; Viktorov, '66; Lund, '72; Stein, '81), including
marsupials (Pearson et al., '76; Royce et al., '76; Sanderson and Pearson,
'77; Sanderson et al., '79; Wye-Dvorak, '84; Sheng et al., '90).
The superficial compartment of the SC is dominated by inputs from the
retina and visual cortex, which appear to be concerned with the processing
I
... · .. :
-·
....-
;r<:~i
.-
.
-f
~~
.
·,;:.:..·l:; -~ :· .. .,. ..
-.~ . · .... •#',:. . . . . ..
:.-.
• . ~ ··: .
.
.
. .. .... __ ··>:·.~~/-~~-
.
/<:
.
~
.-r~
~,
...
:
·:
_..
_
·_.
.. . - .:, -"'~ ._.- .... \ . ,i
·
.,_:'.,:t:~f
;
(
Figure 1.2A Projection drawing of Nissl-stained section of cat superior colliculus illustrating laminar organization. Dots correspond to collicular neurons and approximate
size. Numbers indicate the different laminae and sublaminae (Reproduced with permission from Kanaseki and Sprague, '74; Goldberg and Robison, '78). I: SZ; II: SGS;
III: SO; IV: SGI; V: SAI; VI: SGP; VII: SAP.
5 \
\ 6
7
ooo- .... oo O 0 O g
0
\
":>Figure 1.2B Diagrammatic representation of the cat's superior colliculus (Szekely, '73).
[image:31.657.40.648.26.775.2]17
in marsupials (Pearson et al., '76; Royce et al., '76; Sanderson and Pearson, '77; Sanderson et al., '79; Wye-Dvorak, '84; Harman and Beazley, '86) and eutherians (Kanaseki and Sprague, '74; Hubel et al., '75; Graybiel, '75, '76; Harting and Guillery, '76; Wise and Lund, '76; Land and Lund, '79). The superficial layers receive afferent input also from cortex in marsupials (Sheng et al., '90) as well as in other mammals (Garey et al., '68; Kawamura et al., '74; Hollander, '74; Gilbert and Kelly, '75; Kunzle and Akert, '77; Mcllwain, '77; Updyke, '77; Haight et al., '80; Sefton et al., '81; Olavarria and Van Sluyters, '82, Graham, '82; Fries and Distel, '83; Segal et al., '83; Segal and Beckstead, '84; Fries, '84).
The deep compartment of the SC, lying below the stratum opticum, is occupied by non-optic afferents from several sensory modalities, motor areas, and areas that are neither purely sensory nor purely motor. These come both from cortical and subcortical sources (for review see Sparks, '86). Unlike the LGN, in which there is an overt cellular lamination with each of the retinorecipient layers receiving direct retinal inputs exclusively from one eye or the other (for review see Garey et al., '91), the laminar structure in the SC is not strictly organized on the basis of ocular segregation. Inputs from the ipsilateral eye tend to be segregated into eye-specific patches within the retinorecipient layers (for review see Rhoades, '91).
[image:32.657.27.646.24.800.2]18
ascending axons of deeper lying neurons target here. The SO is a lamina of white matter with indistinct borders containing a few smaller neurons. The superficial part of this layer contains the optic axons which arrive from the optic tract. These axons terminate towards the surface in the overlying stratum. The SGI is relatively wide, dominated by large multipolar neurons. In addition, a number of small and medium size neurons of diverse form make the cell population in this stratum variegated as in the superficial strata. The axons terminate in the neighbouring strata, some of them ascending as far as the SZ. The SAI contains the myelinated fibres of large multi polar neurons, and is the main efferent pathway of the tectum. A few small and medium size neurons make the borders of this layer indistinct from the neighbouring strata. Although the SGP is not well
delimited, the neuron population is similar to that of the SGI. The SAP delimits the colliculus from the central gray matter. It contains the axons of overlying neurons and commissural fibres which interconnect the two colliculli.
19
Topography of retinocollicular projections
The fact that certain nuclei receive direct topographically ordered
projections from the retinal ganglion cells is a feature in the brain of
vertebrates. One of their main destinations is the superior colliculus (or
optic tectum in non-mammalian forms), over which the temporal retina
projects rostrally, the nasal caudally, the dorsal laterally and the ventral
medially (Kruger, '70; Schiller, '84; Flett et al., '88; Mark et al., '93a). Three
strategies of mapping have been demonstrated in the retinotectal
projections (for review see Lund, '78; Flett, '86; Flett et al., '88; Mark et al.,
'93a). First, the retinotectal projection has a map of the entire contralateral
retina with all axons crossing at the optic chiasm. This organization is
found in non-mammalian vertebrates which have lateral eyes such as fish,
amphibians and birds (Campbell and Ebbesson, '69; Scott, '73; Clarke and
Whitteridge, '76). Amongst the mammals, the decussation plan is
complicated by a direct pathway from the ipsilateral eye and by differences
in the amount of contralaterlal retina having a collicular projection. In
rabbits, which have laterally placed eyes, there is almost complete
decussation of the optic nerve so the projection to the SC is almost entirely
of the contralateral hemifield (Hughes, '71). However, in the primates such
as monkey, the eyes are in the frontal plane, the nucleus in the SC has a
map formed through partial decussation of the optic nerve, in which it
receives input from the contralateral retina nasal to the vertical midline
and from the ipsilateral retina temporal to the midline. The contralateral
visual hemifield is represented in the nucleus and most collicular visually
responsive neurons are binocular (Cynader and Berman, '72; Lane et al.,
'73; Stone et al., 73). This is the second strategy of organization. In
between, there are many variations combining a complete representation of
20
contribution, generally from the temporal retina, to a binocular region. A visual field that extends from the far periphery contralaterally to beyond
the vertical midline is represented in the colliculus (Lund et al., '74; Guillery, '82; Holcombe and Guillery, '84; Insausti et al., '84). Apart from megabats and primates, this third strategy of mapping retinal projections to the SC is employed by all placental mammals studied so far in which the eyes may more or less be lateral (for review see Flett, '86). Marsupial
mammals such as American opossum and tammar wallaby follow this plan
(Volchan et al., 82; Flett et al., 88). Although a variety of factors can
influence the laterality of retinal projections to the SC, the relationship beween the extent of the partial decussation at the optic chiasm and the position of the eyes and the extent of a binocular frontal field has been demonstrated (Lund, '78; Guillery, '82).
The anatomical background of the primary visual pathway in marsupials,
in comparison with that in eutherians has been reviewed and their
similarities noted. The general plan of the marsupial visual system during
development conforms to that of eutherians. Marsupials therefore provide an excellent opportunity for studies on the mechanisms underlying the formation of neuronal connections in the brain. The results of experiments with these animals are relevant to experimental work on traditional laboratory mammals and eventually to the structure, function and
development of the SC in human beings.
Outline of the project and the methods used
21
projection in the superior colliculus (SC) of the wallaby is set up, is the major aim of my Ph.D thesis research.
First of all, a study on the time course of initial development in the retinal projections to the SC was carried out. The pattern of retinal innervation to the SC initially in development and the subsequent distribution of the whole population of axons on the SC is described in chapter 2. This involved using the anterograde tracing technique with the enzyme horseradish peroxide (HRP).
With the knowledge of the sequence of retinal innervation in the SC, which part of the retina projects to the SC first and the subsequent order of axonal outgrowth from different quadrants of the retina became the focus for chapter 3. This study involved using a retrograde tracing technique, with the fluorescent lipophilic carbocyanine dye 1,1'-dioctodecyl-3,3,3',3'-tetramethylindocarbocyanine perchlorate (DiI) in vitro. Dil provides intense and long-lasting staining of neurons in embryonic and neonatal brain tissue. Neuronal processes can be labelled along considerable
distances in both anterograde and retrograde directions. This dye is capable of diffusing in the lipid bilayer of aldehyde-fixed cell membranes
(Godement et al., '87; Honig and Hume, '89). The labelling observed in
fixed tissue is restricted to the plasma membrane of neurons and the labelling spreads further along axons with time. Instead, granular intracellular labelling occurs in living tissue in which staining is totally due to active axonal transport of the internalized membrane vesicles, and this extends much faster over distances than in fixed tissue.
In chapter 4, the establishment and possible mechanisms of topographic
22
as an anterograde tracer in vivo, in which the staining is intracellular and rapid over quite long distances.
The retinotopic order in the optic nerve and its relationship to the establishment of the visual map during development are described in chapter 5 by using Dil as an anterograde tracer in vivo.
23
Chapter 2. Time Course Of Initial Development
Of The Retinal Projection To The Superior
Colliculus
INTRODUCTION
Observations on the time-course of development of retinal projections to the SC have been carried out extensively in non-mammalian vertebrates. A
rostrocaudal sequence of ingrowth in retinal innervation to the tectum (the homologue of the SC in mammals) was obtained in frog (Gaze et al., '74; Currie and Cowan, '75; Holt, '84), fish (Stuermer,'88a) and chick (De Long and Coulombre, '65; Goldberg, '7 4; Crossland et al., '75; Rager and von
Oeynhusen, '79; Thanos and Bonhoeffer, '83; Fujisawa et al., '84; McLoon, '85). In addition, studies on the pattern of projections from the eye to the SC have been made widely in adult and developing mammalian vertebrates such as in placental mammals: monkey (Rakic,'77), rat (Land
and Lund, '79), hamster (Frost el al., '79; Jen et al., '84), mouse (Godement
et al., '84; Edwards et al., '86), cat (Williams and Chalupa,'82), grey
squirrels (Cusick and Kaas,'82), rabbit (Gayer et al., '89; Crabtree, '89), and in marsupials: opossum (Cavalcante and Rocha-Miranda,'78), brushtailed
24
The time-course of innervation to the SC at closely spaced time intervals remains largely unknown in mammals. Understanding of the time course
of ingrowth of the retinal projection to the SC in mammals mainly comes from the in utero studies on the rodent and from a study of pouch young in the tammar wallaby. In rat, the first axons enter the optic chiasm at
embryonic day 15 and by 16 days the axons have reached the SC rostrally. At 17 days, axons have expanded across the entire rostrocaudal extent (Lund and Bunt, '76). Development of retinocollicular projections was also
obtained in prenatal and postnatal mice (Godement et al., '84; Edwards et al., '86). Initial fibres enter at the rostral and lateral edges and extend rostrocaudally across the surface of the contralateral SC. After a short delay, uncrossed fibres spread in a similar pattern ipsilaterally. Innervation ipsilaterally is absent caudally later on, as in mature animals.
In these species, however, the duration of the period from when the first
retinal axons reach the SC, to when the retinal projection grow across the target, is very short (Lund and Bunt,'76; Godement et al., '84; Edward et al., '86). Thus, a more detailed time-course of the pattern of ingrowth of the retinocollicular projection was not available. A time-course and pattern of optic innervation on early development of the retinocollicular pathway was obtained in the tammar wallaby by using autoradiography after labelling optic axons with a tritiated amino acid (Wye-Dvorak, '84). Axons first invade the contralateral SC from 9 to 12 days after birth, and first invade the ipsilateral SC from 21 days as the label in the contralateral SC
25
apparently formed in the contralateral SC and label is concentrated in the
rostral pole of the ipsilateral SC.
The main aim of the present experiment reported here is to determine the detailed time course of ingrowth of primary visual projections to the SC in tammar wallaby early in development, using the more sensitive HRP
(horseradish peroxidase) technique. This method of anterogradely labelling
retinal axons from the eye does not have the problems of the
autoradiographic method in trying to see sparsely labelled axons against background label early in development.
Developing optic axons were labelled from the earliest postnatal stage (day of birth) to the age when optic axons cover the entire superficial layers of the SC both contralaterally and ipsilaterally. When the first crossed and
uncrossed retinal axons reach the SC and how they grow subsequently across the SC with age will be described.
MATERIALS AND METHODS
Animals
26
HRP injections
Pouch young were anaesthetized by hypothermia in ice. A dorsal triangular flap of eyelid was cut, and a hole, localized at margin of the
pupil, was made temporally in one eye with a sharp glass pipette. An intravitreal injection of 1-2 µl of a 30% solution of HRP (Sigma, Type VI)
was made slowly into the eye of the pouch young. The eyelid flap was repositioned by suture. The pouch young was warmed up by keeping it in a
humid incubator for 10 to 20 minutes. When the forearms and body were moving vigorously, the animals were reattached to the teat in the pouch. The mother was anaesthetized briefly with 2.5-4 ml of 2.5% brietal sodium
(Lilly), injected into the lateral tail vein during this procedure.
Histological procedures
After 24 hours survival, the animals were deeply anaesthetized by cooling and briefly perfused intracardially through a microcapillary pipette with warm physiological saline (0.9%), followed by a cold solution of 1 %
paraformaldehyde/1.25% glutaraldehyde in 0.1 M phosphate buffer (pH
7.4) for 30 minutes. 10% sucrose in 0.1 M phosphate buffer was then perfused for another 30 minutes. The brains were dissected out and stored in 20% sucrose in 0.1 M phosphate buffer at 4° C overnight. On the following day, brains were immersed in gelatin-albumin for 20 minutes, and then embedded in gelatin-albumin hardened with glutaraldehyde for 20 minutes. The ratio of gelatin-albumin and glutaraldehyde was 10:1. On a freezing microtome, brains of animals were sectioned at a thickness of 40 µm, in the frontal plane throughout the rostral-caudal extent. All sections were collected serially onto 0.1 M phosphate buffer (pH7.2-7.4) in
27
sections were processed according to the TMB method (Mesulam,'82). Two series of sections, A and B were then mounted separately on gelatinized slides. The sections were dried at room temperature. B series was counterstained with 0.05% thionin for 5 minutes. Both A and B sections were then dehydrated in graded alcohols, cleared in xylene and mounted in depex.
Analysis
Sections were observed in a Leitz Orthoplan microscope. At every second section of series A, an outline of the transversely sectioned SC and HRP-labelled axons were drawn using a camera lucida at a magnification of 60 times. Either bright-field or dark-field illumination was used for each section. The borders of nuclei were detected with the aid of series B stained by thionin and the distribution of labelled retinocollicular fibres was traced with the aid of the unstained series A. Subsequently, a three dimensional reconstruction of the SC revealing the distribution of the retinocollicular projections on the contralateral and ipsilateral side was made.
RESULTS
28
surface. Removal of the dura greatly reduces this artifact (L.R. Marotte,
personal communication).
The retinal projections to the SC in adult (Wye-Dvorak, '84) showed that
retinal axons enter the stratum opticum (SO) of the SC contralaterally.
The superficial gray layer (SGS) above this receives a heavy projection,
while the outermost layer, the stratum zonale (SZ), receives a light
projection. The ipsilateral projections are confined to the rostral half of the SC, showing as a series of discrete clusters in the intermediate gray layer
(SGI) beneath the SO. This mature pattern of retinal projection begins to
be present from 72 days after birth.
All the figures for this chapter are grouped together at the end of the
results section.
0 day (n=l)
Retinal fibre projection. Labelled axons were only found at the optic
chiasm but none were found beyond the chiasm in the optic tract.
2 days (n=l)
Retinal fibre projection. Some contralateral axons crossed the chiasm
and ran parallel to the ventrolateral diencephalic surface (Fig.2.lA, B). The
fibre fascicles in the optic tract extended along the lateral surface of the diencephalon to reach the level of the pretectal area, but disappeared before reaching the rostral pole of the SC (Fig.2.lC-F). On the ipsilateral
side, a very few axons were spread over the surface of the diencephalon
29
4 days (n=l)
Retinal fibre projection. More labelled axons than those seen at 2 days
could be seen at the optic chiasm and coursing toward visual areas in the contralateral thalamus and midbrain. Many fine HRP filled optic fibres were present along the contralateral optic tract and ran over the surface of the dorsal lateral geniculate body (Fig.2.2A, B). Labelled contralateral
fibres were first visible in the rostral SC ventrolaterally by this stage although they were only distributed sparsely (Fig.2.2C, D).
Distribution of retinal projection in the SC. In three dimensional
structure (Fig.2.3), the retinal axons were found to be distributed in the SC rostrolaterally. lpsilaterally very few fibres appeared on the ventrolateral surface of the diencephalon but had not entered the SC.
5-6 days (n=2)
Retinal fibre projection. From this stage, large numbers of fibre fascicles
from the optic tract began to invade the contralateral SC. Many labelled fibres extended across the surface of the SC and some finer HRP label was
first seen laterally and rostrally beneath these labelled fibres. The axons passed rostrocaudally along the ventrolateral aspects of the collicular
surface just underneath the pia. Label in the superficial layer decreased in
density toward the caudal pole (Fig.2.4). lpsilaterally, sparse fibres were seen within the optic tract and a few of them began to invade the rostral
pole of the SC. Because the label is extremly sparse, no picture is available,
30
Distribution of retinal projection in the SC. The distribution of
labelled fibres occupied the lateral half of the contralateral SC and extended over most of the rostral-caudal extent, with the exception of the caudal pole. No fibres were close to the medial border. Ipsilaterally, retinal axons were distributed in a very small portion of the rostrolateral SC
(Fig.2.5).
8 days (n=l)
Retinal fibre projection. Contralaterally, the coarse superficial label
became thicker and the finer label beneath it increased in depth (Fig.2.6).
Distribution of retinal projection in the SC. The SC had increased in
size both in rostral-caudal and lateral-medial extent. The extent of the
contralateral retinocollicular projection was similar to that seen at earlier
stages. Labelled axons covered the lateral contralateral SC throughout the
rostrocaudal extent. Denser superficial label was seen rostrally, while
sparser label was seen caudally. Ipsilaterally, sparse label was found at
the rostral-lateral pole of the SC. The lab~l had extended slightly more
caudally and medially, compared to that seen at 5 days (Fig.2. 7), but very
few fibres were present compared to the contralateral side.
10-12 days (n=2)
Retinal fibre projection. Coarse retinal fibres were prominent
superficially over almost the whole rostral-caudal extent of the
contralateral SC, especially rostrally (Fig2.8A-F). Finer HRP reaction
product deep to this was seen rostrally (Fig.2.8A-D). The coarse fibres in
31
fibres which became sparser gradually and disappeared close to the caudal pole (Fig.2.8F). On the ipsilateral side, much sparser label was seen
superficially and rostrally (Fig.2.8B).
Distribution of retinal projection in the SC. A similar distribution
pattern of label to that seen at 8 days was obtained contralaterally and i psila terally.
14-16 days (n=2)
Retinal fibre projection. The crossed optic fibres in the SC extended superficially towards the caudal pole. The thickness of both the coarse and
fine label had increased from that seen at the previous age and the fibres gradually decreased in density caudally (Fig.2.9A-F). Fibres had still not
reached the caudal pole. The fine label mainly seen at the rostral and
lateral edges, deep to the most superficial layer, extended deeper into the
SC than at earlier stages (Fig.2.9A-D). The uncrossed fibres, localized in
the rostrolateral part of the ipsilateral SC, had increased compared to the
previous age, but were still sparse compared to the contralateral projection
(Fig.2.9A, B).
Distribution of retinal projection in the SC. By 16 days, the contralateral projection covered almost the entire rostral-caudal extent of
the SC and extended further medially than at earlier ages to occupy approximately four fifths of the SC along the medial-lateral extent. Ipsilaterally, the retinal projection was confined to rostral and lateral SC
32
18 days (n=l)
Retinal fibre projection. The nature of label in the contralateral and
ipsilateral SC appeared unchanged from that seen at the previous stage.
Distribution of retinal projection in the SC. From this stage, in the SC
on the side contralateral to the eye injection, optic axons first reached the caudal pole. They extended also more medially. Fibres distributed ipsilaterally still covered a small region in the lateral and rostral SC (Fig.2.11).
20-23 days (n=2)
Retinal fibre projection. The denser label was distributed in the most
superficial layer across the whole surface of the SC, with label becoming coarser and fibrous in appearance at the caudal pole (Fig.2.12A-F). The label beneath this extended deeper into the SC, being seen as a distinctive narrow crescent-shaped region of HRP product in which the label was finer and less dense (Fig.2.12A-D). On the ipsilateral side, more labelled axons than those at earlier stages were seen superficially and for the first time
finer label was seen to extend deep to the superficial label (Fig.2.12A, B).
Distribution of retinal projection in the SC. From this stage (Fig.2.13),
33
26-29 days (n=2)
Retinal fibre projection. At this stage, the nature of the labelled fibres
projecting both contralaterally and ipsilaterally were similar to that seen at 20-23 days.
Distribution of retinal projection in the SC. From 26 days, the crossed
projection first reached the medial border except at the most caudal pole.
The uncrossed projection was distributed still at the rostral and lateral part of the ipsilateral SC (Fig.2.14).
35 days (n=l)
Retinal fibre projection. At this age, contralateral fibres deep to the
most superficial layer were spread relatively evenly throughout the rostrocaudal and lateromedial extent (Fig.2.15A, B), with exception of the far caudal pole (Fig.2.15C). On the ipsilateral side, for the first time, a concentration of label was seen more deeply at the rostral pole and coarse fibres positioned most superficially became sparser (Fig.2.15A). Further caudally, finer fibres were seen in the superficial layer (Fig.2.15B). The ipsilateral label was densest rostrally and decreased towards the caudal pole (Fig.2.15A-C).
Distribution of retinal projection in the SC. Distribution of labelled
34
39 days (n=l)
Retinal fibre projection. Ipsilaterally, patches first appeared more
deeply with the loss of label more superficially. This was only seen in the more rostral SC (Fig.2.17).
Distribution of retinal projection in the SC. The distribution of the
retinal projection in the contralateral and ipsilateral SC was similar to that seen at the previous stage.
46 days (n=l)
Retinal fibre projection. Contralaterally, coarse label extended
superficially over the entire SC. Finer label dispersed in the layer deep to
this was seen from the rostrolateral to the caudomedial pole. Ipsilaterally, label in the superficial layer was sparse extending from rostral to caudal,
while label concentrated in deeper layers was patchy falling off in density caudally (Fig.2.18). Up to and including this stage, the SC was not differentiated clearly into the cyto-architectural layers seen in adults
(Wye-Dvorak, '84).
Distribution of retinal projection in the SC. Label in the superficial
layer first extended throughout the entire rostrocaudal and lateromedial
Figure 2.1 Brightfield micrographs of unstained (A, C, E, F) and
stained (B, D) coronal sections through the diencephalon and
pretectum after an intraocular injection of HRP at 2 days
Contralateral to the injected eye is on the right. (A) and (B): An unstained
section and an adjacent stained section show that on the contralateral side,
a few labelled axons indicated by arrows run parallel to the lateral surface
of diencephalon. Bar: 200 µm. (C) and (D): An unstained section and an
adjacent stained section at the pretectal level shows that the fibre fascicles
in the optic tract indicated by arrows reach the pretectum but do not
achieve the rostral pole of the SC. Bar: 100 µm. (E) and (F) show
high-power views of a few fine labelled axons, which are seen in (C) and (D), on
[image:50.632.24.580.18.769.2]A
-E
-I
.. ~ '
.
0 •
•
•
. ...,
1 . .. . .
I
'
.
..
~-.P--., ··
..
••
•
•
•
B
...
'
,.
'
.
,
•'
.
.
•
Figure 2.2 Brightfield micrographs of unstained (A) and stained (B, C, D) coronal sections through the diencephalon and SC after an intraocular injection of HRP at 4 days
Contralateral to the injected eye is on the right. (A) and (B): An unstained
section and an adjacent stained section show that many fine HRP labelled
[image:52.642.7.586.20.775.2]A
B
,
~·
'
"
•
~--~ I 'I' ., ,, '
I •
\
.
,
_
..
., r,
.
.
,,.
. /.,
... \;
,
...-
~
,..
.
.
.
, . ' t,-·'
.
t-
-
-C
-:;,
,
.
\D
'
.,
'
I •
'
-CAUDAL
LATERAL
LATERAL
IPSI.
CONTRA.
ROSTRAL
Figure 2.3 Map reconstructed from camera lucida drawings of
coronal sections through the SC after an intraocular injection of
HRP at 4 days
[image:54.673.35.663.15.795.2]Figure 2.4 Brightfield micrographs of unstained coronal sections
through the SC after an intraocular injection of HRP at 5 days
Contralateral to the injected eye is on the right. (A-E): Sections shown run
from the rostral pole of the SC (A) to close to the caudal pole (E) (see figure
2.5). Many labelled axons are distributed in the superficial layer of the
contralateral SC (arrows). Axons extend rostrocaudally along the lateral
aspects of the collicular surface just underneath the pia and decrease in
density towards the caudal pole. They do not reach the caudal pole (see
figure 2.5). Some fine HRP reaction product is first seen deep to the
superficial axons laterally (arrowheads in A, B). Bar: 100 µm. (F) presents
a high power view close to the far caudal pole showing the most caudal
label. Only a few individual axons indicated by arrows are seen. Bar: 50
A
B
C
-
"\ '·,JI
'\.
JI ').
~
JI
.,,.
...
..,.
~I ,. ,, .
t
·f." ~
~
.
-D
F
JI
'
..,,
...
/
-
·
-
-E
..
·
-
-.. _--
.. ~ ~CAUDAL
LATERAL
LATERAL
IPSI.
CONTRA.
ROSTRAL
Figure 2.5 Map reconstructed from camera lucida drawings of
coronal sections through the SC after an intraocular injection of
HRP at 5 days
Conventions are the same as for figure 2.3. In addition, the cross hatching
indicates the area of the retinal projection to the ipsilateral SC. At this
stage, labelled fibres contralaterally occupy the lateral half of the SC and
extend over most of the rostral-caudal extent, with the exception of the
caudal pole. For the first time, fibres begin to invade the rostral and lateral
pole of the ipsilateral SC. CONTRA: contralateral; IPSI: ipsilateral. Bar: 1
Figure 2.6 Brightfield micrograph of unstained coronal section
through the rostral SC after an intraocular injection of HRP at 8
days
Labelled axons cover the contralateral SC laterally. The label in the
superficial layer has become thicker and the finer label (arrow) extended
deep to this has increased in depth, compared with that seen at the