Evaluation of Pilot Summer
Activities Programme for 16 Year Olds
Graham Thom
SQW Ltd
Research Report
No 341
Evaluation of Pilot Summer
Activities Programme for 16 Year Olds
Graham Thom
SQW Ltd
The views expressed in this report are the authors' and do not necessarily reflect those of the Department for Education and Skills.
© Queen’s Printer 2002. Published with the permission of DfES on behalf of the Controller of Her Majesty's Stationery Office. Applications for reproduction should be made in writing to The Crown Copyright Unit, Her Majesty's Stationery Office, St Clements House, 2-16 Colegate, Norwich NR3 1BQ.
Table of Contents
Acknowledgements
Executive Summary
Chapter
Page
1 Introduction
1
The role of Connexions
1
Methodology
2
Report
structure
3
2
Characteristics of pilot projects
4
Describing the partnerships
4
Management
structure
7
Other staff involved in the partnerships
11
Engaging young people
14
Delivering the project
19
Summary
29
3
Characteristics of participants
30
Personal characteristics
30
Academic
performance
32
Levels of personal social development
35
Future
plans
36
Comparing the profile of participants with the 2000
cohort
37
Getting
involved
38
Summary
41
4
The impact of the programme
42
Overall impact on future plans
42
Overall impact on personal and social characteristics
45
Overall satisfaction with the programme
46
Impact on different groups
46
Key influencing variables
49
Impact on young people – the longer term perspective
51
Summary
56
5
Conclusions and issues arising59
Summary of achievements
59
Areas in need of further development
61
Annex
A
Quantitative data gathering techniques
B Statistical
analysis
C Questionnaires
D
Review of follow up surveys
E
Good practice case studies
List of tables
Page
1.1
The elements of the evaluation framework2
2.1
Categorisation of partners
10
2.2
Categorisation of activity providers12
2.3
Professional background of personal advisers/mentors
13
2.4 Recruitment
methods
16
2.5
Numbers of young people participating
17
2.6
Projects achieving participant targets
17
2.7
Reasons for young people leaving the project early
18
2.8
Number of participants
20
2.9
Total actual costs
20
2.10
Responsibility for key elements of the evaluation
22
2.11
Activities undertaken – residential and non-residential
24
2.12
Frequency of meetings with personal advisers
28
2.13
Nature of meetings with personal advisers
28
Key
statistics
29
3.1
Characteristics of participants
31
3.2
Key Stage Three attainment
33
3.3
Participants’ responses grouped into skill types and graded by
quartiles
36
3.4
Comparing key participant characteristics, 2000 and 2001
38
3.5
Finding out about the summer activities programme
39
3.6
Finding out about the activities available
39
3.7
Reasons for getting involved
40
Key
statistics
41
4.1
Participants’ intentions in the Autumn43
4.2
The nature of changes to participants’ perceptions
44
4.3
Proportion of individuals participants’ whose scores changed
46
4.4
Participants’ intentions before and after the programme
47
4.5
Influence of programme on participants’ plans
48
4.6
Proportion of individual participants whose scores increased
49
4.7
2000 cohort destinations
55
Acknowledgements
Executive Summary
Introduction
1. In the summer of 2000 the Department for Education and Employment (now the
Department for Education and Skills - DfES) supported a number of projects, which were asked to pilot the delivery of a summer activities programme to young people, aged 16 years old. The initial programme received support of £1 million and was aimed at 2,000-3,000 young people. In 2001 the level of resources was raised to £10 million, which was expected to support places for 14,000 young people. This report contains the findings of an evaluation of the second year of the programme, which was undertaken by SQW Limited, with support from the NOP Research Group.
Characteristics of pilot projects
2. Forty-seven areas delivered summer activities projects to approximately 10,340
young people. The structure of the partnership varied across the country in both scale (one to 17 partners) and type of lead organisation (68% were led by local authorities). The total cost was around £8 million. Costs per participant in each area averaged around £1,000 although there was much variation within this.
3. Over three-quarters (78%) of young people undertook outdoor adventure type
activities on their main activity programme, which lasted for an average of five days. On average, induction activities lasted three days, with follow up support lasting an average of four days.
4. A range of eligibility criteria was put in place at a project level. The main method of recruitment was via teachers or school nomination but a variety of other sources were also used. Even if a set procedure for recruitment was outlined at the start, difficulties in recruiting and retaining sufficient numbers often meant that the group was supplemented at a later stage to meet the target number of participants.
Approach to activity provision
to encourage young people to reflect on what they had learned from their experiences.
6. A key element behind the design of many of the programmes was the idea of
empowering young people and it seems as though many of the providers were making good progress towards this. This focus on empowerment was echoed in the responses from young people. It seems that on the whole young people played quite an active role in several aspects of programme organisation. They appear to have been most pro-active in drawing up rules and enforcing them.
Main activities
7. The vast majority of partnership areas reported that they offered all young people the chance to undertake a residential activity. The majority of programmes offered a ‘choice of activities from a menu’ for either groups (42%) or individuals (42%). Overall 87% of the young people reported that they attended a residential.
8. A high proportion of projects (83%) gave young people the opportunity to undertake a non-residential activity. Non-residential activities undertaken showed less of a focus on outdoor adventure type activities with a wider spread of activities and more inclusion of creative activities.
9. While most areas offered young people access of a personal adviser/careers advice:
• a slightly higher proportion of all young people met a personal adviser before the activities programme (61%) compared to after the programme had finished (55%)
• 71% of those with a personal adviser reported that their personal adviser stayed with them throughout the entire residential and a further 11% reported that their personal adviser stayed with them for some of the time.
Characteristics of participants
10. The programme seems, at least to some extent, to have been successful in terms of
of all participants had not received assistance in deciding what choice to make in September before starting the programme.
The impact of the programme
Overall Impact on future plans
11. The summer activities 2001 programme has not had a major impact upon the overall
destination choices of young people. The broad proportions preferring each destination remained largely as they were at the outset of the programme.
12. The overall impact figures, however, do not tell the full story. The matched survey results show that there is considerable traffic towards the school/college options upon completion of the programme, while the vast majority (94%) of those expressing an initial preference for school/college maintain this choice. The participants expressing an initial preference for employment outcomes also tend to be more resistant to change, although even here around 40% have switched preferences. In total, 27% of participants have switched from their initial preference.
13. When asked about the degree of influence that the programme had had upon their
plans, almost 30% of participants felt that it had completely changed them or had a significant influence. Two thirds of participants, however, felt that the programme had had little or no influence on their plans. A third identified the residential and a fifth cited the contribution of the personal adviser as the most influential element.
Overall impact on personal characteristics
14. The results would suggest that there has been a degree of personal progression
towards some of the specified programme objectives, but not in all. Participants recorded significant improvements in self-esteem, leadership skills and confidence. Less significant improvement were identified in terms of new experiences and communication skills. It is a concern that for each attribute between a third to a half thought their skills had actually declined, although this may be due to a greater realisation of what each of the personal and social development characteristics are. The decline in scores may therefore reflect a more realistic appraisal of their own skills.
15. The decline may therefore simply reflect a more realistic appraisal of their own skills.
Impact on different groups
16. The programme has had most impact upon those participants with lower educational
had completely changed or had a significant influence on their plans. In contrast, a significantly smaller proportion of those who rarely missed school (26%) felt that the programme had had a great effect on them.
17. Participants with less than three GCSEs and those frequently avoiding or excluded
from school recorded more progression than their counterparts with over five GCSEs and those rarely missing school. This was most marked in terms of communication skills where the least motivated participants progressed by 4% over the figure for all participants.
18. Subsequent follow-up surveys of the 2001 participants, their parents/guardians and with 150 of the summer 2000 cohort, by telephone, confirmed that these effects appeared to last beyond the immediate end of the programme. In fact, three quarters of the summer 2000 cohort felt that they had changed directly as a result of the programme. These changes were confirmed by the results of the parent/guardian interviews. The most frequently identified changes included: increased self-confidence; better group working skills; and enhanced communication skills
Conclusions and issues arising
19. It is apparent that much has been achieved in developing the 2001 programme. We
estimate that in total around 12,972 enrolled in the programme, with 10,340 taking part in the main programme of activities. This is a substantial increase on the previous year. The increase in the number of young people participating has been facilitated by the involvement of new areas and organisations.
20. While much has been achieved and learned, it is apparent that there is still some
distance to go before the programme matures. For example, while many new partnerships have been formed and others strengthened, in other areas the extent and nature of partnership working needs to develop in future years.
1 Introduction
1.1 In the summer of 2000 the Department for Education and Employment (now the Department for Education and Skills - DfES) supported a number of projects which were asked to pilot the delivery of a summer activities programme to young people, aged 16 years old. The aim was to maintain constructive contact with this group during the summer, following completion of their GCSEs. This contact would be used to help guide participants into furthering their education and skills development - either at college, school 6th form, a
training course or a job with training. A key part of the programme was therefore to help individuals to consider opportunities that they had been previously unaware of. Other objectives for the participants included increasing confidence and self-esteem, team working, leadership and life skills.
1.2 The initial programme received support of £1 million and was aimed at 2,000-3,000 young people. The initial positive results led the Department to fund a greatly expanded pilot in 2001. The level of resources was raised to £10 million, which was expected to support places for 14,000 young people.
1.3 This report contains the findings of an evaluation of the second year of the programme, which was undertaken by SQW Limited, with support from the NOP Research Group.
The role of Connexions
1.4 The other major change in 2001, alongside the increase in scale, was a requirement that bids for funding were submitted at a Connexions area level (previously smaller sub-areas had bid, led by a local authority or the Careers Service). The new arrangement meant that the Department received 47 bids.
1.5 The Connexions service is not yet fully developed across England. Twelve areas began operation in April 2001 and three further partnerships went live in September. Similar services will be phased in across the country over the next two years. Therefore, in a number of areas partnerships and consortia had to be formed to produce the bid document.
1.6 There was a strong rationale for seeking to involve the emerging Connexions service. It is intended to bring together a range of partners (including learning, health, and youth justice) in the same geographical areas as the local Learning and Skills Councils. A key goal for Connexions is to ensure a smooth transition to adulthood and working life for all young people.
education or employment between the ages of 16 and 18 is a strong predictor of later unemployment (more than 40% of those not in work or training at 16 are in the same situation at 18), and this ‘unemployment disadvantage’ persists as young people progress into adult life. There was a clear expectation that the summer activities programme could contribute towards a smoother transition.
Methodology
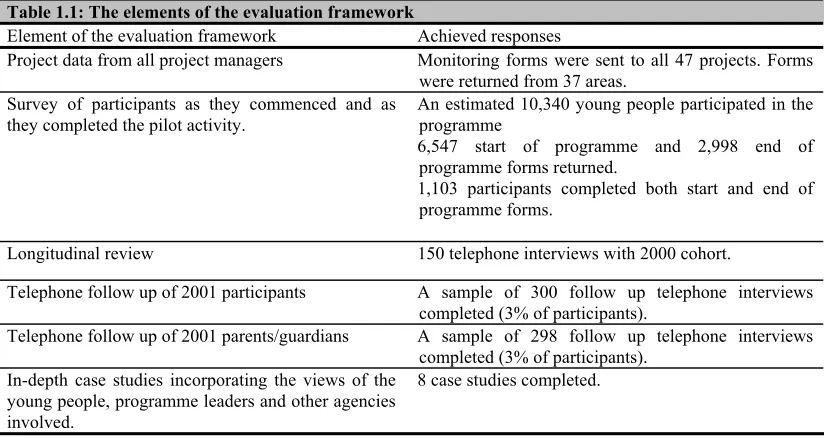
[image:12.595.110.525.269.488.2]1.8 The methodology followed closely from that used in and the lessons learned from the evaluation of the first pilot programme in 2000. However, given the step change in the scale of the programme the evaluation framework can be viewed as a pilot as much as the activities themselves. This framework is comprised of the following elements:
Table 1.1: The elements of the evaluation framework
Element of the evaluation framework Achieved responses
Project data from all project managers Monitoring forms were sent to all 47 projects. Forms were returned from 37 areas.
Survey of participants as they commenced and as they completed the pilot activity.
An estimated 10,340 young people participated in the programme
6,547 start of programme and 2,998 end of programme forms returned.
1,103 participants completed both start and end of programme forms.
Longitudinal review 150 telephone interviews with 2000 cohort.
Telephone follow up of 2001 participants A sample of 300 follow up telephone interviews completed (3% of participants).
Telephone follow up of 2001 parents/guardians A sample of 298 follow up telephone interviews completed (3% of participants).
In-depth case studies incorporating the views of the young people, programme leaders and other agencies involved.
8 case studies completed.
Report structure
1.9 The rest of this report is structured as follows:
• chapter 2 details the characteristics of the pilot projects including details of recruitment and pre-start elements, the activities delivered and post-programme elements
• chapter 3 examines the characteristics of participants on the programme
• chapter 4 considers the impact of the programme
• chapter 5 contains a summary of our findings and conclusions.
2
Characteristics of pilot projects
Introduction
2.1 This chapter is divided into three main sections as follows:
• the first section looks at characteristics of summer activities partnerships that were set up to manage and co-ordinate delivery
• the second section moves to look at the key issue of recruitment and retention and how the partnerships set about engaging young people
• the final section describes the programmes delivered by the partnerships and variations in the approaches adopted.
2.2 The information in the following section is drawn mainly from the Monitoring Information Requirements form, completed by project managers, from 37 project areas.1 Where
appropriate, reference is also made to the survey of project participants and to the qualitative information gathered through the case study visits and telephone discussions with local project managers.
Describing the partnerships
2.3 Following on from the 2000 summer activities pilot the number of programmes set up was extended from 32 to 47 throughout England. There was continuity between the two years with some organisations involved in 2000 continuing to be involved in 2001. Generally, the summer activities programme areas were designed to be contiguous with the 47 actual and potential Connexions areas.
2.4 The awarding of contracts at a Connexions area level meant that in practice the growth of the programme was much more substantial than the 50% increase in the number of projects. Indeed, the target number of participants increased from 1,500 to 14,000. Much of this increase was meant to come from spreading the project to new locations, as well as increasing numbers in the existing areas. In some cases the expansion to new areas has meant that whereas before a project ran in part of a Connexions area, it has now spread to the whole area. This appears particularly likely where the Connexions area straddles more than one authority.
2.5 The project’s affinity with Connexions, together with the increased scale of the initiative in 2001, provided the opportunity for a partnership approach to develop with the buying in of
1 This includes returns from London East where control was devolved to nine London boroughs. However, due to only five areas
relevant activities on behalf of young people. Case study visits revealed that in some areas effective partnership working was being undertaken with responsibilities being shared amongst partners under the guidance of strong leadership. However, in other areas partnership working was still in its infancy with perhaps just one organisation attempting to undertake all roles and responsibilities and little involvement from other ‘partners.
2.6 The following section looks at the nature of these partnerships in more detail.
Partnership structure
2.7 In addition to differences between partnerships that were set up in pilot Connexions areas and those where Connexions was at an earlier stage in its development, there were a number of other factors which resulted in variation in partnership structures. These included:
• geography of the catchment
• size of the catchment and the target group
• existing links between organisations.
2.8 These factors resulted in a range of partnership approaches being set up. The following gives a flavour of this variety:
Local groups with participant choice
Partnership
Recruit for local groups Induct in a group
Activities Manager
Choice of activity
Follow on in original group
Managed Caseload with participant choice
Example: Cornwall and Devon. Individuals were added to a central database. Groups were then defined based on individual’s choice of activity.
Local autonomy
Example: London East. Each of the local authority youth service departments developed a programme, with London South Bank Careers acting as lead partner.
Management Structure
Lead Organisation
2.9 As can be seen from the above examples one of the key variables influencing the partnership structure was the nature and role of the lead organisation involved.
2.10 The majority of projects were led by a local authority (68%), in particular:
• local authority youth service – 57%
• local authority education department – 8%
• local authority outdoor education service – 3%.
2.11 The Connexions service led six of the partnerships. While this equates to just 16% of the sample, it implies that where a Connexions pilot was operational it led in around a third of
Partnership
Recruitment across an area Central allocation to groups based on individual’s choice of activity
Induct in a group
Activities in the same group
Follow on in original group
Recruit for local groups
Induct in a group
Activity in the same group Follow on as a group Recruit for local groups
Induct in a group
cases. This reflects that many of these services are still at an early stage of development and that the Connexions service overall is still in the process of being established. It is expected that Connexions services will play more of a lead role in future years of the programme. In the other 12 Connexions areas, the lead was taken by:
• local authorities – 9 cases
• others – 3 cases
¾ a university
¾ an outdoor trust
¾ a community or voluntary group.
2.12 Other organisations involved in taking a lead included community or voluntary groups like Watford Young Men’s Christian Association (YMCA) and others including the Trident Trust, Liverpool Hope University and Brathay Hall Trust.
2.13 Key roles undertaken by the Lead Partner, in nearly all cases, included:
• ensuring providers were Adventure Activities Licensing Authority (AALA)2
approved
• financial accountability
• liaison with DfES
• managing sub-contracts with service providers
• overall co-ordination
• quality assurance.
2.14 In reality, the role of the lead partner was large and varied, with most taking on a combination of ground level inputs as well as more strategic level tasks. The role of the lead partner in each area was to some extent dependent upon their background experience and interests. In some cases, where the lead manager had a particular passion for outdoor adventure type activities and had been involved in this sort of scheme in the past they were more likely to take on an implementation role. For example, in Hertfordshire the project managers also undertook personal adviser type roles as well as overseeing the management and co-ordination of the project.
2 Under The Activity Centres (Young Persons' Safety) Act 1995 it became a legal requirement for providers of certain adventure activities to undergo
Partner organisations
2.15 One of the initial duties of the lead partner was to bring together a group of partner organisations in order to set up a working or steering group. In some cases, the lead partner aimed to integrate organisations that they had worked with previously. In other cases organisations took a more pro-active role in nominating themselves for involvement. Several had been involved in or had heard about the summer activities programme in the previous year.
2.16 The number of partners involved in the scheme averaged six per area. This ranged from 17 in Staffordshire to just one partner in the Kent and Medway project (Medway Council working with Kent County Council as the lead).
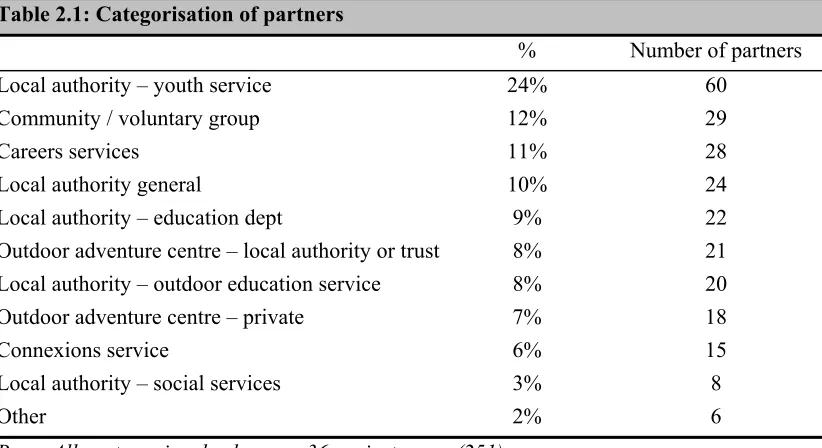
2.17 The youth service accounted for the largest group of partners involved in the summer activities programme (24%). This is in addition to their role in many cases as lead partner and illustrates the central role played by the youth service. Community or voluntary groups accounted for the next largest share (12%) with careers services accounting for 11%.
2.19 Local authorities (including the youth service, outdoor education and education) accounted for 54% of all partners with at least 14% of partners in each project being local authority based. Three projects (West of England, West London and Kent and Medway) involved partners who were all local authority based. The latter two projects were also local authority led with the West of England project being headed up by Connexions.
2.19 Two thirds of projects were headed up by a local authority department and each of the six Connexions led projects drew at least half of their partners from the local authority sector.
2.21 A full breakdown of partner types is shown in Table 2.1.
Table 2.1: Categorisation of partners
% Number of partners
Local authority – youth service 24% 60
Community / voluntary group 12% 29
Careers services 11% 28
Local authority general 10% 24
Local authority – education dept 9% 22
Outdoor adventure centre – local authority or trust 8% 21
Local authority – outdoor education service 8% 20
Outdoor adventure centre – private 7% 18
Connexions service 6% 15
Local authority – social services 3% 8
Other 2% 6
Base: All partners involved across 36 project areas (251)
Management, co-ordination and administration
2.22 In most cases the managers and co-ordinators were derived from the lead or partner organisations. The role of project managers was to oversee the whole programme, to ensure it ran smoothly and to monitor progress throughout its duration. Co-ordinators took on a more ‘hands-on’ role with duties including timetabling events, allocating participants to advisers or to activities and managing contracts with service providers. Administrators provided a supporting role in the paperwork and monitoring aspects of the programme.
2.23 Contributions towards management, co-ordination and administration of the projects were considerable. From our discussions with project managers it is apparent that in many cases this surpassed their initial expectations. In several cases the demands of the programme have been such that the original short term secondments or appointments had to be extended further. Projects have also had to deal with problems associated with changes in staff personnel with some projects experiencing several changes in key managers and co-ordinators during the project’s lifespan.
Other staff involved in the partnerships
The role of activity providers
26 projects included at least one activity provider as a key partner. The following section looks at activity providers and the nature of their involvement in project delivery in more detail.
2.25 The average number of activity providers was 13 per area, but this ranged from 51 providers in Tyne and Wear to just two providers in London West, with a median of nine partners overall.
2.26 Some major activity providers played a role in projects throughout the country. For example:
• Outward Bound Trust – involved in seven projects
• World Challenge Expeditions – involved in seven projects
• Brathay Hall Trust – involved in five projects
• Trinity Sailing – involved in four projects
• United Kingdom Sailing Academy – involved in three projects.
2.27 The majority of activity providers focussed on outdoor adventure as their main type of provision. All programme areas sub-contracted to at least one outdoor adventure activity provider with an average of eight per area. However, 37% of providers were also involved in the delivery of other sorts of activities. For example:
• motoring workshops
• paintball activities
• First Aid courses.
2.28 Other activities also include sessions on careers guidance and curriculum vitae preparation, which were mainly delivered by careers services and Connexions.
2.29 Arts or media type courses were also being offered in fairly large numbers (12% overall). This included a range of innovative types of activities including:
• disc jockey workshops
• Brazilian drumming sessions
2.30 A breakdown of partners is given in Table 2.2.
Table 2.2: Categorisation of activity providers
% Average providers per project area
Outdoor adventure 63% 8
Arts or media 12% 3
Information Technology (IT) 4% 2
Work experience 5% 2
Voluntary work 1% 1
Other 15% 4
Base: All activity providers involved in 36 project areas (459)
The role of personal advisers
2.31 Given the lessons learned in the 2000 pilot about the need for personal support and guidance to accompany a programme of activities, this years’ projects aimed to integrate personnel in a personal adviser/mentor type role. This also fits well with the onset of personal advisers in the Connexions service.3 The specific role varied between projects but responsibilities of the personal adviser included inducting young people onto the programme, organising pre and post activity sessions, and maintaining contact with the young person until they progressed to further education, training or employment.
2.32 On average each project involved 30 personal advisers or mentors in delivering the summer activities project. This ranged from just four personal advisers in one area to 106 in another. A more useful indication of personal adviser levels comes from the ratio of personal advisers to young people. On average there were eleven young people to each personal adviser but this varied from 43 young people in one project to two young people in another.
2.33 The variation in number of personal advisers can partly be attributed to project size. For example, all those with 40 or more personal advisers were involved in projects with 150 or more participants. There was also some variation due to confusion over definition. Some projects reported that they did not include any or only a limited number of personal advisers (interpreted as personal advisers under the Connexions definition) when in fact they did involve staff, often youth workers, who provided a personal adviser/mentoring type role. A good example of this is in the Milton Keynes, Oxfordshire and Buckinghamshire project where few personnel were given the official title of personal adviser or mentor but youth workers and other staff adopted a mentoring type role.
2.34 Just under three quarters (74%) of all young people who completed the end of programme questionnaire reported having had a personal adviser for the summer activities Programme. The proportion of young people with a personal adviser varied across the project areas with
just 32% of respondents from one area compared to three areas with 100%. Just over two fifths (43%) of those with a personal adviser knew them before the summer activities programme.
2.35 The majority of personal advisers had a professional background in the youth service (55%). A further 21% originated from the careers service. Smaller proportions came from teaching (8%) or outdoor education (5%). A full breakdown of personal advisers’ backgrounds is given in Table 2.3.
Table 2.3: Professional background of personal advisers/mentors
% No
Youth service 55% 531
Careers service 21% 208
Teachers 8% 78
Instructors 5% 44
Education welfare services 1% 11
FE tutors 1% 8
Others 9% 85
Base: All personal advisers whose background was specified (965)
2.36 Within projects there tended to be a mix of personal adviser backgrounds with eight projects reporting that at least 75% of personal advisers had a youth service background. Almost a third (32%) were recruited specifically for the summer activities project but the majority (68%) were seconded from their original position.
2.37 Projects were asked to report on the average amount of training each personal adviser in their area received regarding the aims and objectives of the summer activities project. The average ranged from some areas offering no training at all (6 areas) to one area offering five days training to each personal adviser. The mean was 1.3 days. Discussions with project managers revealed that where training or briefing had been undertaken it had proved worthwhile and most were looking to broaden this activity in future years.
Engaging young people
2.38 One of the first tasks for the newly formed summer activities partnerships was to put in place mechanisms for the recruitment of young people. Recruitment and the follow-on issue of retention proved to be a key issue across the 2001 pilots and both are dealt with in turn below.
Organisations involved in recruiting
2.39 A range of organisations were involved in recruitment with Connexions accounting
for 31% of all organisations with main responsibility. Careers services made up the
next largest share with 18%; closely followed by local authority education
departments at 17% (this probably included a large number of schools). Altogether,
24% of those with main responsibility were local authority based. Careers services or
Connexions undertook main responsibility for recruitment in about half of the
projects. This is perhaps surprising given the nature of the work these organisations
are involved in but in some cases may reflect the fact that Connexions was still at an
early stage in its development when recruitment was being undertaken. Indeed,
project managers commented that they hoped Connexions would take more of a lead
role with regards to recruitment in future years.
Eligibility Criteria
2.40 A range of eligibility criteria was put in place at a project level. The most frequently mentioned was that the young person had to be undecided about their future plans. Ninety seven percent of projects said this was important. Others which appear common were that the young person had:
• been involved with particular organisations (Social Services, Pupil Referral Unit etc) - 64%
• been nominated by schools specifically targeted through the recruitment campaign – 61%
• shown poor performance in examinations – 44%
• an ethnic minority background – 31%.
2.41 The profile of this years’ participants4 suggests that these criteria were quite well adhered to.
For example:
• 64% of young people had previous contact with a support agency (such as a social worker or Educational Welfare Officer - EWO)
• 88% achieved below a Level 5 in Key stage 3 English
• 16% had an ethnic minority background.
2.42 However, in terms of future plans a high proportion of respondents (90%) reported that they already had plans at the start of the programme. Future plans are discussed in more detail in Chapter Three.
Recruitment methods
2.43 On average each project spread their recruitment over four months. Some projects started recruitment as early as January whereas others began as late as July.
2.44 The main method of recruitment was via teachers or school nomination but as can be seen from Table 2.4 a variety of other sources were also used. This variation in methods used was echoed in discussions with project managers. Even if a set procedure for recruitment was outlined at the start this was often supplemented at a later stage in order to boost the numbers recruited to the target level. For example, in one area an initial mailout, which contained an invitation to an open day, attracted fewer than 20 people. Those involved locally then sought to work through schools, careers and the youth services to generate individual leads, which could then be followed up by the project manager. Despite these efforts there were still some places available and so friends of those who had joined were also approached.
Table 2.4: Recruitment methods
% Number of projects
Teacher / school nomination 94% 34
General marketing through schools 78% 28
General marketing through other organisations /media 78% 28
Careers service / personal adviser nomination 83% 30
Nomination via another service 81% 29
Other eg Youth Offending Team and detached youth workers
39% 14
Base: All projects specifying recruitment methods (36)
Note: Multiple response question therefore percentages do not add up to 100%
2.45 Discussions with project managers and other staff directly involved in recruitment revealed that a number of approaches to recruitment appeared to achieve more effective results:
• adopting a personal approach - eg one organisation in Oxfordshire (as part of the Milton Keynes, Oxfordshire and Buckinghamshire project) undertook one-to-one visits to the young person’s home environment to discuss the aims and objectives of the programme and deal with concerns raised by young people and parents/guardians
• build up relationships in the lead up to the main activities – eg a youth centre in Devon worked with young people over a series of months in the lead up to the main activities in order to provide them with full information about the experience
2.46 The recruitment issue remained pertinent across project areas. Personnel who had been involved in similar programmes before commented that the disengaged nature of the target group meant that problems surrounding recruitment were particularly acute.
Judging the effectiveness of recruitment
2.47 An assessment of the effectiveness of the various approaches adopted can be made by looking at the numbers achieved across project areas.
Numbers participating
2.48 With regards to those expressing an interest, 18 projects achieved 100% or more of their target, with a median of 295 being achieved across the 36 project areas. The overall numbers expressing an interest marginally surpassed the original target for enrolment.
2.49 The numbers who enrolled formally were down on those expressing an interest, with over 2000 fewer young people enrolled than initially expressed an interest. The actual level of fall out at this stage is even higher, as we know from our discussions with projects that more people were recruited between the expression of interest and enrolment stage.
2.50 The numbers taking part in the summer activities programme (taken as the number of young people participating in the main activities programme) fell significantly from those enrolled (down 20%). The average of 220 young people per project translates into an estimated 10,340 young people across the 47 project areas. This suggests that about three-quarters of the estimated number (14,000) was achieved. Table 2.5 tracks the changes in the proportions involved throughout the programme.
Table 2.5: Numbers of young people participating Original target Expressing an interest Formally enrolled Undertook main activity programme Number leaving during induction phase Number leaving during the main activity phase
Total 11,890 12,138 9,948 7,921 2,014 532
Mean 330 357 276 220 61 17
Median 298 308 257 193 48 7
Maximum 740 1,500 500 703 338 130
Minimum 30 4 25 20 0 0
Base: Projects specifying information on the number of participants (36)
responsibility. In other cases the partnership focussed very robustly on the target group and was reluctant to infill with young people that were outside the target group.
Table 2.6 : Projects achieving participant targets
Target Achieved
County Durham 170 229
South Yorkshire 578 703
Nottinghamshire 400 426
Fall out rates
2.52 An average of 61 young people left from each project during the induction phase, with a lower average of 17 leaving during the main activity phase. This ranged from some projects losing more than 300 before and 130 after compared with other projects losing none in the first phase and just two in the second. Information on rates of drop out proved difficult to monitor at a project level given the scale of infilling that took place as projects sought to ensure that the residential places they had booked were filled by someone. It was not atypical for a group of young people to be initially recruited and complete the induction activities and then be replaced with almost an entirely new group at a later stage. One of the case study partnerships encountered such difficulties after running a taster residential.
Table 2.7: Reasons for young people leaving the project early
Those leaving during induction phase*
Those leaving during the main activity phase**
% No % No
Got a job 19% 380 41% 218
Personal reason 10% 204 14% 74
Unhappy/prog. not suitable 9% 177 6% 30
Excluded from the programme 1% 11 9% 50
Other 11% 225 9% 50
Reason not known 50% 1,017 21% 110
Base: * Total young people leaving the project during the induction phase (2,014) ** Total young people leaving the project during the main activity phase (532)
2.54 Project managers referred to the disruption caused by young people leaving the project early. Some of the following problems were encountered when people left or new people joined the project:
• tracking young people and identifying progression routes became difficult
• the development of a cohesive working group was inhibited
• difficult to ensure that all aspects of the programme, including activities, guidance and support were delivered to all young people involved.
Delivering the project
2.55 This section details the different aspects of delivery involved in the summer activities project. A discussion of the main activities programme is followed by consideration of the pre and post activity intervention. The first section gives an overview of the scale of the project in terms of the number of participants and costs.
Scale of the project
Number of participants
reported using information from their local Careers Service Activities Survey5 to target their
recruitment. Others used more of a supply side model to define their target, aiming to recruit numbers based on resources available. In most cases it was a mixture of both types of methods.
2.57 Looking at the actual numbers achieved, most projects were delivering to 150 young people or more. Just four projects delivered to more than 400 participants and two projects to less than 50 participants. This is summarised in Table 2.8.
Table 2.8: Number of participants
% No
400 or more participants 11% 4
250-399 participants 19% 7
200-249 participants 19% 7
150-199 participants 17% 6
100-149 participants 17% 6
50-99 participants 11% 4
0-49 participants 6% 2
Base: All projects (36)
Project costs
2.58 Twenty-nine projects provided full details on the costs of the projects. The total cost across these areas was almost £5.3 million (£5,292,828) with much variation between projects. This ranged from a maximum of £420,805 to a minimum of £35,189. Using an average actual cost of £182,5116 the estimated cost of the project across 47 areas is almost £8.6 million,
(£8,578,017).
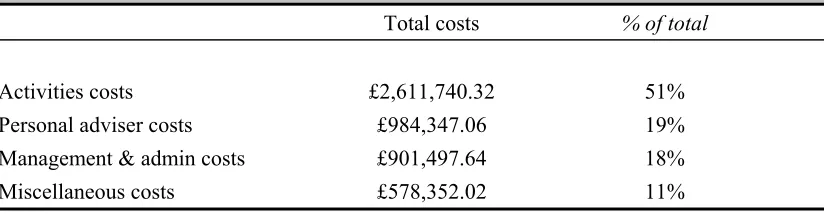
2.59 Table 2.9 gives a break down of costs into key component parts. Activities costs accounted for 50% or more of total costs in 16 projects. In one project it accounted for 88% of the total and in others this was down to just 21%.
5 For over a decade the Careers Service has collected data annually on young people completing Year 11. This is based on information collected through schools, local education authorities and other agencies.
Table 2.9 : Total actual costs
Total costs % of total
Activities costs £2,611,740.32 51%
Personal adviser costs £984,347.06 19%
Management & admin costs £901,497.64 18%
Miscellaneous costs £578,352.02 11%
Base: All projects specifying a breakdown of costs (28)
2.60 Variation between projects can also be illustrated by looking at costs per participants (where the number of participants is based on the numbers taking part in the main activity programme). Average cost per participant was £994, with a range between £1,759 in Hertfordshire and £496 in Nottinghamshire. With Hertfordshire delivering to just 20 young people compared to over 400 in Nottinghamshire it is likely that there were some reductions in cost due to economies of scale. To some extent the project in Hertfordshire still required a similar scale of resources in management and setting up costs even though they were delivering to a significantly smaller number than other projects.
2.61 The total costs to DfES across 29 projects totalled £4,539,983. Using an average of £162,142 per project the estimated total cost to DfES is £7.6 million, which is 89% of the estimated actual costs7.
The programme of activities
Approach to activity provision
2.62 Given the range and scale of activity providers that were brought in to deliver the summer activities projects it is reasonable to assume that projects were aiming to give young people as wide a range of activities as possible. Responses to questions about activity providers’ approaches confirms this. Over a third (37%) of activity providers said they were seeking to introduce a single new experience and a slightly higher proportion (44%) were seeking to equip young people with mastery of a particular practical skill. In most cases projects were aiming to give young people a taste of activities that they may not have encountered previously.
2.63 There was also much emphasis placed on reflecting on the learning experience. Eighty seven percent of providers said that they delivered sessions designed to encourage young people to reflect on what they had learned from their experiences. These reflection or review sessions were designed to involve young people in the learning experience and to try and encourage
7 Estimated actual costs are £8,578,017 (using an average of £182,511) and estimated DfES costs are £7,620,674 (using an average
them to extrapolate what they learned during the activities to what they were able to do in more everyday situations.
2.64 In some cases this emphasis on extrapolation culminated in a major team challenge or event. For example, in Staffordshire young people were given a ‘pot of gold’ to bid for an activity of their choice. Some chose to organise a day out in London with a guided tour of the Houses of Parliament by their local MP, while others organised a trip to Wales where the team built on their climbing skills developed during their initial residential. Overall, 50% of providers set up a programme of learning experiences leading up to a particular, challenging event.
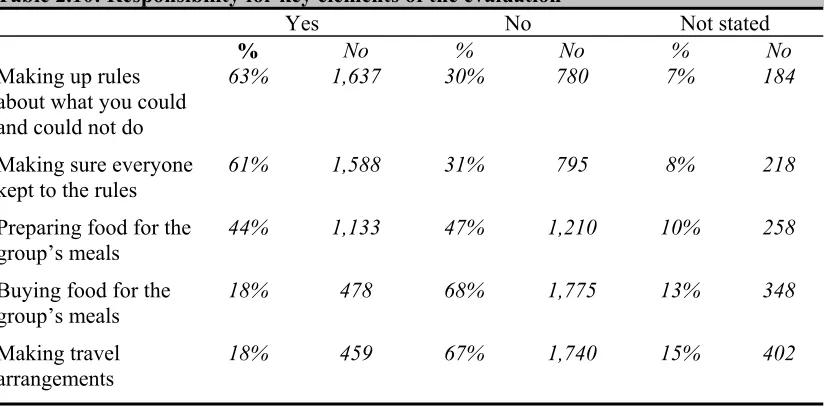
2.65 A key element behind the design of many of the programmes was the idea of empowering young people and it seems as though many of the providers were making good progress towards this. Providers encouraged young people to:
• develop personal goals and what they wanted to achieve from the activities – 88%
• develop rules for the group on acceptable behaviour - 88%
• implement and police rules for acceptable behaviour - 78%
• become involved in the organisation or planning of the activities - 72%
• design an element of the activities - 53%.
Table 2.10: Responsibility for key elements of the evaluation
Yes No Not stated
% No % No % No
Making up rules about what you could and could not do
63% 1,637 30% 780 7% 184
Making sure everyone kept to the rules
61% 1,588 31% 795 8% 218
Preparing food for the group’s meals
44% 1,133 47% 1,210 10% 258
Buying food for the group’s meals
18% 478 68% 1,775 13% 348
Making travel arrangements
18% 459 67% 1,740 15% 402
Base: All young people who went on a residential (2,601)
2.67 A wider discussion on the approach to activity provision can be found in Annex F, which contains a summary by Dr Peter Higgins and Dr Robbie Nicol of Edinburgh University of their booklet on ‘Learning as Adventure: Theory for Practice.’
Main activities
2.68 The vast majority of projects (98%) reported that they offered all young people the chance to undertake a residential activity. The majority of programmes offered a ‘choice of activities from a menu’ for either groups or individuals (42% respectively). Smaller proportions reported that groups (14%) were allocated to activities directly. Further choice was offered to young people within residential activities:
• 66% offered a partial choice of activities, that is, some choice within a structured core
• 19% offered limited choice (a programme set each day for the group as a whole)
• 11% offered a full choice with participants designing the programme of events. 8
2.69 Overall 87% of the young people who completed an end of programme questionnaire reported that they attended a residential – defined as ‘a stay overnight somewhere.’ Young people from four project areas reported that they had all attended a residential element whereas at the other extreme one project noted that just 38% of the young people had undertaken a residential visit as part of the programme.
2.70 A high proportion of projects (83%) gave young people the opportunity to undertake a non-residential activity. Evidence of take up of the non-non-residential element comes from the young
people themselves. Forty percent of all young people who completed an end of programme questionnaire reported that they attended a non-residential activity as part of the programme. This varied across project areas with a high of 82% in one project and as low as 12% in another.
[image:32.595.108.524.209.422.2]2.71 The types of activities undertaken as part of the non-residential element are shown in Table 2.11. Non-residential activities undertaken showed less of a focus on outdoor adventure activities, with a wider spread of activities and more inclusion of creative activities.
Table 2.11: Activities undertaken – residential and non-residential
Residential* Non-residential**
% No % No
Outdoor adventure activities on water 78% 2,017 39% 465
Outdoor adventure activities on dry land 78% 2,033 43% 514
Adventure activities in artificial environments
62% 1,615 27% 326
Problem solving 55% 1,434 27% 329
Expedition9 23% 603 5% 65
Voluntary work 10% 251 8% 100
Creative tasks 25% 663 27% 329
Indoor activities 54% 1,411 41% 494
Others 7% 193 26% 235
Base: * All who went on a residential (2,601) ** All who went on a non-residential (1,206).
Note: Multiple response questions therefore percentages do not add up to 100%
2.72 Seventy eight percent of young people with a personal adviser reported that they attended the residential in some capacity:
• 68% reported that the personal adviser stayed with them all of the time
• 10% reported that personal advisers were there some of the time.
2.73 Those with personal advisers who attended the residential went on to report that in terms of getting involved in the activities:
• 53% said the personal advisers did everything that they did
• 40% said the personal adviser did some of what they did.
2.74 Project managers and personal advisers themselves were able to comment on the benefits and drawbacks of personal advisers attending the main activity programme. In some respects it was a good opportunity for the personal adviser to witness learning and skills development in the young person which could then be extrapolated to situations back in their home environment. However, others were of the opinion that it was often best for people who were
9
not so closely connected to the young people to get the most out of them on the activity programme.
2.75 In addition to the main residential and non-residential activities, as well as the input from personal advisers, projects also incorporated the careers service within the design of its programmes. The careers service has much to offer, including:
• a remit to work with school leavers, many of whom share the characteristics of Summer Activity participants
• systems for tracking clients during the transition to further education or work
• good staff training and development systems
• staff with guidance skills.
2.76 Projects used these attributes to good effect by intervening in order to ensure participants were informed about their choices post 16. For example:
• in Hertfordshire the careers service carried out a two day interactive workshop session called ‘The Real Game’ helping the participants to write their CVs, develop awareness of their skills and qualities as well as an understanding of what employers are looking for. The participants completed paper-based self-analysis, activities and games. They set targets and discussed next steps. The careers service also offered the participants one-to-one sessions as a follow-up
• in Suffolk the careers service provided information about jobs and education through college prospectuses, ‘local routes’ leaflets, and set up laptops and printers with help programmes. The programmes included Kudos (suggests suitable careers), Higher Ideas (provides information about which A/ASLevels to choose) and Key Clips (information about jobs). Careers input was informal, participants had access to careers advisers and could book sessions in their free time throughout the duration of the programme
• in Derbyshire the careers service was very much an equal and active partner. Careers were involved from the start with responsibilities for recruitment and were able to ensure that consistent participant criteria were applied across schools. They also developed a comprehensive training programme for those undertaking a personal adviser type role. The agency targeted those leaving the programme early as a priority client group and applied the PROFILE client tracking system, which proved effective.
2.77 On average each participant spent three days on induction with an average of four days spent on post activity follow up. However, several projects were planning to undertake ongoing follow-up work into the new year.
2.78 The main activities undertaken during the induction phase centred around planning and preparing for the residential – 85% of all programmes offered this to all or some of its participants. A slightly smaller proportion (66%) offered an introduction to activities and taster days run by activity providers (68%). Other main activities undertaken were as follows:
• one to one inductions with personal advisers – 88%
• careers counselling/guidance – 83%
• group working sessions – 76%
• preparing individual action plans – 74%
• health and safety briefings – 69%
• counselling regarding choice of summer activities – 62%.
2.79 Smaller proportions offered formal sessions on drugs (32%) and examination support (34%).
2.80 High proportions of projects said they offered the following activities as part of the post activity stage:
• careers counselling/guidance – 97%
• one to one advice or counselling – 82%
• reviewing an individual action plan – 82%
2.81 The nature of the sessions offered during the post activity phase put greater emphasis on future plans and progression routes:
• support with course enrolment – 79%
• support after training courses have commenced – 68%
• formal sessions on benefits advice – 39%.
2.82 In addition, around two thirds of all programmes also offered awareness raising sessions on key issues relating to the target group. For example, 34% offered formal sessions on drugs, 34% sessions on sexual health and 31% offered formal sessions on race awareness.
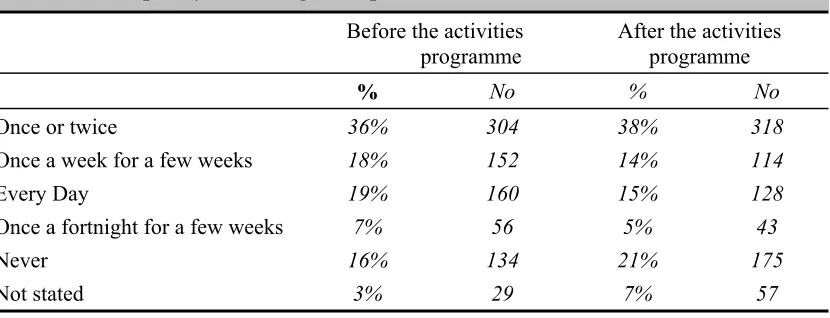
2.84 The end of programme questionnaire asked a series of questions about the involvement of personal advisers before and after the main activity programme and this is summarised in Table 2.12. Overall, a slightly higher proportion of all young people met a personal adviser before the activities programme (61%) compared to after the programme had finished (55%). Looking at just those with a personal adviser:
• most young people met their personal adviser just once or twice before and after the programme
• about a fifth met with their personal advisers every day
¾ 19% met with their personal adviser everyday before the activities
programme
¾ 15% met with their personal adviser everyday after the activities programme.
2.85 Furthermore, 71% of those with a personal adviser reported that they stayed with them throughout the entire residential and a further 11% reported that their personal adviser stayed with them for some of the time.
Table 2.12: Frequency of meetings with personal advisers
Before the activities programme
After the activities programme
% No % No
Once or twice 36% 304 38% 318
Once a week for a few weeks 18% 152 14% 114
Every Day 19% 160 15% 128
Once a fortnight for a few weeks 7% 56 5% 43
Never 16% 134 21% 175
Not stated 3% 29 7% 57
Base: All who have a personal adviser (835)
[image:35.595.109.529.688.769.2]2.86 For the largest groups of young people the nature of the meetings were the same both before and after the summer programme, that is, meetings tended to be held in groups of five or more young people (37% and 32% respectively). One to one meetings and a mixture of styles were also common. This is summarised in Table 2.13.
Table 2.13 : Nature of meetings with personal advisers
Before the activities programme
After the activities programme
% No % No
In groups of five or more young people 37% 247 32% 191
One to one 22% 146 27% 161
In groups of between one and four young people
15% 103 16% 95
Not stated 2% 13 2% 11
Base: *All who have a personal adviser and have met before the activities programme (672) **All who have a personal adviser and have met, after the main programme of
activities had finished (603)
Summary
Key statistics
Number of projects participating* 47
Estimated number of young people across 47 areas** 10,340
Local authority led partnerships 68%
Mean number of partners 6
Mean number of personal advisers 30
Total costs associated with delivering the programme £8.6 million
Total DfES support £7.6 million
* The information in this chapter is based on responses from 36 project areas.
** Based on a mean of 220 young people per project involved in the main programme of activities
.
2.87 Forty-seven pilot projects delivered summer activities projects to an estimated 10,340 young people. The structure of the partnership varied across the country in both scale (one to 31 partners) and type of lead organisation (68% were led by Local Authorities).
2.88 Other key personnel involved in the project were activity providers (average of 13 per area) and personal advisers with a mentoring type role (an average of 30 per area). Personal advisers were mainly sourced from local authority Youth Services and on average had received 1.3 days training, although personal advisers in six areas received none.
2.89 Actual project costs reached around £8.6 million with costs incurred by DfES reaching about £7.6 million. Costs per participant ranged from £496 to £1,759.
2.90 Over three-quarters (78%) of young people undertook outdoor adventure type activities on their main activity programme. Eighty percent of personal advisers attended the residential with 53% undertaking all the activities.
3
Characteristics of participants
Introduction
3.1 This chapter provides more detailed information on the types of young people who were involved with the pilots. In particular it looks at the characteristics of those young people who took part, why they were interested in doing so and what they wanted to get from their participation. The information used in this section is mainly derived from the start of programme questionnaires.10
3.2 The importance of looking at these baseline characteristics is two-fold:
• it provides a basis from which to gauge the progress made by the end of the project and thus the impact of the summer activities programme
• it enables us to assess the robustness of recruitment criteria and whether pilots have identified the target group.
Personal Characteristics
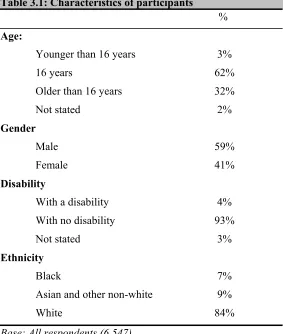
3.3 The summer activities programme sought to recruit 16 year olds who were leaving school and who were unsure of their plans. In the earlier stages of the programme it was anticipated that up to 14,000 young people would participate in the programme. In the event, approximately 10,340 young people participated in the summer activities programme.11 Table 3.1 outlines
the key characteristics of the group, which are discussed in more detail below.
Table 3.1: Characteristics of participants
%% %
Age:
Younger than 16 years 3%
16 years 62%
Older than 16 years 32%
Not stated 2%
Gender
Male 59% Female 41% Disability
With a disability 4%
With no disability 93%
Not stated 3%
Ethnicity
Black 7%
Asian and other non-white 9%
White 84%
Base: All respondents (6,547)
Age
3.4 Almost two thirds of the participants (62%) were aged 16, while the others were either older (32%) or younger (3%). Some of those aged 15 or 17 could still have been due to leave school and some young people may not have reached the age of 16 until June, July or August. Others may have missed a year of schooling (for example, due to illness). A number of projects widened the target age group after being unable to fill places with Year 11s. In-filling of places with participants from an older age group often took place at a later stage in the recruitment process but efforts were made to ensure that other eligibility criteria such as being undecided about future plans were adhered to.
Gender
3.5 There was a slightly higher proportion of boys (59%) in the 2001 cohort compared to girls (41%). In recent years there has been a national trend for boys to under-perform in public examinations. For example, in 2001 45% of boys achieved five or more A*-C grades at GCSE compared with 55% of girls12. In light of this trend and given the focus of the summer
12 GCSE/GNVQ and GCE/A/AS/VCE/Advanced GNVQ Results for Young People in England 2000,2001 (provisional statistics),
activities programme it seems reasonable that projects should be aiming to recruit a higher proportion of males.
Ethnicity
3.6 Across England, 11% of secondary school pupils13 come from ethnic minority backgrounds,
whereas 16% of the participants on the programme did. This is an increase of 4% on the pilot programme conducted in 2000. The recommendations made by the evaluation of the summer 2000 pilot programme stated that “given the relatively high proportion of young people ‘at risk’ who come from ethnic minority backgrounds, the pilot programme needs to ensure that it continues to reach a good representation of the ‘at risk’ group, rather than representation of the population as a whole.” The increase in the proportion of participants from ethnic minority backgrounds suggests that the projects are effectively targeting such ‘at risk’ groups.
Disability
3.7 In the UK around 3% of children aged 0-16 have a disability, while 4% of those on the programme reported that they had some sort of disability. Representation in terms of the population is good, although this indicates a fall in the proportion of disabled young people taking part since 2000 with fewer projects focussing wholly on this target group.
Academic performance
Key Stage Three Results
3.8 Participants were also asked to report on their academic performance in order to try and establish a baseline from which progress and the impact of the summer activities project could be measured.
3.9 Key Stage Three results were a good measure of gauging academic performance to date as most young people would not have achieved their GCSE results at the time of starting the summer activities programme. Table 3.2 shows the number of pupils achieving Level 5 or more in Key Stage Three English, Maths and Science assessments. The number of programme participants achieving scores of five or more is much lower than in England across each of the three subject areas.
Table 3.2: Key Stage Three attainment
% Achieving Level 5 or above
England 2000/2001* Programme Participants**
English 64% 22%
Maths 66% 23%
Science 66% 23%
* Source: The Autumn Package of Pupil Information, October, 2001. DfES **Base: All respondents (6,547)
GCSE Results
3.10 Overall, the 2001 cohort falls below the national average in terms of GCSEs entered. In England in 2001 91% of 15 year olds were entered for five or more GCSEs or GNVQ equivalent13. This compares with 79% in the summer activities 2001 cohort. A further 10%
were not entered for any GCSEs and 11% reported finishing between one and four GCSEs.
3.11 Looking at GCSEs actually obtained14 64% achieved more than 5 A*-G grade GCSEs,
compared with the National Average of 89%. Thus one quarter (25%) of participants were below the National Average and perhaps less motivated at the start of the programme.
3.12 While DfES made it clear within their guidance that the programme was not exclusively for those liable to a low level of attainment this characteristic is likely to be shared by those at risk during the transition from the school environment.
Other qualifications
3.13 In addition to mainstream GCSEs, 27% took other qualifications with the main ones being:
• General National Vocational Qualifications (GNVQs) – 8%
• Certificate of (Educational) Achievement – 7%
• Key Skills Units – 5%.
Special Educational Needs
3.14 Sixteen per cent of participants reported that their school thought they had special needs with 9% holding a statement of special needs arranged for them by their school. This is well above the national average for children with Special Educational Needs. For example, 2.5% of pupils at secondary schools held statements of SEN in 2001.15
3.15 In addition to specific special needs 64% had received help from a supporting organisation over the last couple of years. The main organisations they had received help from were16:
• Careers service – 43%
• Youth service – 24%
• Social worker – 13%
• Educational welfare officer – 9%
• Youth offending team – 7%.
• School attendance
3.16 School attendance records are another proxy indicator of participants’ motivation levels at the start of the programme. Over two thirds of participants held a good attendance record with 37% hardly ever missing school and 30% missing some school only because of illness. The remaining third can be regarded as a having a less impressive attendance record:
• 8% missed some school because they didn’t want to go
• 13% missed a lot of school because they didn’t want to go
• 7% were excluded17.
3.17 Once again the Department made it clear within their guidance that the programme was not exclusively for those with poor attendance records, but such characteristics are likely to be shared by those at risk during the transition from the school environment.
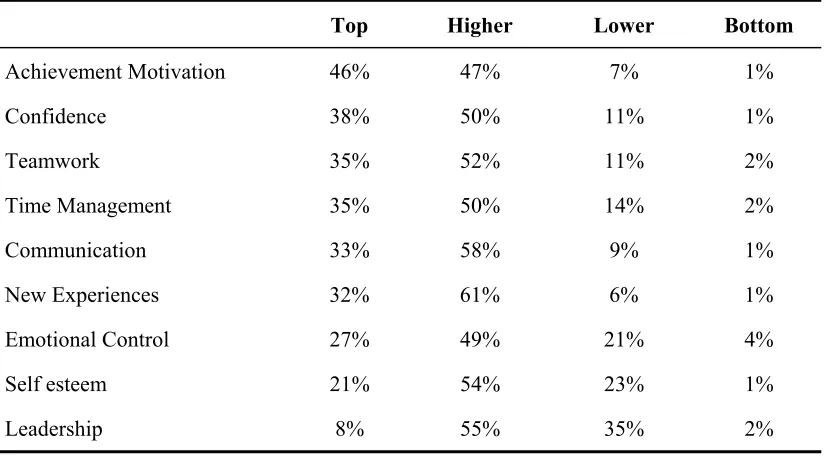
Levels of personal and social development
3.18 Both the start of programme and the end of programme questionnaires contained a series of statements against which participants were asked to rank their own ability or confidence on a four-point scale. The question comprised of a series of statements, which were grouped by personal and social development characteristics (self-esteem, confidence, teamwork, leadership, new experiences, communication, time management, achievement motivation and emotional control). For example, with regard to self-esteem, young people were asked whether they agreed fully, a lot, a little or disagreed with each of the following:
• I feel good about myself
• other people my age generally like me
• I’m the first to volunteer.
16 Note that this was a multiple response question.
3.19 The personal and social development characteristics were drawn together from a range of sources including Neill’s Life Effectiveness Questionnaire (LEQ)18 – a measure of personal effectiveness that has already been used elsewhere to evaluate outdoor education programmes.19 The selected personal and social development characteristics also match the
original objectives of the scheme as outlined by DfES.
3.20 Participant ratings were then turned into a ‘score’ for each personal and social development characteristic. The overall responses were divided into quartiles to allow comparison across each of the characteri