Harnessing Technology: Schools Survey 2008
Report 1: Analysis
Paula Smith, Peter Rudd and Misia Coghlan
National Foundation for Educational Research
Table of contents
Executive summary ... 4
1. Introduction ... 10
Background ... 10
The Harnessing Technology strategy ... 10
Survey respondents ... 12
The structure of this report ... 17
2. Technological infrastructure ... 18
Key points ... 18
Introduction ... 18
ICT equipment ... 19
ICT infrastructure ... 20
Connectivity ... 21
3. Management, leadership and administration ... 24
Key points ... 24
ICT strategy and leadership ... 25
Use of ICT for managing and monitoring ... 29
Communication and collaboration ... 30
ICT finance ... 30
Purchasing ... 32
Safety and security ... 34
4. Using technology for teaching and learning... 36
Key points ... 36
Introduction ... 36
ICT resources for teaching and learning ... 37
Access to ICT resources ... 38
ICT for use in lessons and across the curriculum ... 39
E-assessment and reporting ... 42
5. Practitioner perceptions and continuing professional development ... 44
Key points ... 44
Introduction ... 44
Teachers’ attitudes towards ICT ... 44
Views on the impact of ICT ... 46
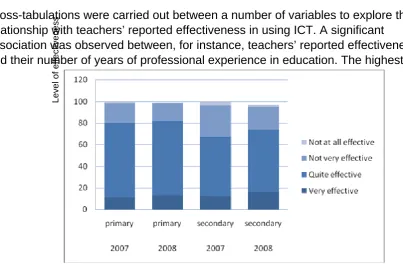
Teacher effectiveness ... 47
Continuing professional development ... 49
Introduction ... 50
Home access ... 51
Learning platforms ... 52
Personalising learning ... 56
7. Overview ... 57
Changing features ... 58
Adoption or transformation? ... 59
Future priorities ... 60
Executive summary
Introduction
This report summarises the main findings from the Harnessing Technology Schools Survey 2008, a national survey of ICT (information and communications technology) in primary, secondary and special schools. The National Foundation for Educational Research (NFER) carried out the survey on behalf of Becta in December 2007 and January 2008. The annual, representative survey is intended to assess the ‘state of the nation’ in terms of the uptake and impact of educational technologies in
maintained schools across England. The survey has been running since 2002 under different names.
One of the key aims of the 2008 schools survey was to collect information that will help Becta assess progress towards the aims and outcomes of the original
Harnessing Technology strategy, devised by the DfES in 2005, the revised strategy – Harnessing Technology: Next Generation Learning 2008–14 – and the Children’s Plan, published in 2007, and to make strategic decisions based on the latest
developments in ICT related to schools.
Key findings
Technological infrastructure
There have been some improvements in the quantity of hardware provision. For example, average numbers of interactive whiteboards have risen considerably in both primary and secondary schools since 2007. Pupil–computer ratios (which can be defined in a variety of ways) have been improving. In primary schools in 2008, there was an average of 13.9 pupils to every desktop computer and an average of 31.8 pupils for every laptop. In secondary schools, there were on average of 4.3 pupils for every desktop computer, but an average of 61.4 pupils for every laptop.
The vast majority of teachers reported that their computers were connected to a network: this was true for 94 per cent of secondary respondents, 69 per cent in primary schools and 66 per cent in special schools. Respondents were mostly positive about the speed, reliability and file-handling capabilities of their networks. In addition, most schools had their own websites, and around four-fifths of schools reported using this to provide information and resources for parents.
Management, leadership and administration
Most schools had a written strategy or improvement plan for ICT and/or e-learning, and generally these were reviewed on an annual basis.
for around one-third of primary schools and just under half of secondary schools. Using technology for personalising learning was a priority area for 40 per cent of secondary schools in 2008 compared with one-quarter of primary schools.
Across each of the three school sectors, local authorities and ICT
consultants/advisers were key sources of information for schools in terms of influencing their ICT strategies or improvement plans.
Using computers for teaching and learning
Interactive whiteboards are the dominant technology in schools, and technology continues to be used primarily for presentational purposes. Display technologies are important, but there is scope for encouraging more engaged and interactive forms of teaching and learning using ICT. Linked with this, there is considerable opportunity for the further development of flexible learning based on increasing the use of mobile devices.
There is also much scope for the development of the use of social software for learning; at present, social software is reportedly used in only one in 20 schools.
Over 90 per cent of secondary schools reported offering their pupils a secure area for storing their work; this was similar to the percentage in 2007.
Teachers’ use of digital learning resources, especially self-created resources, is increasing, with a quarter of teachers uploading such resources at least once a week. There have also been increases in the proportions of teachers sharing digital resources.
In terms of access to ICT facilities, school populations appear to have good access, and there is flexibility to accommodate pupils’ use of facilities outside normal lesson times, but community access to ICT facilities remains somewhat limited.
In many respects, at a national level, the development of e-assessment is still in its early stages. Technology tends to be used for reporting pupils’ progress rather than for interactive forms of assessment.
Practitioners’ perceptions and continuing professional development
The majority of teachers across all sectors are confident and enthusiastic about using ICT. The substantial majority of ICT co-ordinator respondents (77 per cent) reported that teachers in their schools were either very confident or quite confident with ICT. Similarly, this sample reported that all or nearly all teachers were
Teachers were largely positive about the potential contribution of new technologies to learning. For example, around three-fifths of teacher respondents agreed with the statement that pupils enjoy lessons more if they use ICT than if they do not. Across all three sectors, there was agreement generally that ICT plays a positive role in engaging pupils in learning, having an impact on attainment and in terms of personalising learning.
With respect to training and support, informal, in-school ICT support from colleagues clearly emerged as the form of training rated most positively by teachers. Almost all teachers had accessed this form of support, and just fewer than nine out of 10 found it a good form of training.
Special themes: home access, learning platforms, personalising learning
According to school leaders’ estimates, a digital divide still exists: the mean
proportion of pupils across all three school sectors who did not have home access to a computer was 30 per cent. There were some differences between sectors:
secondary schools had the highest levels of home access, with only 17 per cent of respondents reporting that their students did not have access; primary schools reported 27 per cent of pupils not having home access, and special schools reported 44 per cent of students not having home access.
The use of learning platforms by schools is increasing. In all sectors, the
percentages of schools with learning platforms had increased from 2007: secondary schools experienced the biggest increase. The most common uses for a learning platform were, firstly, as a repository for documents for learning and teaching and, secondly, as a store for digital learning resources.
The use of technology to support the personalising of learning is important for school leaders, but it is not the most important consideration; ICT infrastructure and teacher skills appear to be more important priorities at present. Teachers have mixed views about the impact of ICT on personalising learning.
Overview: changing features
It seems that in many respects ICT across the school landscape has not changed dramatically since 2007. But where there have been changes, these have been important in that they reflect positive developments in the use of, and attitudes towards, technology for teaching and learning.
Several longer- and shorter-term trends have continued. One of the most noticeable of these is probably the continued improvement in the ICT infrastructure and in the numbers of devices available to schools. For example, average numbers of
number of learning platforms in use has increased. In addition, more than nine out of 10 schools now have their own websites.
These technical developments have been accompanied by important ongoing changes in attitudes towards, and confidence in, the new technologies, particularly among teachers and school leaders. The survey findings revealed that the majority of teachers, across all school sectors, were confident and enthusiastic about using ICT. Perhaps one of the most significant survey findings was that teachers’ use of digital learning resources is increasing, with one-quarter of teachers uploading such resources at least once a week.
Teachers are also positive about the benefits and the potential contribution of new technologies to learning. For example, a substantial majority of teacher respondents took the view that pupils enjoy lessons more if they use ICT than if they do not. Across all three sectors, there was agreement generally that ICT plays a positive role in engaging pupils in learning, having an impact on attainment and in terms of
personalising learning.
Adoption or transformation?
The Harnessing Technology strategy has enabled schools and practitioners to make good progress through the adoption stage, but it seems that there are important barriers to overcome before the ambition of transformation can occur. Indeed, the research findings from these surveys of schools in England are consistent with the findings from a report into ICT use in schools in Wales, which concluded that there had been ‘good progress… but not transformation’ (Department for Children, Education, Lifelong Learning and Skills, 2008, pp.1–18). Other findings also suggested that schools’ use of ICT is not yet at a transformational stage (and that the landscape, in some respects, is not changing). These findings were
predominantly related to the special themes mentioned above, which are:
• Home access: The school leaders’ survey revealed that the estimated mean proportion of pupils across all three school sectors who did not have home access to a computer was 30 per cent. There is a still a digital divide regarding home access to ICT, which is seriously hampering progress towards the goals of closing the gap between those from disadvantaged backgrounds and their peers, and bringing the full benefits of ICT to every child.
• Learning platforms: Although, as noted above, the use of learning platforms by schools is increasing, progress is limited. Substantial
is also evidence that the culture of classroom technology use is still geared primarily towards display and presentational functions.
• Personalising learning: Although most teachers were optimistic about the potential contribution of ICT to personalising learning, teachers have mixed views about this. Furthermore, although the use of technology to support the personalising of learning was important for school leaders, it was not their top priority.
Future priorities
These issues are not new to Becta or other stakeholders involved in this field of education. Indeed, it is important to acknowledge that, to some extent, these problems have already been recognised and measures have been initiated to
address them. For example, the Computers for Pupils scheme was targeted at pupils from socio-economically deprived areas, and Becta has commissioned research on reducing social inequity with technology.
An overview of the Harnessing Technology Schools Survey findings for 2008
suggests some important areas that merit further attention. The two most prominent of these appear to be a need to:
• look further at how technology can be used for developing partnerships between parents and schools
• support and encourage teachers and schools to use technology in ways which are more engaging for learners.
Evidence from these surveys suggests that community access to schools’ ICT facilities is still somewhat limited and that, even where technological and virtual forms of communications with parents exist, these tend to be one way and not interactive. The whole area of community–parent–child–teacher–school
communication is important, especially in the current context of the Children’s Plan and the Every Child Matters agenda.
Understandably, it takes time to embed new technologies, and the simpler technological functions will inevitably be used first, but there does seem to be
evidence to suggest much potential for the more engaging use of learning platforms, school networks, and devices. Formal training sessions for school staff, greater use of mobile devices and of social software, and more active forms of assessment, for example, might help encourage better learner engagement.
1. Introduction
Background
This report sets out the main findings from the Harnessing Technology Schools Survey 2008, a national survey of the use of ICT (information and communications technology) in primary, secondary and special schools in England. The National Foundation for Educational Research (NFER) carried out the survey on behalf of Becta in December 2007 and January 2008.
The Harnessing Technology Schools Survey is an annual, representative survey, commissioned by Becta, and intended to assess the ‘state of the nation’ in terms of the uptake and impact of educational technologies in maintained schools across England. Nationally representative data on ICT in schools has been collected annually since 1998 through the ICT in Schools Survey (1998–2004) and the evaluation of Curriculum Online (2002, 2003 and 2005). Comparisons with the findings from the 2007 survey (Kitchen et al, 2007), where relevant, are provided throughout this report.
This report is one of two volumes. This document, Report 1, presents the main findings and analyses from the 2008 Harnessing Technology Schools Survey and discusses some of the implications of these findings. A companion report, Report 2, presents the data in a more systematic fashion in an easy-to-use data reference document. In this second report, the findings from every question in each of the three surveys (for school leaders, ICT co-ordinators and teachers) are set out in tabular form. The findings for each question are also set out by school sector: by primary, secondary and special school sub-samples.
The Harnessing Technology strategy
In March 2005, the Government published the original Harnessing Technology strategy, designed by the (then) DfES to set out a five-year plan for a system-wide approach to the application of ICT in education, skills and children’s services.
• improved personalised learning experiences
• confident system leadership and innovation
• technology–confident, effective providers
• engaged and empowered learners
• enabling infrastructure and processes.
The Children’s Plan is another important driver of the e-strategy. In January 2008, the schools minister asked Becta ‘to factor in the recommendations of the Children’s Plan into the next stage of our e-strategy, building on what we have achieved
already’ (DCSF, 2008). It has been stressed that the unifying theme of the Children’s Plan is a partnership between schools and parents, and in this respect certain
elements of the Harnessing Technology strategy, such as home access to computers, and school–parent communications, have taken on increased importance in 2008.
In this context, one of the key aims of the 2008 schools survey was to collect information that will assist Becta with assessing progress towards the aims and outcomes of the revised Harnessing Technology strategy and the Children’s Plan, and to make future strategic decisions based on the latest developments in ICT related to schools. All three survey questionnaires were informed by the strategy and included questions on specific elements of the strategy, such as the quantities and fitness for purpose of computer devices, home access, assessment, and uses of the technologies for teaching and learning. A broader goal was to assess progress towards the transformation stage of the strategy.
It was not within the remit of the 2008 survey to examine progress in all aspects of the Harnessing Technology strategy, and this project was only one of many that Becta commissioned for this purpose. The findings from these surveys therefore should be considered alongside other key research projects that took place at the same time as the survey work. These projects included the Harnessing Technology Local Authorities survey, a study on reducing social inequity with technology, and ongoing research on personalising learning.
There was also previous work on ‘e-maturity’, because assisting schools with
developing their level of e-maturity will help them deliver the full benefits of ICT. Part of this process involves assisting schools in better mapping their progress and comparing their levels of development with those of similar schools. For this
purpose, Becta has devised a self-assessment framework which enables schools to map out where they are in terms of technological developments and provides them with the option, when suitable progress has been made, of applying for nationally recognised ICT accreditation.
sample selection and respondents’ characteristics. The next section summarises the characteristics of the respondents from each of the three different sample groups.
Survey respondents
Characteristics recorded included gender, years of professional experience and current role. In the case of teachers, information was also provided on the primary subjects and the key stages that they teach.
Gender
[image:12.595.135.462.376.577.2]The pattern of distribution of the gender of respondents within each of the sample groups may be interpreted as fairly typical (Figure 1).
Figure 1: Gender of respondents (%)
Secondary school teachers and special school ICT co-ordinators were the least disparate in terms of whether respondents were male or female, with a slightly more
even distribution between the two genders compared with other respondent types.
In primary schools, respondents were typically female, and this was especially the case among the teacher sample (which is reflective of primary schools). In
secondary schools, there were higher distributions of male compared with female respondents at senior leader and ICT co-ordinator levels.
Professional experience in education
As Table 1 shows, the senior leaders who completed the questionnaire, across each of the school sectors, tended to have over 10 years’ experience in education.
ICT co-ordinators in primary and secondary schools were fairly evenly mixed in terms of how many years of experience they had, with similar proportions in each of the different categories. The ICT co-ordinators in the special schools, by contrast, tended to be more experienced, with just over 40 per cent reporting 20+ years’ experience in education.
Regarding the teachers who completed the questionnaires, in primary schools, again, the distribution was fairly even across the different categories.
Table 1: Number of years of professional experience in education (%)
Senior leader ICT co-ordinator Teacher
0–5 years
6–10 years
11–20 years
20+ years
0–5 years
6–10 years
11–20 years
20+ years
0–5 years
6–10 years
11–20 years
20+ years
Primary 3 13 30 53 21 27 27 26 22 28 22 25
Secondary 4 4 31 60 23 22 28 27 12 24 28 34
Special 1 7 21 70 15 17 24 42 12 20 25 40
Current role in school
As Figure 2 demonstrates, the senior leader questionnaire tended to be completed by headteachers, deputy headteachers, and assistant headteachers.
Figure 2: Senior leader: current role in school (%)
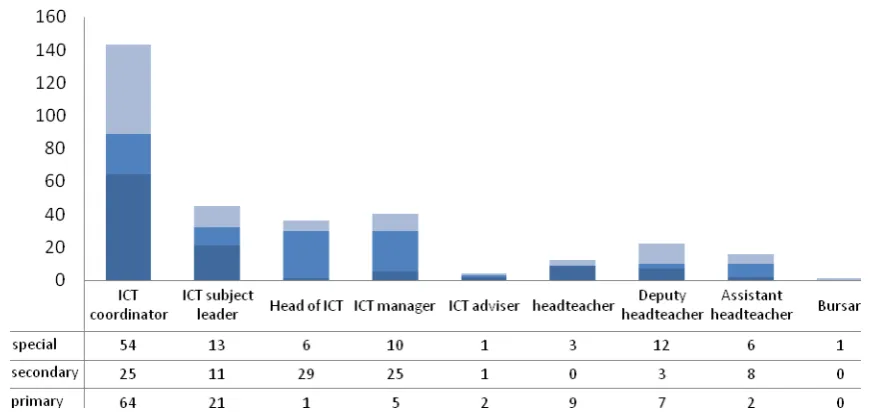
Figure 3 shows that individuals with the title ‘ICT co-ordinator’ tended to complete the questionnaire in the primary and special schools. In secondary schools,
[image:15.595.79.518.487.697.2]responsibility for completing questionnaires was fairly evenly spread among ICT co-ordinators, heads of ICT and ICT managers.
Figure 3: ICT co-ordinator: current role in school (%)
respondents were fairly evenly mixed between subject co-ordinators and class teachers.
Subject and key stage
[image:16.595.173.401.337.529.2]Teachers were also asked to say which subject they were primarily responsible for teaching and which key stage they taught. As can be seen in Figures 4 and 5, the distribution of teachers across each of the subjects reflects the context of individual school sectors, with a good balance of respondents from each subject area. The distribution in special schools was similar to that observed in primary schools.
Figure 5: Subject taught: secondary
Teacher respondents in primary schools were fairly evenly distributed across Key
Stages 1 and 2, with slighter fewer respondents in the foundation stage. At
secondary level, slightly more respondents reported teaching Key Stage 3 compared with Key Stage 4.
The structure of this report
This report uses a narrative approach to present the findings from the Harnessing Technology Schools Survey 2008, drawing upon findings from each of the
questionnaires (senior leader, ICT co-ordinator and teacher) as and when
appropriate. A more systematic and detailed presentation by sample, question and school sector is presented in the accompanying data report (Report 2). Subsequent chapters of this report examine the following key themes from the Harnessing Technology strategy:
• Chapter 2: Technological infrastructure
• Chapter 3: Management, leadership and administration
• Chapter 4: Using technology for teaching and learning
• Chapter 5: Practitioner perceptions and continuing professional development
• Chapter 6: Special themes: home access, learning platforms, personalising learning
2. Technological infrastructure
Key points
• There have been some improvements in the quantity of hardware
provision. For example, average numbers of interactive whiteboards have risen considerably in both primary and secondary schools since 2007.
• In primary schools in 2008 there was an average of 13.9 pupils to every desktop computer and an average of 31.8 pupils for every laptop. In secondary schools, there were, on average, 4.3 pupils for every desktop, but an average of 61.4 pupils for every laptop.
• In four-fifths of secondary schools, day-to-day responsibility for
maintaining the school network was the job of a dedicated, school-based ICT technician (but this was a decrease since 2007). Primary schools using dedicated technicians decreased from 19 to 15 per cent.
• The vast majority of teachers reported that their computers were connected to a network: this was true for 94 per cent of secondary respondents, 69 per cent in primary schools and 66 per cent in special schools. Respondents were mostly positive about the speed, reliability and file-handling capabilities of their networks.
• There were good levels of satisfaction with internet access, speeds and reliability. In addition, most schools now have their own websites, and around four-fifths of schools reported using their websites to provide information and resources for parents. This information, however, was mostly one way, and individual, interactive communications with parents were rare.
Introduction
The new phase of the Harnessing Technology strategy aims to bring about a step-change in the way technology is used across the breadth of the education and skills system. Learners should be able to access resources at any time and from
anywhere. This requires the technological infrastructure to be developed to create an e-confident system in which high-quality digital resources are available wherever and whenever learning takes place. This section summarises some of the main findings from the 2008 Harnessing Technology Schools Survey relevant to these goals, including findings relating to:
• ICT equipment
• ICT infrastructure
ICT equipment
A range of questions in the ICT co-ordinator questionnaire gathered information about ICT equipment in schools, both in terms of availability and fitness for purpose.
Interactive whiteboards continue to be a dominant technology in schools. The average numbers of interactive whiteboards rose considerably in both primary schools (18 compared with just over six in 2005 and eight in the 2007 survey) and secondary schools (38, compared with 18 in 2005 and 22 in 2007). The fitness for purpose of interactive whiteboards is rated very positively in all sectors.
The average numbers of desktop computers available to pupils in primary schools have changed very little since 2007 (remaining at around 27 per school). In
secondary schools, the average has decreased from 260 in 2007 to 246 in 2008.1 The average pupil-to-computer ratio in 2007 was 6.6 pupils to every computer in primary schools, with slightly fewer pupils to computers in secondary schools – an average of 3.6 pupils to every computer. In 2008, this ratio had changed slightly in primary schools with an average of 6.25 pupils for every computer, but had remained the same in secondary schools. In special schools, there was an average of 2.6 pupils to every computer.
Separate ratios were calculated for numbers of desktops and laptops. In primary schools, there was an average of 13.9 pupils to every desktop computer, and an average of 31.8 pupils for every laptop. In secondary schools, there were far fewer pupils (on average) sharing desktop computers, with an average of 4.3 pupils for every desktop, but almost double the number of pupils sharing a laptop (in
comparison with the number in primary schools), with an average of 61.4 pupils for every laptop. In special schools, the ratios were considerably lower, with an average of 3.2 pupils for every desktop computer and 16.5 for every laptop.2
The survey findings indicate that, on average, primary pupils have more access to laptops than do secondary pupils. Also, when asked to rate laptops for fitness for purpose, primary school respondents were more positive than those in secondary schools (46 per cent said ‘very good’ in primary schools compared with 29 per cent in secondary schools). These findings also confirm a trend already highlighted in the 2007 survey: while 92 per cent of secondary schools rated laptops as quite good or very good in 2002, this proportion has fallen slightly over the years and is now at 83 per cent.
1
There are different methods for calculating the average number of computers per school. To obtain these figures, schools where either the teachers or the pupils were reported as having no computers were excluded from the analysis.
2
The survey indicates that the availability of other types of devices for teaching and learning (such as graphics tablets and voting pads, for instance) varies considerably between schools, and that this is true of all sectors.
Not surprisingly, more special schools than primary or secondary schools have assistive technology devices for pupils with special needs, although almost of half of secondary school respondents had devices to support sensory access.
When asked to rate whether their schools had enough ICT equipment to deliver the curriculum adequately, secondary school respondents rated the amount of each type of equipment less positively than did primary and special school respondents. This was particularly the case with respect to interactive whiteboards and desktop computers, but less so with laptops.
ICT infrastructure
ICT co-ordinators were asked a range of questions about the ICT infrastructure. These questions were targeted at collecting information about the types of network, the network speed, who managed the network and whether schools thought their networks met their needs. ICT co-ordinators were also asked about which operating system their schools used. Furthermore, teachers were asked to provide information about the frequency with which technical problems prevented delivery of their
lessons.
In secondary schools, day-to-day responsibility for network maintenance is usually the job of a dedicated school-based ICT technician, though was less the case than in previous surveys (down from 94 to 80 per cent since 2007). The proportion of
primary schools with dedicated school-based ICT technicians, already much lower, had also fallen (from 19 per cent in 2007 to 15 per cent in 2008). This suggests a trend in both sectors towards the outsourcing of technical support to externally managed services.
Secondary schools were better resourced in terms of technical support staff than primary and special schools. They employ an average (mean) of 2.5 technical support staff, with a maximum reported number of six such staff in any one school. The average full-time equivalent (FTE)3 number of technical support staff in
secondary schools was 2.4. In special schools, there was an average (mean) of one member of technical support staff per special school and an average FTE of 0.5. In primary schools, the average (mean) number of technical staff was 0.6, with an average FTE of 0.1. Around a quarter of secondary schools provide technicians for other schools or colleges.
3
Monitoring the network remains predominantly ‘ad hoc according to need’ in all sectors, although there has been a slight trend this year towards monitoring to a pre-determined schedule. Secondary schools monitor more frequently than do the other two school sectors.
There is considerable uniformity in the type of operating system used in schools – this is almost always Windows, usually Windows XP. The vast majority of secondary school respondents (94 per cent) said that all their computers were connected to a network, compared with 69 per cent in primary schools and 66 per cent in special schools. The common type of computer network in schools continues to be a fat client network, in which data is stored on a server but computers can usually still work if the network is not available. It is unusual for schools in all sectors (but especially secondary schools) not to be on a client–server network.
Wireless technology is more established now in secondary schools than previously, particularly in networks accessed by teaching staff. Changes in the nature of the data collected, however, make it difficult to report specific trends in this area.
Network speed is also higher in secondary schools, with 29 per cent reporting backbone speed at over 1Gbps compared with only 8 per cent of primary schools and 11 per cent of special schools. Almost all schools in all three sectors said that their network performance was sufficient to handle large multimedia files.
Technical problems preventing delivery of lessons do not occur very often. This is particularly true of problems with interactive whiteboards (over a third of respondents said that problems occurred less than once a term). Printers cause the most
problems: around half of respondents experienced printer problems at least once a month. Secondary schools generally reported a lower incidence of problems with ICT equipment (corresponding to higher levels of dedicated technical support).
Connectivity
One of the priorities within the Harnessing Technology strategy is to improve online information-sharing by creating more open and more accessible systems. To assess progress towards this priority, the 2008 School Survey asked ICT co-ordinators a range of questions about connectivity in their schools. These included questions about their schools’ internet connections, whether their schools had websites, and information about school intranets. Further information about connectivity was also collected via the teacher survey: teachers were asked about storing digital learning resources on their schools’ networks and access to their schools’ networks.
Staff and pupils generally have internet access in secondary schools (73 per cent), while in primary schools, pupils generally have access under supervision (64 per cent). These proportions are almost identical to those reported in 2007.
Similarly, classroom access to the internet remains broadly similar (97 per cent in primary schools and 82 per cent in secondary schools) to that in 2007, although access by means of a dedicated ICT room had fallen in both primary and secondary schools between 2007 and 2008 (from 74 to 67 per cent and 96 to 76 per cent respectively).
There is a high level of satisfaction with the speed of internet access across school sectors, with only around 8 per cent of respondents saying that the connection was not fast enough for their requirements. This compares with 30 per cent of primary school respondents and 13 per cent of secondary school respondents in 2002,
although satisfaction rates have levelled out over 2007. Internet connections are also widely reported to be reliable at least most of the time.
Most schools have their own websites, which usually serve to provide school news and parent resources such as a calendar of events and school policy documents. Around 80 per cent of primary and secondary schools were using their school
websites for providing resources to parents. This percentage had almost doubled for both primary and secondary schools in comparison with the 2007 survey findings, which clearly represents an important step towards bridging the gap between home and school. The percentage was slightly lower in special schools, but was still well over half.
Very few schools, however, used their websites to communicate directly with individual parents: only 4 per cent of primary schools, 3 per cent of secondary schools and none of the special schools were using their school websites to do this; these reflected similar findings in 2007.
There has also been little movement towards other types of website use, such as providing access to management information systems and learner performance information, and enabling homework upload or download.
Learner access to technology at any time and in any place, a key part of the Harnessing Technology strategy, has not yet been achieved across all school sectors, as the following analysis of secure login areas and access to school intranets and learning networks shows.
Secure login areas are not yet offered as a matter of course to all members of the school community. For instance, of the 44 primary schools that provided a response to this question, almost all said that teachers were offered secure login areas
although a slightly higher proportion of pupils were reported as having a secure login area compared with pupils in primary schools.
School intranets are currently much more embedded in secondary schools than in primary or special schools. Access to intranets is almost always offered to teachers and other school staff, but less commonly to pupils and very infrequently to parents. This suggests that intranet access may be a potential way of improving school– parent communication.
Remote access to learning networks is again a feature mostly of secondary schools, and learning networks are available to teachers and senior staff rather than to pupils. Of the 49 primary schools that provided a response to this question, just under half said that senior teaching or administrative staff could access the school’s network for learning externally, and 20 said that other teachers had similar access. Only 12 out of 49 primary schools reported that pupils were also able to access the school’s network externally. In secondary schools, of the 101 schools that answered this question, 81 said that senior teaching or administrative staff could access the
3. Management, leadership and administration
Key points
• Most schools had a written strategy or improvement plan for ICT and/or e-learning, and generally these were reviewed on an annual basis. Local authorities and ICT consultants or advisers were key sources of
information for many schools, influencing their ICT strategies or improvement plans.
• Using learning platforms was a priority over the coming year (2008) for just over half of secondary schools, just over one-quarter of primary schools, and just under one-third of special schools.
• Improving communication with parents remained a high priority for around one-third of primary schools between 2007 and 2008, compared with just under half (48 per cent) of secondary schools – up 3 per cent from 2007.
• Using technology for personalising learning was a priority for 40 per cent of secondary schools this year (2008), compared with one-quarter or primary schools.
• Across each of the three school sectors, local authorities and ICT
consultants or advisers were undoubtedly key sources of information for schools, influencing their ICT strategies or improvement plans.
• Over 90 per cent of secondary schools reported offering their pupils a secure area for storing their work; this was similar to the percentage in 2007. Forty-nine per cent of primary schools offered this facility to all pupils, and 40 per cent offered it to some.
One of the priorities in the Government’s Harnessing Technology strategy is to provide school managers and senior leaders with the support, skills and
infrastructure to enable them to transform learning and teaching in their schools. The 2008 Harnessing Technology School Survey included a range of questions on ICT management, leadership and administration in schools, which were designed to measure progress in this area. This chapter presents findings from these questions. It includes:
• ICT strategy and leadership
• use of ICT in school management
• communication and collaboration
• ICT finance
• purchasing
ICT strategy and leadership
A range of questions included in the senior leader questionnaire gathered
information about ICT development strategies in schools. The aim was to understand whether schools had written ICT strategies and what areas they were prioritising over the next few years.
Most schools had a written strategy or improvement plan for ICT and/or e-learning, and generally these were reviewed on an annual basis. For the majority of schools, the strategy or plan was embedded within the whole-school improvement plan. This was the case across 70 per cent of primary schools, 65 per cent of secondary schools and 71 per cent of special schools. Just under a quarter of schools in each sector reported a separate ICT strategy or plan. These percentages reflect similar findings from the 2007 survey.
Encouragingly, the existence of an ICT plan or strategy appeared to be
commonplace in schools across all sectors. However, clearly there is a difference in approach between schools that choose to embed their ICT strategies at a whole-school level and those that decide to keep them separate. This disparity in approach is comparable across all school sectors. This raises issues about the rationale behind the decision to embed ICT plans or produce a separate plan, and what the main influences are on this decision. For example, is the decision affected by the size of school, or the type of staff involved in deciding the ICT strategy? These questions perhaps warrant further investigation in the 2009 school survey.
While, proportionally, primary, secondary and specials schools were similar in terms of whether their ICT strategies were embedded or separate, the profiles of the staff involved in developing the strategies were quite different.
Secondary schools tended to have more dispersed involvement across a range of school staff in developing the ICT strategy, compared with their primary school colleagues. In secondary schools, the school leadership team (90 per cent of schools) and ICT co-ordinator (90 per cent) were heavily involved, as were other members of staff, such as ICT technical staff (72 per cent) and headteachers (81 per cent). Overall responsibility for the ICT strategy in secondary schools was split
between the school leadership team and ICT co-ordinator: around a third of secondary schools in each case.
their school leadership teams, but in 2008 the figure was 66 per cent. The picture in special schools was similar to that in primary schools.
Priorities within schools’ ICT strategies
For schools across each of the sectors, replacing equipment was commonly reported as one of the elements of their current ICT strategies: it was reported by around 80 per cent of schools in each of the sectors. Around three-quarters of secondary schools also highlighted, as part of their ICT strategies for 2008, investing in their schools’ ICT infrastructures and using learning platforms; using learning platforms was highlighted as a priority area for just over half of secondary schools. Using technology for personalising learning was also one of the more commonly reported priority areas for secondary schools during 2008; just over 40 per cent of secondary senior leaders reported this.
As previously stated, primary schools also tended to prioritise the replacement of ICT equipment; just over 40 per cent of primary schools reported this. For just over a third of primary schools, teachers’ professional development was also a priority, and investments in ICT infrastructure and using a learning platform were priorities in 28 per cent and 26 per cent of primary schools respectively. (Learning platforms are discussed further in Chapter 6.) Many primary schools are perhaps still in the early stages of ‘e-confidence’, with a focus on replacing equipment, investing in their ICT infrastructures and training and supporting staff to use technology.
This 2008 survey coincides with a substantial capital investment programme (the Primary Capital Programme) in primary schools over the next few years; it is understandable that primary and secondary schools may be at different stages in ICT development. In secondary schools, the capital improvement programme started in 2005, and Building Schools for the Future is now underway; developments have perhaps moved on a stage.
While special schools were most commonly prioritising the replacement of equipment during 2008, over one-third were prioritising teachers’ continuing
professional development, and just under one-third were prioritising using a learning platform. Furthermore, one-quarter reported prioritising the use of technology for personalising learning.
order of priority.4 (The ranked scores are available in the accompanying data report – Report 2).
Figure 6: Priorities in using technology to support learning over the next three years (mean priority score)
The survey findings in 2008 revealed that the use of ICT in management and
administration and teaching and learning were high priorities across schools in each of the three sectors over the next few years.
Certainly, across primary schools, greater priority was given to ways of using ICT that were linked to management and administration and teaching and learning rather than to communication and collaboration. For instance, over two-thirds of primary schools (68 per cent) reported that using technology to record learners’ progress was a priority over the next few years; this was a slight increase on the percentage in 2007 of 55 per cent. Using technology to inform the learning and teaching process (a priority in 58 per cent of schools) and to promote independent learning (57 per cent) were also high priorities for over half of primary schools.
Improving communication with parents remained a high priority for around one-third of primary schools between 2007 and 2008. The percentage of primary schools reporting that extending learning beyond the classroom was a high priority in the next three years decreased from 43 per cent in 2007 to 38 per cent in 2008.
In secondary schools, the emphasis was similarly on prioritising the use of
technology in management and administration and teaching and learning. However, unlike in primary schools, senior leaders in secondary schools also said that they
4
Responses from schools were weighted as low priority = 1, medium priority = 2, high priority = 3. The scores were then added together and a mean average score was calculated. Schools that provided a ‘don’t know’ response were excluded from the analysis.
Average score (mean)
were giving high priority to communication and collaboration and study support. Just under half (48 per cent) of secondary schools were giving high priority to using
technology to communicate with parents (a slight increase from 45 per cent in 2007), and over half (55 per cent) said that using technology to provide study support for learners was a high priority. There was also a slight decrease in the percentage of secondary schools that reported that using technology to support personalising of learning was a high priority. This decreased from 73 per cent in 2007 to 63 per cent in 2008.
Across each of the three school sectors, local authorities and ICT consultants or advisers were undoubtedly key sources of information for schools in terms of influencing their ICT strategies or improvement plans. Well over half of primary, secondary and special schools identified each of these options.
However, there was a reduction in the proportion of schools using their local authorities for information and advice compared with a year ago. The 2007
Harnessing Technology School Survey found that 94 per cent of primary schools and 83 per cent of secondary schools used their local authorities for accessing
information and advice, compared with 69 per cent of primary schools and 60 per cent of secondary schools in 2008.
This decrease in accessing information and advice was also evident in relation to accessing information from government bodies, particularly among primary schools. For example, in 2007, 60 per cent of primary schools reported accessing information from the DfES, 45 per cent from the National College for School Leadership (NCSL), 45 per cent from Becta and 41 per cent from the Qualifications and Curriculum
Authority (QCA). In 2008, 32 per cent said they accessed information from the DCSF (DfES), 36 per cent from NCSL, 30 per cent from Becta and 18 per cent from the QCA.
A similar decrease in accessing information from local authorities was also evident in secondary schools, as was a similar decrease in accessing information from
government bodies, but the decreases were perhaps not as striking as those observed in primary schools. In addition, the use of ‘other ICT consultants’ had increased in both primary and secondary schools. This may reflect increased intervention in ICT through the Secondary National Strategies’ school-improvement programmes: schools may be making more use of external advisers, as encouraged by the ICT dimension of the National Strategies Programme.
Despite this downward trend in obtaining certain information and guidance in comparison with last year, many schools still reported that they had gained
by around half of secondary schools; the DCFS was also used by just under half of secondary schools. More secondary schools were also using their ICT suppliers as a source of information and guidance in comparison with last year: 48 per cent in 2008 compared with 35 per cent in 2007.
Use of ICT for managing and monitoring
It is now almost universally recognised that high-quality school leadership, broadly defined, makes an important contribution, both directly and indirectly, to school standards. Alongside new developments in school leadership (deliberately defined at a variety of different levels), governments have been anxious to promote the use of new technologies to improve learners’ experiences and outcomes. The e-strategy, as set out in the Harnessing Technology document, indicates that leaders in education are ‘crucial’ to the effective adoption of ICT within their institutions: ‘Through better training and development, improved professional and business partnerships, and peer networks, we can enable them and their organisations to make more effective use of ICT’ (DfES, 2005, p.4). This is partly why organisations such as the National College for School Leadership have been examining and revising their school leadership and ICT training courses. As part of this year’s Harnessing Technology survey, senior leaders were asked a range of questions about the systems in their schools, to access the extent to which schools are moving towards digitised management and monitoring processes.
Almost all secondary school leaders (95 per cent) reported that their schools used a management information system (MIS), and around 80 per cent of primary and special schools used an MIS. This reflects the findings from 2007, in which nearly all schools reported using some form of electronic system for financial management.
Most schools operated restricted access to the MIS. In 44 per cent of secondary schools, access was restricted to specific workstations. In primary and special schools, over half of ICT co-ordinators reported that access was restricted to workstations in a separate administration network. Few schools reported that their MIS could be accessed via a learning platform.
Schools were also asked about the extent to which their effectiveness in identifying repeat non-attendance had been affected as a result of recording attendance electronically. Just under three-quarters of secondary schools and over half of primary schools said that electronic systems had made the identification of repeat non-attendance more effective.
Over three-quarters of secondary schools reported having a system to record behaviour issues electronically, compared with under a quarter of primary schools and just over a third of special schools. This finding may be partly due to the expectation at the time of the survey that involvement in behaviour partnerships would be compulsory for secondary schools from 2008.
Over a third of special schools (37 per cent), around a quarter of primary schools (26 per cent) and just under one-fifth of secondary schools (18 per cent) were using paper-based methods to report to parents. This is not to say, however, that these schools were not using electronic methods in tandem with a paper-based approach.
Communication and collaboration
Increased and more effective communication within schools, with parents and with other organisations, and improved collaborative working are important elements of current government policy. The 2008 Harnessing Technology School Survey was, therefore, used to assess the extent to which schools engaged in partnerships and collaborative networks regarding ICT, and how they organised their communication with staff, parents and pupils.
As already discussed, using technology in communication and collaboration was more of a priority over the next few years in secondary schools compared with
primary schools, and this was reflected in the numbers of senior leaders across each of the phases who said that their schools were currently not engaged in any ICT partnerships or collaborative networks. For example, just under half (47 per cent) of primary schools, 37 per cent of special schools and 23 per cent of secondary
schools were not engaged in any ICT collaborative networks.
Furthermore, over the next few years, using technology to establish links with educational institutions at a distance was a low priority for around a third of schools across each of the sectors. Of the 78 primary schools that reported currently taking part in partnership working in terms of ICT, the highest proportion (33 out of 78) were collaborating to purchase a learning platform. Similar proportions of secondary
schools (47 out of 106) and, to a slightly lesser extent, special schools (38 out of 112) were collaborating to purchase a learning platform.
ICT finance
Of the three school sectors, primary schools reported the highest average (mean) percentage (8 per cent) of their school budgets being spent on ICT (equipment, software, connectivity and ICT support). Secondary schools reported an average of 6 per cent and special schools reported an average of 5 per cent.
Comparing the various sub-categories of ICT spending (equipment, software, connectivity and ICT support), ICT equipment tended to have the highest reported average spend across each of the school sectors, compared with each of the other sub-categories of ICT spending. This reflects the earlier finding that many schools across each of the sectors had included the replacement of ICT equipment as a priority in their current ICT strategies.
To examine these priorities in more depth, responses from schools that provided an answer to this question were ranked in order.5 The ranked scores are available in the data report (Report 2).
Regarding priority areas for ICT spending over the next three years, it appeared that spending on ICT equipment would be a high priority for over half of the schools in each of the three sectors. In secondary schools, the priority given to spending on ICT equipment was on a par with that given to spending on learning platforms. As
already noted, spending on learning platforms was a priority area in ICT strategies for over half of secondary schools, and had remained the same since the 2007 survey. Although spending on learning platforms over the next three years was deemed a high priority for only one-third of primary schools, this was an increase since the 2007 survey findings, in which 26 per cent of primary schools reported this to be a high priority.
Responses to the school leadership survey revealed that spending on ICT software over the next few years was probably the area fewest primary and secondary school leaders thought would be a high priority; this area had decreased slightly in priority for both the sectors when compared with the 2007 survey.
Around a third of schools across each of the sectors reported that connectivity and internet access would be a high priority for them, in terms of spending, over the next three years, and around a quarter in each sector said it would be a low priority.
Comparison with the 2007 survey revealed that technical support was another area of decreasing priority, in terms of ICT spending, for both primary and secondary schools over the next few years. In the 2007 survey, 55 per cent of primary schools reported spending on technical support to be a high priority over the next few years; this had decreased to 36 per cent in 2008. Secondary schools had experienced a
5
similar decline, with 61 per cent reporting technical support as a high priority in 2007 compared with 37 per cent in 2008.
For special schools, spending on ICT equipment was also a priority for over half of schools, and software was also identified as a high priority, with almost twice as many special schools awarding this a high priority when compared with primary and secondary schools. This confirms that the availability of appropriate software is particularly important for special schools.
Purchasing
One of the aims of the Harnessing Technology Strategy is to provide best-value ICT procurement frameworks that are available to all organisations, and to move towards more collective modes of working and achieving economies of scale. The
Harnessing Technology School Survey 2008 therefore asked ICT co-ordinators a range of questions about the processes by which schools purchased ICT equipment and internet services.
Purchasing ICT hardware and networking
Schools’ most common approach to purchasing ICT hardware (eg workstations, servers and peripherals) and networking equipment and cabling was directly from their ICT suppliers. In fact, the use of this approach had increased in primary and secondary schools since 2007. In 2007, 30 per cent of primary schools and 41 per cent of secondary schools reported purchasing their ICT hardware through their ICT suppliers, and 29 per cent of primary schools and 37 per cent of secondary schools purchased ICT networking equipment and cabling through their ICT suppliers. In 2008, the proportion of primary schools purchasing ICT hardware through their ICT suppliers had increased to 48 per cent, and the proportion of secondary schools to 63 per cent; 36 per cent of primary schools and 53 per cent of secondary schools purchased ICT networking equipment in this way. This also reflects the findings that more secondary schools, in particular, use their ICT suppliers for both information and purchasing, compared with the number last year.
Purchasing technical support and advice
ICT co-ordinators were asked about how their schools obtained ICT technical support and maintenance services, and advice about designing their schools’ ICT infrastructure. Schools that did not obtain either of these services were excluded from the analysis – the following percentages are based only on data from ICT co-ordinators who provided a valid response to this question6 – which prevents direct comparison with the 2007 data. In secondary schools, 40 per cent of ICT
co-ordinators said that their schools purchased ICT technical support directly from their ICT suppliers, just under one-third did so via their local authorities, and one-quarter did so directly from other independent sources. In primary schools, there was a greater tendency to purchase this kind of support from local authorities, with half of primary schools reporting this to be the case. Regarding obtaining advice about designing the school’s ICT infrastructure, secondary schools’ responses were fairly even spread, with around one-third using their local authorities and slightly fewer choosing to use their ICT suppliers or other independent sources. Again, primary schools continued to use their local authorities for obtaining advice about their ICT infrastructure, with just over 60 per cent choosing this option.
For primary schools, local authorities were the key providers of internet connectivity and advice, with around three-quarters of primary schools reporting this to be the case. In secondary schools, local authorities were also key providers of this type of support. Fifty-eight per cent of secondary schools reported obtaining internet
connectivity from their local authorities, and 69 per cent obtained advice about internet connectivity from their local authorities.
Purchasing technical support services
The 2008 survey also asked ICT co-ordinators to identify how they purchased technical support services in their schools in each of four areas: data management, networking, personal computing and internal support. Across each of the school sectors, a small proportion of schools said that they did not offer this type of support in their schools. These schools were therefore excluded from the analysis – the following percentages are based solely on those schools that offered technical
support services – however, this prevents direct comparison with the data from 2007.
Primary schools tended to outsource their data management technical support services either wholly (59 per cent) or partially (31 per cent). This was also the case for network support. However, for personal computing and internal support, more primary schools used in-house support than outsourced support. Nevertheless, 40 per cent of primary schools partially outsourced personal computing support.
6
In secondary schools, the picture was slightly different: secondary schools appeared to have a greater capacity for resourcing their technical support services in house. Even so, just over half of secondary schools partially outsourced their data
management support services, and one-third outsourced their network support. Special schools seemed to sit somewhere between the models of technical support operated by the primary and secondary schools.
Making decisions about purchasing
ICT co-ordinators were asked to identify who was responsible for making purchasing decisions about ICT hardware, networking equipment, and technical support and maintenance services. In primary schools, the headteacher tended to be the member of staff with this responsibility across each of the three purchasing areas. In
secondary schools, this responsibility tended to be delegated to the ICT manager. In special schools, responsibility for each of the three purchasing areas was slightly more evenly balanced across the headteacher, the ICT co-ordinator and the ICT manager, with ICT co-ordinators taking more of a lead in terms of purchasing hardware, which was also the case in primary and secondary schools.
Most schools, particularly primary and special schools, described their system for purchasing curriculum-related software as one in which teachers submitted requests for software, and the ICT co-ordinator, headteacher or other senior member of staff made the decision. This approach was similarly observed in the 2007 survey.
Safety and security
The 2008 Harnessing Technology School survey explored various aspects of ICT safety and security, including theft of ICT equipment and the use of anti-virus software, as well as aspects of learner safety enshrined not only in Every Child Matters and the Children’s Plan, but also highlighted in the more recent Byron report,
Safer children in a digital world (DCSF and DCMS, 2008).
ICT theft in schools
The theft of ICT equipment – internally (no break-in and/or pupil theft), externally (break-ins and/or stranger thefts) and from pupils on their way to and from school – was relatively uncommon in primary and special schools, with the majority of senior leaders reporting no such thefts having taken place over the last 12 months.
In secondary schools, internal thefts and external thefts were slightly more common. Just over 40 per cent of secondary schools reported experiencing between one and five internal and/or external thefts over the past year. And, while the numbers of thefts from secondary pupils on their way to and from school were relatively small, their numbers were higher than in primary or special schools: 8 per cent of
Just over 80 per cent of secondary schools reported having a CCTV system in place, compared with 36 per cent of primary schools and 43 per cent of special schools.
The use of anti-virus software
Regarding system security, most schools reported operating centrally controlled anti-virus software which delivered updates to all client services across the network. This was the case across all three sectors, but it was slightly more common in secondary schools. In addition, just over a 10th of primary and special schools reported that their anti-virus software was installed and maintained on individual client devices with no central control. Furthermore, in the majority of schools across each of the sectors, anti-virus software could be updated over the internet.
Regarding firewalls, just over 60 per cent of schools across each of the sectors used local-authority-managed firewalls. In addition, over 30 per cent of secondary schools reported using a school-managed software firewall and/or a regional broadband consortium managed firewall; however, these were less common in primary and special schools. Considering the data from the 2007 survey, the number of primary schools operating a school-managed software firewall had increased from 9 per cent in 2007 to 14 per cent in 2008. In secondary schools, a similar increase could be observed, with 16 per cent of secondary schools reporting a school-managed software firewall in 2007, compared with 39 per cent in 2008. The number of
secondary schools using a local-authority-managed firewall had also increased, from 46 per cent in 2007 to 65 per cent in 2008.
Provision of personal secure areas for pupils
ICT co-ordinators were asked to consider whether their schools offered pupils a personal secure area for storing their digital work, and if they did, to identify who hosted this secure area. Over 90 per cent of secondary schools reported offering their pupils a secure area for storing their work, and in most cases the school hosted this; this was similar to the percentage in 2007. In primary schools, the picture was slightly more mixed, with 49 per cent of primary schools reporting offering all pupils a secure area for their digital work, and 40 per cent offering this facility to some pupils. As with secondary schools, the school tended to host the secure area, although the local authority was the host in just over a 10th of cases.
secure area for storing their work: 11 per cent in special schools compared with 2 per cent in secondary schools and 6 per cent in primary schools.
Clearly, creating safe online environments for children and young people to explore, take risks in, and learn in is paramount. While the Byron report focuses primarily on keeping children and young people safe within an increasing culture of internet and video game use, it also talks of creating ‘a shared culture of responsibility’ in which everyone recognises the part they have to play. It is therefore important to consider the responsibility of schools in recognising some of the broader issues of e-safety, as explored in the current school survey, and the new set of challenges in keeping children and young people safe, which have arisen from increased use of
technology. Such challenges include supporting children and young people to be safe on their journeys to and from school if they are carrying a laptop, making sure that pupils have a secure electronic area for storing their work, and, most
importantly, raising the profile of e-safety among staff and pupils.
4. Using technology for teaching and learning
Key points
• Interactive whiteboards are the dominant technology in schools, and technology continues to be used primarily for presentational purposes. Display technologies are important, but there is scope for encouraging more engaged and interactive forms of teaching and learning using ICT.
• Linked with this, there is considerable scope for the further development of learning flexibility based on increasing the use of mobile devices. There is also much scope for the development of the use of social software for learning, which at present is reportedly used only in one in 20 schools.
• Teachers’ use of digital learning resources, especially self-created resources, is increasing, with a quarter of teachers uploading such resources at least once a week. There have also been increases in the proportions of teachers sharing digital resources.
• In terms of access to ICT facilities, school populations appear to have good access, and there is flexibility to accommodate pupils’ use out of normal lesson times, but community access to ICT facilities remains somewhat limited.
• In many respects, at a national level, the development of e-assessment is still in its early stages. Technology tends to be used for reporting pupils’ progress rather than for interactive forms of assessment.
Introduction
exploits the benefits of technology for learning and delivers tangible and measurable improvements and outcomes. Schools that are ‘e-mature’ have integrated
technology-based applications and processes into all aspects of their organisational practice and operation.
Bearing this strategic context in mind, this section looks at the extent to which schools reported using technology across the broad spectrum of teaching and learning. This includes consideration of the use of ICT:
• to provide resources for teaching and learning
• for lesson activities and across the curriculum
• for assessment and reporting.
ICT resources for teaching and learning
The availability and access to high-quality ICT resources is a priority within the Harnessing Technology strategy. This issue was explored in the current surveys by asking ICT co-ordinators and teachers a range of questions about the availability of ICT resources (including both hardware and software) in their schools and their levels of satisfaction with them.
Findings relating to schools’ ICT infrastructure were presented in Section 2 of this report. These were primarily about school-level resources, based on ICT
co-ordinators’ responses. This section presents teachers’ views about ICT resources.
The survey found that schools used technology primarily for presentational and display purposes. A detailed study of forms of e-learning in the further education sector also found that presentational use was much more common than the use of ICT for engaged learning (Golden et al, 2006). When schools were asked to rate the quantity of different types of ICT equipment, quantities of interactive whiteboards and digital projectors were reported as adequate or more than was needed to deliver the curriculum.
Primary schools generally reported higher levels of satisfaction with the quantity of ICT equipment at their disposal than did other schools. In secondary schools, for example, more than half of respondents said that they did not have enough networked desktop computers to deliver the curriculum adequately.