Short-term effects of announcing
revised lower risk national drinking
guidelines on related awareness and
knowledge: a trend analysis of monthly
survey data in England
John Holmes,1,2Jamie Brown,2,3,4Petra Meier,1,2Emma Beard,2,3,4 Susan Michie,2,3Penny Buykx1,2
To cite:Holmes J, Brown J, Meier P,et al. Short-term effects of announcing revised lower risk national drinking guidelines on related awareness and knowledge: a trend analysis of monthly survey data in England.BMJ Open2016;6:e013804. doi:10.1136/bmjopen-2016-013804
▸ Prepublication history and additional material is available. To view please visit the journal (http://dx.doi.org/ 10.1136/bmjopen-2016-013804).
Received 9 August 2016 Revised 7 October 2016 Accepted 10 October 2016
For numbered affiliations see end of article.
Correspondence to Dr John Holmes;
ABSTRACT
Objectives:To evaluate short-term effects of publishing revised lower risk national drinking guidelines on related awareness and knowledge. To examine where drinkers heard about guidelines over the same period.
Design:Trend analysis of the Alcohol Toolkit Study, a monthly repeat cross-sectional national survey. Setting:England, November 2015 to May 2016. Participants:A total of 11 845 adults (18+) living in private households in England.
Intervention:Publication of revised national drinking guidelines in January 2016 which reduced the male guideline by approximately one-third to 14 units per week.
Measurements:Whether drinkers (1) had heard of drinking guidelines (awareness), (2) stated the guideline was above, exactly or below 14 units (knowledge) and (3) reported seeing the stated guideline number of units in the last month in each of 11 locations (exposure). Sociodemographics: sex, age (18–34, 35–64, 65+), social grade (AB, C1C2, DE). Alcohol consumption derived from graduated frequency questions: low risk (<14 units/week), increasing/high risk (14+ units/week).
Results:Following publication of the guidelines, the proportion of drinkers aware of guidelines did not increase from its baseline level of 85.1% (CI 82.7% to 87.1%). However, the proportion of male drinkers saying the guideline was 14 units or less increased from 22.6% (CI 18.9% to 26.7%) in December to 43.3% (CI 38.9% to 47.8%) in January and was at 35.6% (CI 31.6% to 39.9%) in May. Last month exposure to the guidelines was below 25% in all locations except television/radio where exposure increased from 33% (CI 28.8% to 36.2%) in December to 65% (CI 61.2% to 68.3%) in January. Awareness and knowledge of guidelines was lowest in social grade DE and this gap remained after publication.
Conclusions:Publication of new or revised lower risk drinking guidelines can improve drinkers’knowledge of these guidelines within all sociodemographic groups;
however, in the absence of sustained promotional activity, positive effects may not be maintained and social inequalities in awareness and knowledge of guidelines are likely to persist.
INTRODUCTION
In January 2016, the UK’s Chief Medical Officers published proposed revisions to the country’s lower risk drinking guidelines.1 The previous guidelines were published in 1995 and recommended not regularly con-suming more than 3–4 units of alcohol a day for men and 2–3 units a day for women (1 UK unit=10 mL/7.9 g ethanol). Regularly was defined as not drinking that amount every day or nearly every day. A review of these guidelines was announced in 2012 as a major component of the UK Government’s Alcohol Strategy.2The review was particularly informed by a UK parliamentary report
Strengths and limitations of this study
▪ Low-risk drinking guidelines are published by governments or health authorities in most high-income countries but they are rarely evaluated and little robust evidence is available evaluating their effects on outcomes of interest.
▪ To the authors’knowledge, this study is the first internationally to use prospective, high-frequency survey data to examine the short-term effects of publishing new or revised drinking guidelines. ▪ Monthly data allowed for examination of how
short-term effects emerge and decay after a major component of public health information is announced and from what sources the public heard about this information at different time points.
Holmes J,et al.BMJ Open2016;6:e013804. doi:10.1136/bmjopen-2016-013804 1
Open Access Research
group.bmj.com on June 6, 2017 - Published by
which noted increased evidence of a causal relationship between alcohol consumption and cancer and increas-ing scepticism regardincreas-ing purported benefits of moderate drinking for cardiovascular health.3
The new guidelines were developed between 2013 and 2016 by an expert committee who reviewed existing evidence and commissioned new epidemiological mod-elling and studies of public attitudes.1 The epidemio-logical modelling played an important role in the committee’s decision-making as it estimated the levels and patterns of alcohol consumption which, if adopted by the entire UK population, would correspond to each of two definitions of low-risk drinking: having a risk equivalent to that of current UK abstainers and having a 1% lifetime risk of dying due to alcohol.4 These defi ni-tions were previously used in guideline review processes in Canada and Australia and the latter definition has also been used in a recent analysis of alcohol-related risks in the European Union.5–7 Thus, the new guide-lines contain three major changes: (1) from a daily to weekly guideline; (2) equalising the guidance for men and women; (3) a reduction in the guideline for men which was often interpreted as 21 units per week—a legacy of the pre-1995 guidance. In announcing the new guidelines, the Chief Medical Officers and the UK Government also placed significant emphasis on there being‘no safe level’of alcohol consumption with regard to cancer risks and downplayed benefits for cardiovascu-lar health.8
Although drinking guidelines are published in at least 37 countries,9there is little evidence documenting their effects or how those effects emerge and decay following promotional activity.10–12 The few published studies suggest that promotional activity may improve awareness and knowledge of the guidelines without reducing con-sumption. However, such claims are typically based on studies with limited potential for causal inference; for example, studies using cross-sectional surveys repeated at 1-year intervals.13–20
To date, there has been no official large-scale promo-tional campaign for the new UK guidelines. However, the announcement was a lead story for national news outlets and attracted substantial commentary in subse-quent weeks, some of which was highly critical. Many health websites and other promotional materials which mention the guidelines have been updated but alcoholic drink labels remain unchanged, even though ∼80% of alcoholic product labels in the UK include the drinking guidelines.21
This study uses monthly cross-sectional survey data to assess the size and duration of short-term effects of announcing new UK lower risk drinking guidelines on drinkers’ guideline-related awareness and knowl-edge. In addition, it investigates trends in drinkers’ sources of information about the guidelines and vari-ation in changes in awareness and knowledge by age, sex, socioeconomic status and alcohol consumption level.
METHODS Data
Data come from the Alcohol Toolkit Study (ATS), a monthly repeat cross-sectional survey which began in March 2014 and collects data from nationally representa-tive samples of ∼1600 adults each month living in private households in England. Since November 2015, the ATS has included questions relating to the drinking guidelines, and this analysis uses data from the 7 months between November 2015 and May 2016 (the most recently available month). January data were collected in the week after publication of the revised guidelines.
The full ATS methods are described elsewhere.22 Briefly, monthly samples are collected as part of a wider omnibus survey by the research agency Ipsos Mori using in-home computer-assisted interviewing. The survey uses a hybrid between random location sampling and quota sampling whereby England is split into 171 356 areas containing∼300 households. Areas are then allocated to interviewers based on stratified random sampling with strata being area-level geographic and socioeconomic profiles. Interviews are conducted within the randomly selected areas until quotas based on factors influencing the probability of being at home are filled (eg, employ-ment status, age, gender). Prevalence data are weighted using an iterative sequence of weighting adjustments whereby separate nationally representative target profiles are set for gender, working status, children in the house-hold, age, social grade and region. This process is then repeated until all variables match the specified targets.
Analyses here focused on drinkers who were identified via the AUDIT questionnaire, a widely used screening instrument for problem drinking which has good valid-ity, high internal consistency and good test–retest reli-ability across gender, age and cultures.22 23 Those who responded that they never drink were classed as non-drinkers.
Measures
Awareness
Awareness of guidelines among drinkers was measured using the question: ‘Before this interview, have you ever heard of there being a recommended maximum number of alcohol units people should drink in a day or a week? This is sometimes known as a “drinking guide-line”’. Responses were dichotomised as yes or no. The concept of units was explained during the AUDIT ques-tionnaire which was administered earlier in the survey.
Knowledge
Knowledge of the guideline among those who had heard of the concept was measured using the question:
‘How many units per day or per week is the drinking guideline for males/females?’. Participants were asked about their own sex only and allowed to respond in units per week or per day. For this analysis, responses were either trichotomised as more than, exactly or below 14 units per week or 2 units a day or dichotomised as
2 Holmes J,et al.BMJ Open2016;6:e013804. doi:10.1136/bmjopen-2016-013804
Open Access
group.bmj.com on June 6, 2017 - Published by
above versus exactly or below 14 units per week or 2 units per day (hereafter 14 units per week or 14 units for brevity). These classifications were used to test whether announcing the new guidelines increased the proportion of people saying the guideline was 14 units per week.
Exposure
To assess where people see or hear about the guideline
figure they gave, those who gave a figure were asked which of a list of places they had seen, read or heard about it in the last month (table 1). Responses were dichotomised as yes or no and there was no limit on the number of places participants could say‘yes’to.
Sociodemographic and drinking
The following characteristics were assessed: sex, age (18– 34, 35–64, 65+) and social grade which is an occupation-based measure of socioeconomic status, trichotomised here as AB (higher and intermediate managerial, administrative or professional occupations), C1C2 (supervisory, clerical, junior managerial, administrative and professional occupations or skilled manual occupa-tions) and DE (semiskilled or unskilled occupations and unemployed).
Alcohol consumption was measured via a graduated frequency approach.24 25 Drinkers were asked the maximum amount of alcohol they consumed on a single day in the past 4 weeks and how many units this was. They were then asked on how many days they consumed this amount and on how many days they consumed pro-gressively decreasing numbers of units below this maximum (eg, 31–40, 21–30, 16–20, 11–15, 8–10, 5–7, 3– 4, 1–2). The number of days consuming each quantity was multiplied by that quantity (with midpoints used for ranges) and the sum of these multiples was divided by four to give a measure of average weekly consumption. This measure was dichotomised as low risk (<14 units per week) versus increasing/high risk (14+ units per week).
Analysis
Descriptive analyses are used to examine change in outcome measures compared with December 2015, the last month before new guidelines were announced. Variation between subgroups in exposure to guidelines for the whole time period is also examined descriptively. All analyses are based on weighted survey data and cases are not excluded if they have missing data on some vari-ables. Further analyses presented in the online appendix test for subgroup differences in time trends for the outcome measures using unweighted binary and multi-nomial regression models with interaction effects between survey month and subgroup characteristics. These analyses lead to identical conclusions and the simpler descriptive analyses are preferred here for the benefit of the reader. All analyses were conducted in Stata SE V.12.1.
Ethics
Informed consent is given verbally by ATS participants after interviewers explain the study and give assurance that it is being conducted in line with the Market Research Society Code of Conduct.
RESULTS
In December, 87% of drinkers said they had heard of drinking guidelines (table 1). Despite substantial news coverage around the announcement, this figure did not increase significantly in January and 11% of drinkers said they were unaware of drinking guidelines in that month.
In contrast, there was a change in knowledge of the guideline following the announcement. In December, 33% of drinkers thought the guideline was above 14 units per week and this fell significantly to 22% in January. Conversely, the proportion of drinkers saying the guideline was exactly 14 units increased significantly from 21% to 29%. In the absence of sustained promo-tional activity, these effects on drinkers’ knowledge were not sustained and the proportion of drinkers stating the guideline was 14 units per week fell to 27% in February and 24% in March. There was some evidence of a sec-ondary increase in knowledge emerging gradually from March onwards, but further data points are required to confirm this.
Among drinkers who gave afigure for the guidelines, 32% reported no exposure to this figure in December but this dropped to 7% in January and remained low at 15% in May (table 1). TV and radio were the most common contexts to hear about the guidelines and the proportion who had done so in the last month increased significantly from 33% in December to 65% in January. Exposure to guidelines in newspapers and magazines also increased significantly between December and January, from 15% to 24%. In both media, exposure declined in subsequent months. Exposure may also have increased after December through talking to friends, family and colleagues, but this increase is small and it is unclear whether it is a real change or a result of com-paring against an unusual low in December. In all other contexts, recent exposure to drinking guidelines was low and did not increase significantly in January.
When comparing awareness across sociodemographic groups, a majority of drinkers in all groups were aware of guidelines at all time points; however, there were sig-nificant differences in awareness by social grade with only 70% of those in social grade DE aware of guidelines in December compared with 89% in grade C1C2 and 93% in grade AB (table 2). This significant difference remained after the announcement in January and in subsequent months.
Those in grade DE were also significantly less likely to say the guideline was 14 units or less than those in grade AB (29% vs 46%). This gap was still present in January despite both groups registering the change in guidelines (42% vs 56%) and persisted in May after knowledge
Holmes J,et al.BMJ Open2016;6:e013804. doi:10.1136/bmjopen-2016-013804 3
Open Access group.bmj.com
on June 6, 2017 - Published by http://bmjopen.bmj.com/
Table 1 Trends in main outcome measures by survey month*
November 2015 December 2015 January 2016 February 2016 March 2016 April 2016 May 2016
Drinker status: base—all respondents (N) 1689 1660 1712 1674 1679 1711 1720
Drinkers 71.2 65.9 66.1 65.2 67.7 66.6 68.0
(67.8 to 72.5) (63.4 to 68-2) (63.7 to 68.5) (62.6 to 67.7) (65.3 to 70.1) (64.2 to 68.9) (65.7 to 70.2)
Awareness: base—all drinkers (N) 1102 1035 1103 1037 1109 1098 1141
Heard of guidelines 85.1 87.1 88.6 88.6 86.5 85.9 88.4
(82.7 to 87.1) (84.8 to 89.0) (86.5 to 90.4) (86.4 to 90.5) (84.2 to 88.5) (83.6 to 87.9) (86.4 to 90.2)
Knowledge of new guideline: base—all drinkers (N) 1104 1035 1111 1040 1119 1100 1143
Below 14 units per week 18.3 17.9 23.4 19.8 19.3 19.9 19.9
(15.8 to 21.1) (15.5 to 20.6) (20.6to26.1) (17.2 to 22.6) (16.8 to 21.8) (17.5 to 22.6) (17.5 to 22.5)
14 units per week 19.4 20.6 29.0 27.1 24.4 24.7 26.3
(16.8 to 22.2) (18.1 to 23.5) (26.0to31.8) (24.1to30.2) (21.7 to 27.0) (22.1 to 17.6) (23.7to29.1)
Above 14 units per week 32.0 33.2 22.1 29.7 27.7 27.1 25.5
(29.0 to 35.1) (30.2 to 36.4) (19.4to24.7) (26.6 to 32.8) (24.7 to 30.4) (24.5to30.0) (23.0to28.3)
Not aware of drinking guidelines 14.9 13.0 11.4 11.4 13.5 14.1 11.6
(12.8 to 17.3) (11.0 to 15.2) (9.5 to 13.4) (9.5 to 13.4) (11.4 to 15.7) (12.1 to 16.3) (9.8 to 13.6)
Aware of but doesn’t know guideline 15.4 15.3 14.2 12.1 15.1 14.1 16.7
(13.1 to 18.1) (13.1 to 17.8) (12.7 to 17.0) (10.3 to 14.7) (13.6 to 18.1) (12.1 to 16.5) (14.6 to 19.2) Exposure in last month: base—drinkers who
gave a figure for the guideline (N)
Multiple responses permitted 771 742 822 786 804 804 856
Product labels 20.8 19.4 17.8 14.3 21.0 18.7 21.8
(17.8 to 24.2) (16.5 to 22.7) (15.1 to 20.9) (11.8 to 17.2) (18.1 to 24.2) (16.0 to 21.8) (19.0 to 24.9)
TV/radio 35.8 32.5 64.8 54.0 50.9 44.2 47.2
(32.1 to 39.7) (28.9 to 36.2) (61.2to68.3) (50.1to57.9) (47.2to54.6) (40.6to47.9) (43.7to50.8)
Newspapers/magazines 16.5 15.0 24.3 22.9 20.5 17.7 19.8
(13.8 to 19.7) (12.4 to 18.0) (21.2to27.6) (20.0to26.3) (17.7 to 23.6) (15.2 to 20.6) (17.2 to 22.7)
Websites/social media 5.7 6.3 7.5 5.3 8.8 6.4 8.4
(4.2 to 7.8) (4.6 to 8.7) (5.6 to 9.8) (3.9 to 7.2) (6.8 to 11.4) (4.8 to 8.5) (6.6 to 10.6)
Shops/supermarkets 8.6 8.0 6.7 7.7 7.9 5.2 8.2
(6.6 to 11.0) (6.2 to 10.4) (5.2 to 8.8) (6.0 to 10.0) (6.2 to 10.1) (3.8 to 7.0) (6.4 to 10.3)
Pubs/bars/restaurants 13.2 12.8 11.3 10.1 11.2 8.6 10.8
(10.8 to 16.1) (10.4 to 15.6) (9.2 to 13.9) (8.0 to 12.6) (9.0 to 13.8) (6.7 to 10.9) (8.1 to 12.5)
At place of work/study 7.1 6.0 7.2 8.0 8.1 6.6 8.6
(5.1 to 9.6) (4.4 to 8.1) (5.4 to 9.5) (6.1 to 10.5) (6.3 to 10.4) (4.9 to 8.7) (6.8 to 10.8)
Talking to health professionals 10.8 6.9 6.9 5.3 8.1 7.0 6.7
(8.7 to 13.5) (5.3 to 9.1) (5.3 to 9.1) (3.9 to 7.4) (6.3 to 10.3) (5.4 to 9.1) (5.2 to 8.6)
Posters/booklets at health service 11.5 10.6 9.6 9.0 12.0 8.3 10.5
(9.2 to 14.2) (8.5 to 13.2) (7.6 to 12.1) (7.1 to 11.4) (9.8 to 14.6) (6.5 to 10.6) (8.6 to 12.9)
Talking to friends/family/colleagues 7.6 5.1 9.2 8.3 8.9 6.6 9.6
(5.8 to 9.9) (3.7 to 7.1) (7.3to11.5) (6.5 to 10.7) (7.1to11.1) (5.0 to 8.6) (7.7to11.9)
Other 1.5 1.2 0.3 0.6 0.4 0.5 0.3
(0.8 to 2.8) (0.6 to 2.4) (0.1 to 1.2) (0.3 to 1.5) (0.1 to 1.1) (0.1 to 1.5) (0.1 to 1.0)
None of the above 26.4 32.3 7.4 13.3 15.5 23.3 15.0
(23.1 to 30.0) (28.7 to 36.0) (5.7to9.7) (10.9to16.2) (13.0to18.4) (20.3to26.7) (12.7to17.7)
*All figures are percentages with 95% CIs in parentheses unless otherwise stated. Bold text indicates significant differences compared with December 2015 based on 95% CIs.
4
Holmes
J,
et
al
.
BMJ
Open
2016;
6
:e013804.
doi:10.1136/
bmjopen-20
16-013804
Ope
n
Ac
cess
group.bmj.com
on June 6, 2017 - Published by
http://bmjopen.bmj.com/
Table 2 Trends in main outcome measures within sociodemographic groups by survey month*
November 2015 December 2015 January 2016 February 2016 March 2016 April 2016 May 2016
Unweighted number of cases (N)
Female 805 820 848 817 823 862 871
Male 884 840 871 860 866 850 850
16–34 546 522 505 518 502 521 522
35–64 759 738 759 725 784 706 796
65+ 384 400 455 434 403 485 403
Social grade AB 332 376 416 366 371 420 420
Social grade C1C2 893 832 876 856 845 816 896
Social grade DE 464 452 427 455 473 476 406
Non-drinker 585 625 608 637 570 612 578
Low risk (<14 units per week) 677 644 744 648 675 675 702
Increasing/high risk (14+units per week) 178 189 189 195 200 232 200
Per cent of sample who are drinkers
Female 66.9 61.9 62.3 62.7 63.2 60.9 64.8
(63.3 to 70.2) (58.4 to 65.3) (58.6 to 65.5) (58.6 to 65.8) (59.2 to 66.1) (57.5 to 64.3) (61.5 to 68.0)
Male 73.8 69.9 70.4 68.2 73.0 72.5 71.3
(70.5 to 76.8) (66.4 to 73.2) (66.9 to 73.6) (64.6 to 71.6) (69.7 to 76.1) (69.2 to 75.6) (68.1 to 74.4)
16–34 60.1 57.9 60.8 56.2 64.5 60.9 61.2
(55.6 to 64.6) (53.3 to 62.4) (56.1 to 65.3) (51.4 to 60.8) (60.0 to 68.8) (56.5 to 65.1) (56.8 to 65.5)
35–64 75.2 70.2 67.6 69.6 70.4 71.1 71.3
(71.8 to 78.2) (66.6 to 73.6) (63.9 to 71.0) (65.9 to 73.1) (66.9 to 73.6) (67.6 to 74.5) (68.0 to 74.5)
65+ 73.9 67.5 70.9 68.5 66.6 64.8 70.3
(68.7 to 78.6) (62.4 to 72.3) (66.1 to 75.2) (65.4 to 73.0) (61.3 to 71.4) (60.2 to 69.2) (65.5 to 74.8)
Social grade AB 79.7 77.1 79.9 80.9 81.9 81.9 81.7
(74.9 to 83.8) (72.2 to 81.4) (74.4 to 83.0) (76.1 to 84.9) (77.3 to 85.8) (77.8 to 85.5) (77.6 to 85.2)
Social grade C1C2 71.1 67.8 68.1 67.2 68.8 67.8 69.6
(67.8 to 74.3) (64.3 to 71.1) (64.6 to 71.4) (63.6 to 70.6) (65.4 to 72.1) (63.3 to 70.1) (66.4 to 72.7)
Social grade DE 57.5 48.9 47.2 43.0 49.2 49.0 48.9
(52.5 to 62.4) (44.0 to 53.8) (42.2 to 52.4) (38.0 to 48.2) (44.6 to 54.0) (44.3 to 53.7) (47.2 to 51.0) Per cent of drinkers who are
aware of guidelines
Female 87.8 87.1 89.7 88.4 85.4 87.6 88.1
(84.5 to 90.5) (83.8 to 89.8) (86.6 to 92.2) (85.1 to 91.1) (82.0 to 88.3) (84.4 to 90.2) (85.2 to 90.6)
Male 82.5 87.0 87.6 88.8 87.5 84.4 88.7
(79.0 to 85.5) (83.7 to 89.7) (84.6 to 90.1) (85.7 to 91.3) (84.3 to 90.2) (81.1 to 87.3) (85.6 to 91.1)
16–34 81.2 82.5 80.7 84.7 78.9 78.4 83.9
(76.0 to 85.5) (77.4 to 86.5) (75.4 to 85.1) (79.7 to 88.6) (73.6 to 83.4) (73.3 to 82.8) (79.2 to 87.8)
35–6 86.6 90.6 92.8 90.2 90.7 89.9 90.8
(83.2 to 89.3) (87 to 5 to 92.9) (90.2 to 94.7) (87 to 1 to 92.6) (87.9 to 93.0) (86.8 to 92.4) (88.0 to 93.0)
65+ 86.2 84.5 89.8 89.7 87.3 86.1 88.6
(81.3 to 90.0) (79.2 to 88.7) (85.6 to 92.8) (85.2 to 92.9) (82.3 to 91.1) (81.7 to 89.6) (84.2 to 91.8)
Social grade AB 93.1 92.9 95.0 95.5 93.5 94.3 92.3
(89.1 to 95.7) (89.1 to 95.4) (91.9 to 96.9) (91.9 to 97.6) (89.9 to 95.9) (91.2 to 96.3) (88.7 to 94.8)
Continued
Holmes
J,
et
al
.
BMJ
Open
2016;
6
:e013804
.
doi:10.113
6/bmjopen-2
016-013804
5
Open
Acces
s
group.bmj.com
on June 6, 2017 - Published by
http://bmjopen.bmj.com/
Table 2 Continued
November 2015 December 2015 January 2016 February 2016 March 2016 April 2016 May 2016
Social grade C1C2 86.0 89.2 89.1 87.3 85.3 84.4 90.2
(82.8 to 88.7) (86.0 to 91.7) (86.1 to 91.6) (84.1 to 90.0) (81.8 to 88.2) (80.9 to 87.3) (87.4 to 92.4)
Social grade DE 69.6 70.2 74.9 77.8 76.8 74.4 75.4
(62.9 to 75.6) (63.3 to 76.3) (67.9 to 80.8) (70.8 to 83.6) (70.5 to 82.1) (67.7 to 80.1) (68.8 to 81.0)
Low risk (<14 units per week) 88.3 87.9 88.6 92.4 88.1 88.5 90.4
(85.5 to 90.7) (85.1 to 90.2) (85.9 to 90.8) (89.9 to 94.3) (85.3 to 90.4) (85.8 to 90.7) (87.8 to 92.5)
Increasing/high risk (14+units per week) 91.7 96.5 96.0 97.2 94.3 88.0 95.0
(84.4 to 95.6) (90.3 to 97.3) (93.7 to 98.2) (87.7 to 95.9) (84.1 to 93.2) (91.1 to 97.9) (92.3 to 95.0) Per cent of drinkers saying guideline was 14 units per week or less
Female 51.9 55.8 61.6 59.1 55.4 54.4 57.4
(47.0 to 56.7) (51.1 to 60.4) (57.1 to 66.0) (54.3 to 63.7) (50.9 to 60.0) (49.8 to 59.0) (53.0 to 61.6)
Male 24.3 22.6 43.3 35.0 32.7 36.1 35.6
(20.5 to 28.4) (18.9 to 26.7) (38.9to47.8) (30.5to39.9) (28.7to36.8) (32.0to40.4) (31.6to39.9)
16–34 37.7 37.5 45.0 43.1 37.4 33.1 42.9
(31.8 to 43.9) (31.5 to 44.0) (39.0 to 51.2) (36.7 to 49.7) (31.8 to 43.2) (27.8 to 38.8) (37.1 to 48.9)
35–64 36.4 39.8 55.8 49.8 46.3 49.7 48.6
(31.8 to 41.2) (35.3 to 44.5) (51.0to60.5) (44.8to54.8) (41.8 to 50.9) (45.0to54.3) (44.2 to 52.9)
65+ 40.7 36.8 52.8 44.1 45.0 48.3 44.8
(34.2 to 47.4) (30.6 to 43.4) (46.9to58.7) (38.0 to 50.3) (38.7 to 51.4) (42.5 to 54.1) (38.9 to 50.9)
Social grade AB 43.4 46.0 55.7 53.7 49.6 54.0 48.1
(36.9 to 50.2) (39.9 to 52.2) (49.7 to 61.5) (47.3 to 60.0) (43.7 to 55.6) (48.3 to 59.6) (42.7 to 53.7)
Social grade C1C2 37.3 37.2 53.0 45.6 41.6 42.9 50.3
(33.1 to 41.7) (32.8 to 41.7) (48.6to57.4) (41.1 to 50.2) (37.4 to 45.9) (38.5 to 47.4) (46.0to54.5)
Social grade DE 29.4 29.1 42.4 35.4 36.8 31.9 30.2
(23.2 to 36.4) (22.8 to 36.2) (35.0 to 50.2) (28.1 to 43.5) (30.6 to 43.5) (25.8 to 38.7) (23.9 to 37.3)
Low risk (<14 units per week) 41.8 42.2 55.1 50.8 48.8 48.6 50.0
(37.6 to 46.0) (38.1 to 46.4) (51.2to58.9) (46.6to55.0) (44.7 to 52.8) (44.6 to 52.6) (46.1 to 53.9)
Increasing/high risk (14+units per week) 29.2 28.7 50.7 45.8 35.2 40.3 43.2
(22.5 to 38.2) (22.3 to 36.9) (40.8to56.4) (35.5 to 51.6) (26.1 to 40.0) (33.0 to 46.7) (35.0 to 49.5)
*All figures are percentages with 95% CIs in parentheses unless otherwise stated. Bold text indicates significant differences compared with December 2015 based on 95% CIs.
6
Holmes
J,
et
al
.
BMJ
Open
2016;
6
:e013804.
doi:10.1136/
bmjopen-20
16-013804
Ope
n
Ac
cess
group.bmj.com
on June 6, 2017 - Published by
http://bmjopen.bmj.com/
decreased again (30% vs 48%;figure 1). Only the guide-line for men was changed in January and the change in knowledge is specific to men. While 23% of men and 56% of women said the guideline was 14 units or less in December, the proportion of men saying this increased significantly to 43% in January but only changed slightly to 62% for women.
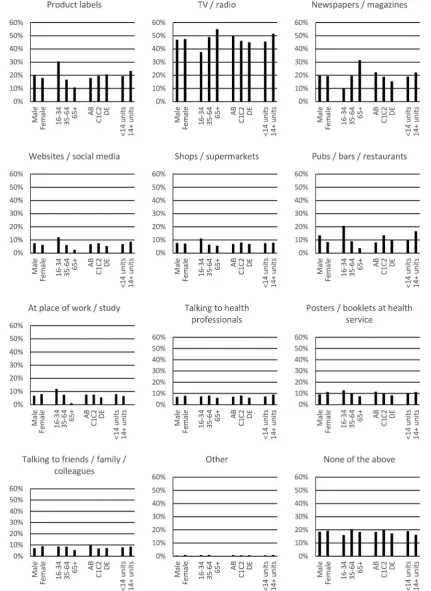
Among those who gave afigure for the guidelines, 16– 34 years old were more likely than older drinkers to report exposure via product labels, websites and social media, or at pubs, bars, restaurants or their place of work or study. In contrast, older drinkers were more likely to report exposure via TV, radio, newspapers or magazines (figure 2). Differences between other popula-tion groups were not sufficiently large to be of major policy significance (ie, <10 percentage points).
DISCUSSION
The publication of revised UK lower risk drinking guide-lines in January 2016 did not increase awareness of the existence of drinking guidelines. This may partly reflect high baseline awareness; however, there were also no increases in subpopulations where baseline awareness was lower (eg, drinkers in social grade DE). Although the new guidelines of 14 units a week were a change from daily to weekly guidance, only the male guideline was actually reduced and the proportion of male drin-kers saying the guideline was 14 units per week or less increased following the announcement, although only to 43%. This figure declined again after January, although there was some evidence of an emerging sec-ondary gradual increase in knowledge. As with aware-ness, drinkers in social grade DE had lower levels of knowledge before, during and after January than those in higher social grades. The lack of large-scale promotional activity beyond news coverage meant that television and radio were the main media through which drinkers were exposed to the drinking guidelines and this was particularly the case after the announcement
in January. Less than a quarter of drinkers reported hearing about the guidelines through any other medium in January.
This study is thefirst to the authors’ knowledge to use prospective high-frequency survey data to examine the emergence and decay of short-term effects of promoting new or revised drinking guidelines. Further strengths include the use of consistent data collection methods and measures over survey waves, the inclusion of prein-tervention and postinprein-tervention data, the nationally rep-resentative sample and the examination of multiple outcomes including awareness, knowledge and place of exposure. Limitations include the short preintervention period and the potential for the traditionally heavy and light drinking months of December and January to con-found intervention effects. With regard to exposure, the accessibility of television clips and newspaper reports through social media and websites means that the source of some exposure may be difficult for respon-dents to classify. Finally, self-reporting biases are common to all studies on alcohol use and lead to under-estimation of alcohol consumption.26 This will affect accurate classification of respondents into consumption groups for subgroup analyses but is unlikely to impact the main outcome measures. Short-term effects of pro-moting drinking guidelines on alcohol consumption and related harm are not examined in this paper as these outcomes are the focus of an ongoing longer term evaluation. The findings arise from a nationally repre-sentative sample of drinkers living in private households in England. Therefore, it is reasonable to assume these
findings are generalisable to other high-income coun-tries with comparable drinking cultures after allowing for baseline differences in outcome measures; however, data on these baseline differences are scarce.
[image:7.595.207.552.47.235.2]Overall, the findings broadly align with previous studies by suggesting that announcing revisions to drinking guidelines can lead to modest improvements in drinkers’ knowledge of the guidelines.16–18 However, our results additionally suggest that without
Figure 1 Knowledge of UK lower risk drinking guidelines by social grade.
Holmes J,et al.BMJ Open2016;6:e013804. doi:10.1136/bmjopen-2016-013804 7
Open Access group.bmj.com
on June 6, 2017 - Published by http://bmjopen.bmj.com/
more extensive or sustained promotional efforts, knowledge remains low, any gains in knowledge may be short-lived, and social inequalities persist in the awareness and knowledge, which the UK Government regards as necessary “for people to make
responsible and informed choices about their drink-ing”ref. 2, p. 27.
[image:8.595.83.515.49.641.2]To date, the UK Government has not announced a major promotional campaign for the new drinking guidelines. This is likely to limit their impact as routine
Figure 2 Exposure in last month by subgroup among drinkers who gave a figure for the guidelines.
8 Holmes J,et al.BMJ Open2016;6:e013804. doi:10.1136/bmjopen-2016-013804
Open Access
group.bmj.com on June 6, 2017 - Published by
promotional activity appears to go largely unnoticed. Only a small minority of drinkers reported recent expos-ure to the guidelines from sources not linked to news coverage. In particular, only around a fifth of drinkers noticed the guidelines on product labels despite alcohol producers and retailers ensuring around 80% of pro-ducts include the drinking guidelines on their label as part of the Public Health Responsibility Deal (PHRD).27 The reason this information has failed to register with drinkers is unclear as previous literature has suggested such labelling can be effective in enabling drinkers to track their alcohol intake and conform to drinking guidelines.28However, an evaluation of the PHRD noted that the UK guidelines were typically presented on the bottom of the reverse label of products and in font sizes smaller than those recommended for easy readability.29
Further research is required to evaluate how revision and promotion of the UK’s lower risk drinking guide-lines affects alcohol consumption and alcohol-related harm. The results above suggest a rapidly decaying short-term effect on knowledge but also indicate a secondary effect may be emerging and research will be required to characterise the trajectory of any effects in the medium and long term. Qualitative evidence is also required regarding how drinkers accommodate the new guide-lines within their existing understanding about alcohol-related risks and apply that broader understanding to their own and others’ alcohol consumption. Lovatt
et al30 have described how drinkers used lay
epidemi-ology to interpret the previous guidelines and further work in this vein may be profitable and should take account of how the guidelines were presented to the public by health professionals, news outlets and other publicfigures, both supportive and critical.
CONCLUSIONS
Publication of new or revised lower risk drinking guide-lines can improve drinkers’ knowledge of these guide-lines within all sociodemographic groups; however, in the absence of sustained promotional activity, positive effects may be short-lived and social inequalities in awareness and knowledge of guidelines are likely to persist.
Author affiliations
1Sheffield Alcohol Research Group, School of Health and Related Research (ScHARR), University of Sheffield, Sheffield, UK
2UK Centre for Tobacco and Alcohol Studies (UKCTAS), Nottingham, UK 3Department of Clinical, Educational and Health Psychology, University College London, London, UK
4Cancer Research UK Health Behaviour Research Centre, University College London, London, UK
Twitter Follow J Holmes at @JHolmesSheff and Jamie Brown at @jamiebrown10
Contributors JH led the research and drafted the manuscript. JB, PM, EB, SM and PB worked with JH to develop the overall research design, the design of the questionnaire and interpretation of the results. JB, EB and SM developed the Alcohol Toolkit Study design. JB, EB and PB contributed to design of the analysis and provided statistical support. All authors contributed to revisions to the manuscript.
Funding This work was funded by the National Institute for Health Research (NIHR) Public Health Research (PHR) Programme (Project Number: 15/63/ 01). Additional data collection was funded by the NIHR School for Public Health Research which also contributed funding for JH and PB. JB is funded by a fellowship from the Society for Study of Addiction.
Disclaimer The views and opinions expressed are those of the authors and do not necessarily reflect those of the PHR Programme, NIHR or the Department of Health.
Competing interests JH and PM were advisors to (and were previously members of ) the UK Chief Medical Officers’Guidelines Development Group. JH, PM and PB were commissioned by Public Health England to provide an epidemiological modelling report which informed development of the new UK lower risk drinking guidelines and, at the time of writing, continue to provide advice to the UK Department of Health, Public Health England and the Guideline Development Group on matters relating to this report. JB and EB have received unrestricted research funding from Pfizer for studies relating to smoking cessation.
Ethics approval Ethical approval for the wider Alcohol Toolkit Study and for this evaluation of the UK lower risk drinking guidelines was granted by the University College London Ethics Committee and the University of Sheffield Ethics Committee, respectively.
Provenance and peer review Not commissioned; externally peer reviewed.
Data sharing statement The statistical code is available on request from the authors.
Open Access This is an Open Access article distributed in accordance with the terms of the Creative Commons Attribution (CC BY 4.0) license, which permits others to distribute, remix, adapt and build upon this work, for commercial use, provided the original work is properly cited. See: http:// creativecommons.org/licenses/by/4.0/
REFERENCES
1. Department of Health. UK Chief Medical Officers’Alcohol Guidelines Review: summary of the proposed new guidelines. London: Department of Health. 2016.
2. Government HM.The government’s alcohol strategy. London, 2012. 3. House of Commons Science and Technology Committee.Alcohol
guidelines, eleventh report of session 2010–12 (HC 1536). London: The Stationery Office, 2012.
4. Holmes J, Angus C, Buykx P,et al.Mortality and morbidity risks from alcohol consumption in the UK: analyses using the Sheffield Alcohol Policy Model (v.2.7) to inform the UK Chief Medical Officers’ review of the UK lower risk drinking guidelines. Sheffield: ScHARR, University of Sheffield, 2016.
5. Rehm J, Gmel G, Probst C,et al.Lifetime-risk of
alcohol-attributable mortality based on different levels of alcohol consumption in seven European countries. Implications for low-risk drinking guidelines. Toronto, ON, Canada: Centre for Addiction and Mental Health, 2015.
6. Room R, Rehm J. Clear criteria based on absolute risk: reforming the basis of guidelines on low-risk drinking.Drug Alcohol Rev
2012;31:135–40.
7. Stockwell T, Butt P, Beirness D,et al. The basis for Canada’s new low-risk drinking guidelines: a relative risk approach to estimating hazardous levels and patterns of alcohol use.Drug Alcohol Rev
2012;31:126–34.
8. Guardian. Weekly alcohol limit cut to 14 units in UK for men. 2016. http://www.theguardian.com/society/2016/jan/08/mens-recommended-maximum-weekly-alcohol-units-cut-14 (accessed 20 May 2016). 9. Kalinowski A, Humphreys K. Governmental standard drink definitions
and low-risk alcohol consumption guidelines in 37 countries.
Addiction2016;111:1293–8.
10. Babor TF, Caetano R, Casswell S,et alAlcohol: no ordinary commodity. Research and public policy. 2nd edn. Oxford: Oxford University Press, 2010.
11. Anderson P, Chisholm D, Fuhr DC. Alcohol and global health 2 effectiveness and cost-effectiveness of policies and programmes to reduce the harm caused by alcohol.Lancet2009;373:2234–46. 12. Wakefield M, Loken B, Hornik R. Use of mass media campaigns to
change health behaviour.Lancet2010;376:1261–71.
13. Bowden JA, Delfabbro P, Room R,et al. Alcohol consumption and NHMRC guidelines: has the message got out, are people
Holmes J,et al.BMJ Open2016;6:e013804. doi:10.1136/bmjopen-2016-013804 9
Open Access group.bmj.com
on June 6, 2017 - Published by http://bmjopen.bmj.com/
conforming and are they aware that alcohol causes cancer?Aust N Z J Public Health2014;38:66–72.
14. Bendtsen P, Karlsson N, Dalal K,et al. Hazardous drinking concepts, limits and methods: low levels of awareness, knowledge and use in the Swedish population.Alcohol Alcohol2011;45: 638–45.
15. de Visser RO, Birch JD. My cup runneth over: young people’s lack of knowledge of low-risk drinking guidelines.Drug Alcohol Rev
2012;31:206–12.
16. Livingston M. Perceptions of low-risk drinking levels among Australians during a period of change in the official drinking guidelines.Drug Alcohol Rev2012;31:224–30.
17. Grøenæk M, Strøger U, Strunge H,et al. Impact of a 10-year nation-wide alcohol campaign on knowledge of sensible drinking limits in Denmark.Eur J Epidemiol2001;17:423–7.
18. Strunge H. Danish experiences of national campaigns on alcohol 1990–1996.Drugs Educ Prev Policy1998;5:73–9.
19. Health and Social Care Information Centre. Statistics on Alcohol: England, 2013, 2013. Available at http://content.digital.nhs.uk/ catalogue/PUB10932/alc-eng-2013-rep.pdf (accessed 23 Nov 2016). 20. Dixon HG, Pratt IS, Scully ML,et al. Using a mass media campaign
to raise women’s awareness of the link between alcohol and cancer: cross-sectional pre-intervention and post-intervention evaluation surveys.BMJ Open2015;5:e006511.
21. Campden BRI.Final report on: audit of compliance of alcoholic beverage labels available from the off-trade with the Public Health
Responsibility Deal Labelling Pledge. Chipping Campden: Campden BRI Limited, 2014.
22. Beard E, Brown J, West R,et al. Protocol for a national monthly survey of alcohol use in England with 6-month follow-up:‘the alcohol toolkit study’.BMC Public Health2015;15:230.
23. Bush K, Kivlahan DR, McDonnell MB,et al. The AUDIT alcohol consumption questions (AUDIT-C): an effective brief screening test for problem drinking.Arch Intern Med1998;158:1789–95. 24. Greenfield TK, Kerr WC. Alcohol measurement methodology in
epidemiology: recent advances and opportunities.Addiction
2008;103:1082–99.
25. Gmel G, Graham K, Kuendig H,et al. Measuring alcohol consumption: Should the‘graduated frequency’approach become the norm in survey research?Addiction2006;101:16–30. 26. Gmel R, Rehm J. Measuring alcohol consumption.Contemp Drug
Problems2004;31:467–540.
27. Department of Health. The Public Health Responsibility Deal. London: Department of Health, 2011.
28. Kerr WC, Stockwell T. Understanding standard drinks and drinking guidelines.Drug Alcohol Rev2013;31:200–5.
29. Petticrew M, Douglas N, Knai C,et al. Health information on alcoholic beverage containers: has the alcohol industry’s pledge in England to improve labelling been met?Addiction2016;111:51–5. 30. Lovatt M, Eadie D, Meier PS,et al. Lay epidemiology and the
interpretation of low risk drinking guidelines by adults in the United Kingdom.Addiction2015;110:1912–19.
10 Holmes J,et al.BMJ Open2016;6:e013804. doi:10.1136/bmjopen-2016-013804
Open Access
group.bmj.com on June 6, 2017 - Published by
analysis of monthly survey data in England
related awareness and knowledge: a trend
lower risk national drinking guidelines on
Short-term effects of announcing revised
and Penny Buykx
John Holmes, Jamie Brown, Petra Meier, Emma Beard, Susan Michie
doi: 10.1136/bmjopen-2016-013804
2016 6:BMJ Open
http://bmjopen.bmj.com/content/6/12/e013804 Updated information and services can be found at:
These include:
References
#BIBL http://bmjopen.bmj.com/content/6/12/e013804
This article cites 20 articles, 1 of which you can access for free at:
Open Access
http://creativecommons.org/licenses/by/4.0/
use, provided the original work is properly cited. See:
others to distribute, remix, adapt and build upon this work, for commercial the Creative Commons Attribution (CC BY 4.0) license, which permits This is an Open Access article distributed in accordance with the terms of
service
Email alerting
box at the top right corner of the online article.
Receive free email alerts when new articles cite this article. Sign up in the
Collections
Topic
Articles on similar topics can be found in the following collections(2123) Public health
(159) Addiction
Notes
http://group.bmj.com/group/rights-licensing/permissions To request permissions go to:
http://journals.bmj.com/cgi/reprintform To order reprints go to:
http://group.bmj.com/subscribe/ To subscribe to BMJ go to:
group.bmj.com on June 6, 2017 - Published by