Int. J. Electrochem. Sci., 13 (2018) 4350 – 4366, doi: 10.20964/2018.05.62
International Journal of
ELECTROCHEMICAL
SCIENCE
www.electrochemsci.org
Improved Electrochemical Performance of Ni-rich Cathode
Materials via Al Gradient Doping
Mao-Huang Liu1,*, Chien-Wen Jen1, Jin-Ming Chen2, Shih-Chieh Liao2
1
Department of Chemistry, Fu Jen Catholic University, New Taipei City, Taiwan 24205
2
Material and Chemical Research Laboratories, Industrial Technology Research Institute, HsinChu, Taiwan 31040
*
E-Mail: [email protected]
Received: 9 January 2018 / Accepted: 6 March 2018 / Published: 10 April 2018
An Al gradient-doped LiNi0.80Co0.19Mg0.01O2 (Al(GD)-LNCMgO) cathode was prepared via chemical
co-precipitation followed by calcination. The average doping concentration of Al in the Al(GD)-LNCMgO was ~2 mol.% with ~7 mol.% on the particle surface. Al(GD)-Al(GD)-LNCMgOreturned values for initial efficiency, rate capability, cycle-life, thermal stability, and air-exposed stability that were superior to those of Al and Mg co-doped LiNi0.78Co0.19Mg0.01Al0.02O2 (LNCMgAlO),
LiNi0.80Co0.19Mg0.01O2 (LNCMgO), and LiNi0.81Co0.19O2 (LNCO). The Mg substitution and Al-rich
surface of Al(GD)-LNCMgO suppressed the reactions of electrolytes with the material and inhibited increases in resistance. Doping Mg and Al in LNCO can also accelerate Li-ion diffusion.
Keywords: lithium ion battery, cathode material, Mg doped, Al gradient-doped, electrochemical performance..
1. INTRODUCTION
Global warming and air pollution caused by the burning of fossil fuels has become a serious phenomenon. Electric vehicles (EVs) can reduce carbon emissions and help protect the environment. To meet the increasing demand for high performance batteries for use in EVs, the energy density, cycle life, and safety of existing state-of-the-art Li-ion cells must improve. Lithium nickel oxide (LiNiO2) cathode provides a high level of energy density with less toxicity, which makes it suitable for
electric-vehicle applications [1-3]. However, pure LiNiO2 presents problems that include difficult
synthesis, poor thermal stability and an unstable crystal structure. In previous studies, a partial replacement of the Ni in LiNiO2 by Co and Al has enhanced the stability of the crystal structure [4-10].
(> 180 mAh g-1) and has become one of the most crucial materials for the next generation of lithium-ion batteries. Nevertheless, it is well known that NCA batteries continue to suffer from the problems of poor cycle life, particularly when used under conditions that include high temperature or high voltage [11-15]. Doping Mg in LiNi0.8Co0.15Al0.05O2 has improved the life of NCA, because Mg2+ ions act as
pillaring ions that suppress variations in the c-axis, which in turn suppresses the pulverization of NCA particles during charge-discharge cycling [15-18].
In the present study, we combined the advantages of doping Mg and Al in Ni-rich cathode material via homogeneous-doping [4-10, 15-23] and gradient-doping technology [24-26]. Specifically, Mg2+ ions were homogeneously doped in the cathode material to provide a pillaring effect throughout the particles. On the other hand, Al3+ ions were more concentrated on the surface and gradually decreased toward the core, resulting in a gradient concentration in the particles that improved the surface stability of the material. Characteristics such as the structure, electrochemical performance, thermal stability, and air-exposed stability of Al gradient-doped LiNi0.80Co0.19Mg0.01O2
(Al(GD)-LNCMgO) were studied and compared with those of Al and Mg co-doped LiNi0.78Co0.19Mg0.01Al0.02O2
(LNCMgAlO), LiNi0.80Co0.19Mg0.01O2 (LNCMgO), and LiNi0.81Co0.19O2 (LNCO).
2. EXPERIMENTAL
2.1. Synthesis
Spherical LNCO or LNCMgO powders were prepared in the following steps [19, 27, 28]. An aqueous solution of 1.0 M NiSO4 , CoSO4 and MgSO4 (molar ratio of either Ni:Co ≒ 81:19 or
Ni:Co:Mg ≒ 80:19:1) was pumped into a two-liter tank reactor accompanied by continuous stirring. Simultaneously, a 2.0 M NaOH solution and an 8.0 M NH4OH solution were separately fed into the
reactor. The concentration of NH4OH, the pH, and the temperature were maintained at 1.2 M, 10.5,
and 60 ºC, respectively. After the mixture had been vigorously stirred for 20 hours, either spherical Ni0.81Co0.19(OH)2 or Ni0.80Co0.19Mg0.01(OH)2 precipitations with particle diameters of approximately
10∼15 μm had formed. The co-precipitates were thoroughly washed using de-ionized water and then dried at 105 ºC for 5 hours in an oven. Then, lithium hydroxide was added and mixed with the precursor powders, where a molar ratio of lithium to nickel/cobalt/magnesiumn metal was 1.02. The mixture was sintered at 780 ºC under an oxygen atmosphere for 16 hours to form either LNCO or LNCMgO.
To prepare the LNCMgAlO or Al(GD)-LNCMgO powders [29, 30], the as-synthesized Ni0.80Co0.19Mg0.01(OH)2 or LNCMgO powders were suspended in a 0.3 M NH4OH solution, and then
an appropriate amount of Al2(SO4)3 solution was slowly added into each suspension with continuous
stirring for 2 hours by a stirrer (IKA RW20, IKA, Germany). Simultaneously, 3.0 M NH4OH solutions
Int. J. Electrochem. Sci., Vol. 13, 2018
4352 washed, filtered, and dried. Then, lithium hydroxide (LiOH·H2O) was mixed into the 2 mol.%
Al(OH)3-coated Ni0.80Co0.19Mg0.01(OH)2 to form a molar ratio of lithium to
nickel/cobalt/magnesium/aluminium metal of 1.02. The mixture was sintered at 780 ºC under an oxygen atmosphere for 16 hours to obtain the LNCMgAlO. For the Al(GD)-LNCMgO powders, the 2 mol.% Al(OH)3-coated LNCMgO was sintered at 780 ºC under an oxygen atmosphere for 2 hours.
2.2. Characterization of physical properties
A diffractometer (PANalytical, X’Pert) equipped with a Cu/Ka source was used for X-ray diffraction (XRD) analysis. The morphology and atomic concentration of the powders were characterized by a scanning electron microscope (SEM) with an energy dispersive spectroscope (EDS) (S3400N, Hitachi). The content variation of Al was determined as follows. A small amount of LNCMgAlO or Al(GD)-LNCMgO particles and an adequate amount of agate balls were placed in a mill pot that rotated at 100 rpm for 20 minutes through a planetary ball mill (FRITSCH P6, FRITSCH, Germany). The LNCMgAlO or Al(GD)-LNCMgO particles collided in the pot; the particles broken in half were examined by the SEM. The element content of Al was analyzed by an EDS from the edge to the center of the rupture surface of the LNCMgAlO or Al(GD)-LNCMgO particle. Elemental analysis was carried out by an inductively coupled plasma optical emission spectroscope (ICP-OES) (Optima 2100 DV, Perkin Elmer). The FTIR spectrum were measured in reflectance mode using a Perkin Elmer Spectrum 100 ATR-FTIR spectrophotometer.
2.3. Electrochemical measurements
Electrochemical evaluation of the cathode powders were carried via the use of CR2032-type lithium ion coin cells. A slurry for the cathode electrode was obtained by mixing the active material, graphite (KS6, TIMCAL co.), carbon-black (Super P, TIMCAL co.), and polyvinylidene fluoride (PVdF #1300, KUREHA co.) at a ratio of 88:4:2:6 (wt. %) in the NMP solvent (MITSUBISHI CHEMICAL co.). Then, the slurry was dispersed using a high-efficiency mixer (TURBULA® T2F, Willy A. Bachofen AG). The resultant slurry was cast on 20 μm Al foil (UACJ Foil co.) using a 150 μm doctor's blade. The coated Al foil was dried at 120 °C for 2 hours to evaporate the NMP solvent, and it was then roll-pressed to the thickness of 65 μm under the 1000 kg cm-2 pressure and punched to form a circular disk with a diameter of 12 mm (electrode area: ~1.13 cm2). The electrode films with about 17 mg active material (electrode density: 3.34 g cm-3) were preserved in an argon-filled dry box (Unilab, MBrun). The coin cells used lithium metal foil (FMC co.) as an anode and were used to test the electrochemical performance of the cathode materials. A mixture of ethylene carbonate (EC) and dimethyl carbonate (DMC) (EC:DMC = 1:2 vol.%) solvents containing 1 M LiPF6 was used as the
various currents (1C = 3.2 mA) in a potential range between 2.8 and 4.3 V via a battery testing system (BAT750B, Acutech Systems Co. LTd., Taiwan). EIS experiments were performed using an electrochemical station (614B, CH Instrument). The impedance spectra were taken at frequencies ranging from 105 to 10-3 Hz with the voltage amplitude of 5 mV after cycling between 2.8 and 4.3 V and charging to 4.3 V. The parameter values of the equivalent circuits for the impedance spectra were determined by conducting computer simulation with the Z-Plot electrochemical impedance software. In the PITT measurements, I(t) vs. t was measured as a function of potential steps at 30 mV ranging from 3.8 to 4.3 V. Each potential step was applied when the electrode had reached equilibrium, as defined by a residual current of less than 1 μA.
2.4. Thermal evaluation
The cathode samples for the differential scanning calorimetry (DSC) analysis were prepared as follows. Coin cells were initially charged to 4.3 V at a 0.1 C rate and then opened in an argon-filled dry box to remove the charged cathode samples. Approximately 3 mg of the cathode with 3 µL of electrolyte was hermetically sealed in an aluminum pan. DSC scanning was carried out at a scan rate of 5 ºC min-1 from 180 ~280 ºC by a Perkin-Elmer DSC7 instrument.
3. RESULTS AND DISCUSSION
3.1. Synthesis and characterizations
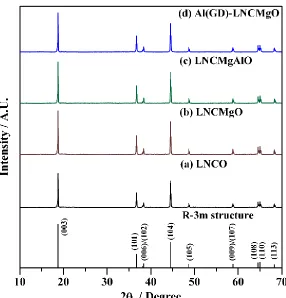
XRD patterns of the pristine LNCO, LNCMgO, LNCMgAlO, and Al(GD)-LNCMgO are shown in Fig. 1. All the powders were confirmed to have a well-defined α-NaFeO2-type structure
(space group, R-3m) [19, 25, 28, 29]. They exhibited well defined (0 0 6)/(1 0 2) and (1 0 8)/(1 1 0) doublets, which indicates an ordered distribution of Li and Ni/Co in the layered structure. The hexagonal lattice parameters, c/a ratio, unit volume, and I(003/104) are given in Table 1.
Int. J. Electrochem. Sci., Vol. 13, 2018
4354
[image:5.596.156.442.65.363.2]Figure 1. X-ray diffraction patterns of (a) LNCO, (b) LNCMgO,(c) LNCMgAlO,and (d) Al(GD)-LNCMgO powders.
Table 1. Lattice parameters of sample powders.
Cathode material Lattice parameter (Å) c/a I(003/104)
a c Volume (Å3)
LNCO 2.8646 14.1834 100.7910 4.95 1.29
LNCMgO 2.8653 14.1948 100.9282 4.95 1.31
LNCMgAlO 2.8639 14.1938 100.8211 4.96 1.33
Al(GD)-LNCMgO 2.8629 14.1930 100.7443 4.96 1.37
The decrease in the lattice constants of a and c and in the unit volume with Al-substitution can be attributed to the ionic radius of Al3+ (0.535 Å) in the octahedral 3a site, which is slightly smaller than that of either Ni3+ (0.56 Å) or Co3+ (0.545 Å) [7, 26, 32, 33]. The bonding strength of Al3+-O is larger than that of Ni3+-O. The stronger bonding induced by the incorporation of Al in the host structure improved the structural stability [34, 35]. Al(GD)-LNCMgO had the highest I(003/104) ratio among all cathode materials, which indicated that the Al gradient-doped material had the lowest degree of cation mixing [36-38].
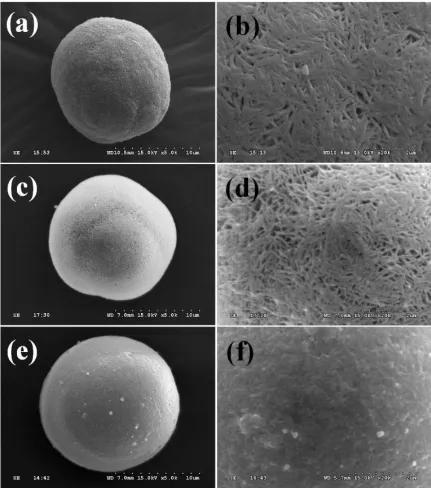
SEM images of Ni0.81Co0.19(OH)2, Ni0.80Co0.19Mg0.01(OH)2, and Al(OH)3-coated
Ni0.80Co0.19Mg0.01(OH)2 are shown in Fig. 2. These images show the synthesized precursor particles
with spherical morphologies and an average particle size of 12~13 µm. In particular, the morphology of Al(OH)3-coated Ni0.80Co0.19Mg0.01(OH)2 differed from that of the Ni0.81Co0.19(OH)2 and
[image:5.596.78.508.453.544.2]
and 2(f). Specifically, the Ni0.81Co0.19(OH)2 and Ni0.80Co0.19Mg0.01(OH)2 particles showed a porous
surface that was made up of tiny, needle-like crystals, whereas the Al(OH)3-coated
Ni0.80Co0.19Mg0.01(OH)2 revealed a surface with a smeared appearance.
SEM images of the pristine LNCO, LNCMgO, LNCMgAlO, Al(OH)3-coated LNCMgO, and
Al(GD)-LNCMgO are shown in Fig. 3. All powders were spherical and had average secondary particle sizes of 12~13 µm. The secondary particles were made up of numerous dense primary particles. In particular, the Al(OH)3-coated LNCMgO showed acicular Al(OH)3 on the surface, as shown in Fig.
[image:6.596.82.513.222.711.2]3(g)(h).
Figure 2. SEM images: (a)(b) NC(OH)2, (c)(d) NCMg(OH)2, and (e)(f) Al(OH)3-coated NCMg(OH)2
Int. J. Electrochem. Sci., Vol. 13, 2018
4356
Figure 3. SEM images: (a)(b) LNCO, (c)(d) LNCMgO, (e)(f) LNCMgAlO, (g)(h) Al(OH)3-coated
[image:7.596.128.471.67.716.2]
Table 2. The elemental analysis of sample powders, as measured by ICP-OES.
mol. % mol. %
Ni Co Mg Al/(Ni+Co+Mg)
LNCO 81.35 18.65 --- ---
LNCMgO 80.27 18.78 0.94 ---
LNCMgAlO 79.48 19.58 0.94 1.97
Al(GD)-LNCMgO 79.62 19.43 0.95 1.97
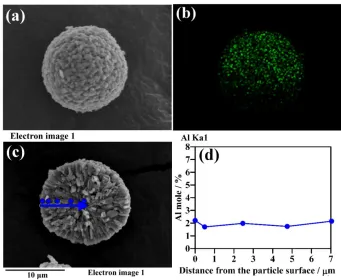
The chemical composition, as determined via ICP-OES analysis, of the prepared cathode material is listed in Table 2. The stoichiometry of the Ni:Co:Mg in the LNCMgAlO was 79.48: 19.58: 0.94, while the Al content of LNCMgAlO was 1.97 mol.%. The concentration of Al was analyzed from the edge to the center of the rupture surface of the LNCMgAlO particle via EDS, as shown in Fig. 4. The analysis was conducted along the blue line shown in Fig. 4(c). Fig. 4(d) shows how the Al was homogeneously distributed in the particle. It is apparent that when Al(OH)3-coated
Ni0.80Co0.19Mg0.01(OH)2 precursor was sintered with LiOH under an oxygen atmosphere at high
[image:8.596.128.469.420.700.2]temperature, the Al and Li ions were diffused into the precursor particles and uniformly distributed in the sintered LNCMgAlO.
Int. J. Electrochem. Sci., Vol. 13, 2018
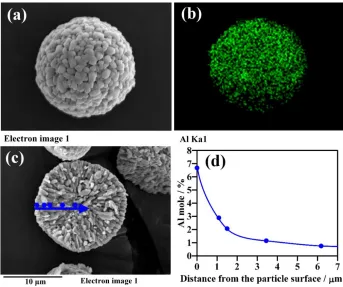
4358 The stoichiometry of values for the Ni:Co:Mg in Al(GD)-LNCMgO were 79.62: 19.43: 0.95, while the Al content was 1.97 mol.% in Al(GD)-LNCMgO. EDS was used to analyze the element content of Al from the edge to the center of the rupture surface of the Al(GD)-LNCMgO particle, as shown in Fig. 5. The analysis was conducted along the blue line shown in Fig. 5(c). Fig. 5(d) shows that the Al concentration in the particle decreased exponentially from ~7 mol. % at the surface to ~1 mol. % at the core. The Al3+ was the result of the thermal decomposition of the Al(OH)3 that coated
[image:9.596.121.464.221.508.2]the surface of the LNCMgO particles at 780 °C and gradually diffused into the particles with a gradient concentration distribution.
Figure 5. (a) SEM image, (b) EDS mappings of Al on the surface, (c) cross-sectional SEM image, and (d) Al concentration from the surface to the core of Al(GD)-LNCMgOparticles.
3.2. Electrochemical measurements
efficiency could have been the result of reductions in the side reactions between electrolytes and the Al(GD)-LNCMgO surface caused by the Al-rich surface [23, 25, 26].
[image:10.596.175.421.116.303.2]Figure 6. Charge/discharge curves of (a) LNCO, (b) LNCMgO,(c) LNCMgAlO, and (d) Al(GD)-LNCMgO during the first cycle.
[image:10.596.162.430.359.730.2]Int. J. Electrochem. Sci., Vol. 13, 2018
4360 To further investigate the effect of doping on the electrochemical properties of LNCO, rate-capability tests were performed at 0.5, 1.0, 2.0, 3.0, and 4.0 C with pristine LNCO, LNCMgO, LNCMgAlO, and LNCMgO, respectively. The results shown in Fig. 7 reveal that Al(GD)-LNCMgO had the best rate capability among all samples. Specifically, the capacity retention of the Al(GD)-LNCMgO at a 4.0 C-rate was 84.6%, while that of the pristine LNCO was 63.5%. We believe that the better rate capability was due mainly to the pillaring effect as a result of the Mg dopant and from a reduction in the reactions between the electrolyte and the Al-rich surface sample.
Figure 8. Specific capacity profiles of (a) LNCO, (b) LNCMgO,(c) LNCMgAlO,and (d) Al(GD)-LNCMgO cells at 0.2 C charge and 0.5 C discharge. (e)The cycling performances of all samples.
[image:11.596.151.444.205.627.2]
structure collapse, which aids lithium diffusion, and, therefore, capacity retention [15-19, 23, 25, 26, 40].
3.3. EIS analysis
The electrochemical impedance of the cycled samples at 25 °C was measured in a charged state of 4.3 V after the 1st, 20th, and 40th cycles (Fig. 9). The Nyquist plots with frequencies ranging from 105 to 10-3 Hz had two semicircles and an arc line. The first semicircle in the high frequency was related to the resistance of a surface layer (Rf), the second one in the middle frequency was the charge transfer resistance (Rct) and low-frequency dispersion of the solid-state diffusion [24-26, 42-45]. Each parameter was determined by fitting the plot to the equivalent circuit shown in the insert of Fig. 9.
Figure 9. Nyquist plots for (a) LNCO, (b) LNCMgO,(c) LNCMgAlO,and (d)Al(GD)- LNCMgO at
[image:12.596.131.470.291.546.2]1st, 20th, and 40th cycles.
Table 3. Resistances of the pristine LNCO, LNCMgO, LNCMgAlO, and Al(GD)-LNCMgO after 1st, 20th, and 40th cycles.
LNCO LNCMgO LNCMgAlO Al(GD)-LNCMgO
Cycles Rf Rct Rf Rct Rf Rct Rf Rct
1st 8.0 7.8 2.9 10.5 2.8 9.4 2.7 9.3
20th 14.8 47.7 3.0 24.8 2.9 16.5 2.8 15.7
[image:12.596.84.513.654.729.2]Int. J. Electrochem. Sci., Vol. 13, 2018
4362 Table 3 lists the various resistances of the pristine LNCO, LNCMgO, LNCMgAlO, and Al(GD)-LNCMgO after 1st, 20th, and 40th cycles. In the present study, the total resistance (Rf+Rct) of the pristine LNCO increased from 15.8 Ω in the 1st cycle to 155.2 Ω in the 40th cycle, while that of LNCMgO was increased from 13.4 Ω to 46.2 Ω, that of LNCMgAlO was increased from 12.2 Ω to 25.9 Ω, and that of Al(GD)-LNCMgO was an increase of from 12.0 Ω to 23.3 Ω. These results indicate that the Mg substitution and Al-rich surface of Al(GD)-LNCMgO reduced the total resistance by minimizing the side reactions with the electrolyte. The low increase in the total resistance of Al(GD)-LNCMgO enabled good cycling and high-rate capability.
3.4. Determination of the lithium-ion diffusion coefficient
The potentiostatic intermittent titration technique (PITT) is often used to measure the solid-state apparent chemical diffusion coefficients [24, 46-49]. The measured diffusivities of Li-ions in the previous studies [24, 46] were combined results of the diffusion through the surface layer and the diffusion within the lattice. Fig. 10 shows the variations in the apparent chemical diffusion coefficients (Dapp) of Li+ ions moving out of the LNCO with the applied potentials during the de-intercalation
process. These results indicate that Mg and Al doping can facilitate the diffusion of Li+ ions. The higher mass-transfer rate of Mg/Al-doped cathode materials also accounts for their better rate capability. The Al(GD)-LNCMgO exhibited the higher Dapp among all samples. As mentioned earlier,
[image:13.596.141.456.494.705.2]the substitution of transition metals with Mg and Al ions enhanced the structural stability of LNCO and suppressed the structural deterioration during the charge-discharge cycle. The higher concentration of Al on the surface of Al(GD)-LNCMgO effectively suppressed the side reactions with the electrolyte and enhanced the diffusion of Li+.
Figure 10. PITT measurement of the apparent chemical diffusion coefficients (Dapp) of (a) LNCO, (b)
3.5. Thermal stability measurements
The thermal stability of a cathode material, particularly in a delithiated state, is crucial for battery safety. Fig. 11 shows the DSC data of a sample charged to 4.3 V. The exothermic peaks of the pristine LNCO, LNCMgO, LNCMgAlO, and Al(GD)-LNCMgO occurred at about 212.3, 219.6, 221.9, and 229.8 °C, respectively.
Figure 11. DSC profiles of (a) LNCO, (b) LNCMgO,(c) LNCMgAlO,and (d)Al(GD)- LNCMgO cells charged at 4.3V.
Figure 12. FTIR spectra of (a) LNCO, (b) LNCMgO, (c) LNCMgAlO, and (d) Al(GD)-LNCMgO powders.
[image:14.596.157.439.180.395.2] [image:14.596.172.442.448.652.2]Int. J. Electrochem. Sci., Vol. 13, 2018
4364 Mg and Al enhanced the thermal stability of LNCO. As mentioned earlier [4, 10, 23, 25], the Al-rich surface structure can protect the active material from being attacked by the electrolyte, which suppresses release of oxygen from the host lattice. Therefore, Al(GD)-LNCMgO demonstrated the best thermal stability.
3.6. Storage of material powders
Zhuang et al. [50] reported that a layer of Li2CO3 formed on the NCA surface during storage in
air severely reduced the reversible capacity and increased the irreversible capacity, according to the equation LiNi0.8Co0.15Al0.05O2 + 1/4xO2 + 1/2xCO2 → Li1−xNi0.8Co0.15Al0.05O2 + 1/2xLi2CO3. To
understand the storage stability of the powders, FTIR analysis of the cathode materials was performed with the cathode samples exposed to air for two weeks. The results (Fig. 12) showed that the IR spectra of air-exposed LNCO, LNCMgO, and LNCMgAlO displayed broad peaks at 1410 cm-1 that corresponded to a carbonate group of Li2CO3 [50-53]. In contrast, no Li2CO3 signal was observed in
the IR spectrum of air-exposed Al(GD)-LNCMgO. In other words, the Al-rich surface suppressed the surface reaction with CO2 under an air atmosphere.
4. CONCLUSION
We synthesized Al gradient-doped LiNi0.80Co0.19Mg0.01O2 cathode material with good
electrochemical properties, thermal stability, and air-exposed stability. The Al-rich surface not only effectively reduced the reactivity of a cathode with an electrolyte with a concomitant rise in resistance, but also suppressed the surface reaction with CO2 under air to achieve a higher level of air-exposed
stability.
ACKNOWLEDGEMENTS
The authors would like to thank the Industrial Technology Research Institute of Taiwan for financial support of this work.
References
1. H. Arai, S. Okada, H. Ohtsuka, M. Ichimura, and J. Yamaki, Solid State Ionics, 80 (1995) 261. 2. C. S. Yoon, M. H. Choi, B. B. Lim, E. J. Lee, and Y. K. Sun, J. Electrochem. Soc., 162 (2015)
A2483.
3. T. Ohzuku, A. Ueda, and M. Nagayama, J. Electrochem. Soc., 140 (1993) 1862.
4. S. Madhavi, G. V. Subba Rao, B. V. R. Chowdari, and S. F. Y. Li, J. Power Sources, 93 (2001) 156.
5. C. H. Chen, J. Liu, M. E. Stoll, G. Henriksen, D. R. Vissers, and K. Amine, J. Power Sources, 128 (2004) 278.
6. C. J. Han, J. H. Yoon, W. I. Cho, and H. Jang, J. Power Sources, 136 (2004) 132.
199.
8. M. Broussely, Ph. Blanchard, Ph. Biensan, J. P. Planchat, K. Nechev, and R. J. Staniewicz, J. Power Sources, 119 (2003) 859.
9. A. D’Epifanio, F. Croce, F. Ronci, V. Rossi Albertini, E. Traversa, and B. Scrosati, Phys. Chem. Chem. Phys., 3 (2001) 4399.
10. M. Jo, M. Noh, P. Oh, Y. Kim, and J. Cho, Adv. Energy Mater., 4 (2014) 1301583.
11. S. Watanabe, M. Kinoshita, T. Hosokawa, K. Morigaki, and K. Nakura, J. Power Sources, 260 (2014) 50.
12. S. Watanabe, M. Kinoshita, T. Hosokawa, K. Morigaki, and K. Nakura, J. Power Sources, 258 (2014) 210.
13. T. Sasaki, T. Nonaka, H. Oka, C. Okuda, Y. Itou, Y. Kondo, Y. Takeuchi, Y. Ukyo, K. Tatsumi, and S. Muto, J. Electrochem. Soc., 156 (2009) A289.
14. S. Muto, Y. Sasano, K. Tatsumi, T. Sasaki, K. Horibuchi, Y. Takeuchi, and Y. Ukyo, J. Electrochem. Soc., 156 (2009) A371.
15. T. Sasaki, V. Godbole, Y. Takeuchi, Y. Ukyo, and P. Novák, J. Electrochem. Soc., 158 (2011) A1214.
16. H. Kondo, Y. Takeuchi, T. Sasaki, S. Kawauchi, Y. Itou, O. Hiruta, C. Okuda, M. Yonemura, T. Kamiyama, and Y. Ukyo, J. Power Sources, 174 (2007) 1131.
17. S. Muto, K. Tatsumi, Y. Kojima, H. Oka, H. Kondo, K. Horibuchi, and Y. Ukyo, J. Power Sources, 205 (2012) 449.
18. B. Huang, X. Li, Z. Wang, H. Guo, and X. Xiong, Ceram. int., 40 (2014) 13223. 19. J. Cho, Chem. Mater., 12 (2000) 3089.
20. C. Pouillerie, F. Perton, Ph. Biensan, J.P. Pérès, M. Broussely, and C. Delmas, J. Power Sources, 96 (2001) 293.
21. A. D’Epifanio, F. Croce, F. Ronci, V. Rossi Albertini, E. Traversa, and B. Scrosati, Chem. Mater., 16 (2004) 3559.
22. C. Pouillerie, L. Crogunnec, and C. Delmas, Solid State Ionics, 132 (2000) 15.
23. D. Aurbach, O. Srur-Lavi, C. Ghanty, M. Dixit, O. Haik, M. Talianker, Y. Grinblat, N. Leifer, R. Lavi, D. Thomas Major, G. Goobes, E. Zinigrad, E. M. Erickson, M. Kosa, B. Markovsky, J. Lampert, A. Volkov, and J. Y. Shin, J. Electrochem. Soc., 162 (2015) A1014.
24. M. H. Liu, H. T. Huang, C. M. Lin, J. M. Chen, and S. C. Liao, Electrochim. Acta, 120 (2014) 133. 25. J. Duan, G. Hu, Y. Cao, C. Tan, C. Wu, K. Du, and Z. Peng, J. Power Sources, 326 (2016) 322. 26. G. Li, Z. Zhang, R. Wang, Z. Huang, Z. Zuo, and H. Zhou, Electrochim. Acta, 212 (2016) 399. 27. J. Ying, C. Wan, C. Jiang, and Y. Li, J. Power Sources, 99 (2001) 78.
28. M. H. Kim, H. S. Shin, D. Shin, and Y. K. Sun, J. Power Sources, 159 (2006) 1328. 29. A. H. Tavakoli, H. Kondo, and Y. Ukyo, J. Electrochem. Soc., 160 (2013) A302.
30. E. Narita, T. Yamagishi, K. Aizu, and K. N. Han, Int. J. Miner. Process., 29 (1990) 267. 31. C. C. Chang, J. Y. Kim, and P. N. Kumta, J. Power Sources, 89 (2000) 56.
32. S. H. Wu, and C. W. Yang, J. Power Sources, 146 (2005) 270. 33. H. Ren, X. Li, and Z. Peng, Electrochim. Acta, 56 (2011) 7088.
34. L. Li, Q. Yao, H. Zhu, Z. Chen, L. Song, and J. Duan, J. Alloys Compd., 686 (2016) 30.
35. S. T. Myung, S. Komaba, N. Hirosaki, K. Hosoya, and N. Kumagai, J. Power Sources, 146 (2005) 645.
36. J. Morales, C. Péres-Vicente, and J. L. Tirado,Mat. Res. Bull., 25 (1990) 623.
37. T. Ohzuku, A. Ueda, M. Nagayama, Y. Iwakoshi, and H. Komori, Electrochim. Acta, 38 (1993) 1159.
38. C. Delmas, J. P. Pérès, A. Rougier, A. Demourgues, F. Weill, A. Chadwick, M. Broussely, F. Perton, Ph. Biensan, and P. Willmann, J. Power Sources, 68 (1997) 120.
Int. J. Electrochem. Sci., Vol. 13, 2018
4366 40. Z. Huang, Z. Wang, X. Zheng, H. Guo, X. Li, Q. Jing, and Z. Yang, Electrochim. Acta, 182 (2015)
795.
41. P. Y. Liao, J. G. Duh, and H. S. Sheu, J. Power Sources, 183 (2008) 766. 42. Y. Cho, and J. Cho, J. Electrochem. Soc., 157 (2010) A625.
43. K. Du, H. Xie, G. Hu, Z. Peng, Y. Cao, and F. Yu, ACS Appl. Mater. Interfaces, 8 (2016) 17713. 44. D. Aurbach, M. D. Levi, E. Levi, H. Telier, B. Markovsky, G. Salitra, U. Heider, and L. Hekier, J.
Electrochem. Soc., 145 (1998) 3024.
45. D. Aurbach, K. Gamolsky, B. Markovsky, G. Salitra, Y. Gofer, U. Heider, R. Oesten, and M. Schmidt, J. Electrochem. Soc., 147 (2000) 1322.
46. M. D. Levi, G. Salitra, B. Markovsky, H. Teller, D. Aurbach, U. Heider, and L. Heider, J. Electrochem. Soc., 146 (1999) 1279.
47. M. D. Levi, and D. Aurbach, J. Phys. Chem. B, 101 (1997) 4641.
48. K. Dokko, M. Mohamedi, Y. Fujita, T. Itoh, M. Nishizawa, M. Umeda, and I. Uchida, J. Electrochem. Soc., 148 (2001) A422.
49. C. Wang, L. Chen, H. Zhang, Y. Yang, F. Wang, F. Yin, and G. Yang, Electrochim. Acta, 119 (2014) 236.
50. G. V. Zhuang, G. Chen, J. Shim, X. Song, P. N. Ross, and T. J. Richardson, J. Power Sources, 134 (2004) 293.
51. O. Haik, N. Leifer, Z. Samuk-Fromovich, E. Zinigrad, B. Markovsky, L. Larush, Y. Goffer, G. Goobes, and D. Aurbach, J. Electrochem. Soc., 157 (2010) A1099.
52. D. Aurbach, J. Power Sources, 89 (2000) 206.
53. T. Nohma, H. Kurokawa, M. Uehara, M. Takahashi, K. Nishio, and T. Saito, J. Power Sources, 54 (1995) 522.