Int. J. Electrochem. Sci., 12 (2017) 1896 – 1914, doi: 10.20964/2017.03.21
International Journal of
ELECTROCHEMICAL
SCIENCE
www.electrochemsci.orgCorrosion of Copper in
a
Concentrated LiNO
3Solution at a
High Temperature
Chunhuan Luo1, Qingquan Su2,*, Na Li1, Yiqun Li1 1
School of Energy and Environmental Engineering, University of Science and Technology Beijing, 30 Xueyuan Road, Haidian District, Beijing 100083, China
2
Beijing Engineering Research Center for Energy Saving and Environmental Protection, University of Science and Technology Beijing, 30 Xueyuan Road, Haidian District, Beijing 100083, China
*
E-mail: [email protected]
Received: 5 November 2016 / Accepted: 31 December 2016 / Published: 12 February 2017
This paper presents the effects of the concentration, temperature, pH and Li2CrO4 on copper corrosion in a concentrated LiNO3 solution. The LiNO3 concentration had opposite effects on the copper corrosion. The corrosion rate increased with increasing temperatures, but decreased with increasing pH levels. Below 220 °C, Li2CrO4 promoted the formation of a thin and compact passive film comprising CuO, Cu2O and Cr2O3, which effectively inhibited the copper corrosion. Regarding corrosivity, the maximum applicable temperature for an absorption heat pump was extended from 165 °C to 220 °C using a LiNO3 solution instead of a LiBr solution as the working fluid.
Keywords: Copper; Working fluid; High Temperature Corrosion; Inhibitor; Weight Loss
1. INTRODUCTION
Moreover, the presence of Cu2+ in the LiBr solution resulting from the corrosion of the copper parts can cause galvanic corrosion of the ferrous parts in the absorption system [9]. These issues greatly limit the applications of high-temperature absorption heat pumps, such as the triple-effect absorption refrigeration system and the absorption heat transformer.
Adding some inhibitors to the LiBr solution is an effective and economical way to reduce the copper corrosion. Inhibitors, such as chromate, molybdate, tetraborate and LiOH, can reduce the corrosion rate of copper to a certain extent by forming a passive film on the copper surface [10-12]. Benzotriazole (BTA) and its derivative, which are generally used as organic inhibitors of copper and copper alloys, can further depress the corrosion due to the formation of an insoluble and complex film [13-18]. Although these inhibitors and their mixtures are helpful in reducing the corrosion of copper in a LiBr solution, the practical requirements remain difficult to meet, especially for a temperature above 165 °C. In recent years, some new inhibitors have been synthesized to inhibit copper corrosion [19-22], although reports on their inhibition effects in a LiBr solution have not yet been found. Copper alloys usually possess strong corrosion resistance, and the corrosion behavior of Cu-Ni alloys and brass have been investigated in LiBr solutions [23-26]. However, Cu-Ni alloys still experience a large amount of corrosion in concentrated LiBrsolutions at high temperatures.
[image:2.596.84.510.659.720.2]In our previous research, LiNO3/H2O showed great potential as an alternative working fluid [27, 28]. Compared with LiBr/H2O, LiNO3/H2O had much lower corrosivity to carbon steel and aluminum, which can be used as the structural material and heat exchanging material in absorption heat pumps [29, 30]. The highest temperatures that carbon steel and aluminum can withstand are approximately 240 °C and 180 °C, respectively. Obviously, the maximum applicable temperature for an absorption heat pump is limited by the heat exchanging material. To further promote the application of high-temperature absorption heat pump, copper was used in this study as the heat exchanging material instead of aluminum, and its corrosion behavior in a concentrated LiNO3 solution at a high temperature was investigated and compared with that in a LiBr solution.
2. EXPERIMENTS
2.1 Materials
The chemical composition of the copper sample for the corrosion measurements is given in Table 1.
Table 1. The chemical composition of the copper sample
composition Si Ni Fe Zn Pb Sn S Bi Cu
The test sample was a rectangular piece (30 mm×10 mm×1 mm). Reagents of LiNO3 (GR, >99.5 wt. %), LiBr (GR, >99.5 wt. %), LiOH (GR, >92.0 wt. %), and Li2CrO4 (AR, >98.0 wt. %) (Tianjin Jinke Institute of Fine Chemicals, China) were used without further purification. HCl (AR, 36.0 wt. % to 38.0 wt. %), acetone (AR, >99.5 wt. %) (Beijing Chemical Works, China) and pure water with an electric resistance of 18.2 MΩ cm were used.
2.2 Apparatus and Procedure
The corrosion rate of copper in a LiNO3 solution was measured using the weight loss method in this paper [31, 32]. The experimental apparatus consisted mainly of the autoclave, thermal container, temperature controller and vacuum system. Before the measurement, the sealing of the autoclave was confirmed by a vacuum. If the sealing was sufficient, the prepared test solutions were poured into the autoclaves. Three burnished samples were suspended in an autoclave with Teflon tube and immersed in the solutions. After the autoclave was sealed and vacuumed, it was held in a thermal container at a given temperature for 200 hours. The temperature fluctuation was maintained within ±1 °C throughout the measurement. The detailed experimental apparatus and procedure have been reported in our previous study [29]. Usually, an electrochemical method is useful to investigate the corrosion behavior and mechanism of a metal sample in a solution under an atmospheric pressure and below its boiling temperature. As the corrosion measurements were carried out under a pressure as high as 1.0 MPa and a temperature as high as 240 °C, it is difficult to apply the electrochemical method under such conditions in this paper.
A new cleaning method was applied for the copper corrosion measurement, as the dissolubility of the corrosion product on copper was different from that on carbon steel. The test sample was immersed in 3 mol/L HCl for 5 seconds and then placed in a beaker filled with 10 ml of acetone. After being rinsed with ultrasonic waves for 3-5 minutes in acetone, it was observed that the corrosion product on the sample surface began to dissolve. As the corrosion product was thoroughly cleaned by repeating the above steps, the sample was rinsed with pure water and acetone, then dried at room temperature and weighed. To verify the reliability of this method, a polished sample was treated with the same method, and its weight was confirmed to be unchanged. Thus, it was proved that the new cleaning method never caused any chemical corrosion to the base metal. The corrosion rate was calculated using the following formula [33, 34]:
0 1 m m v
S t
(1)
where ν (g cm-2 h-1) is the corrosion rate, m0 (g) is the mass of the test sample before the corrosion, m1 (g) is the mass of the test sample after cleaning the corrosion product, S (cm2) is the surface area of the test sample, and t (h) is the corrosion time.
e 1
AARD 1/ ( ) /
N
m m
i
N v v v
(2)where ve is the corrosion rate of each specimen, and vm is the mean value of three parallel specimens. N is the overall measurement number. The largest absolute relative deviation among all measurements was 7.57 %.
The morphology images of the test samples after the corrosion in the LiNO3 solutions and LiBr solutions were analyzed by a scanning electron microscope and an energy dispersive spectrometer (SEM/EDS, ZEISSE, Germany) with an accelerating voltage of 20 kV and working distances of 10-13 mm. The phase composition of the corrosion product on the sample surface was determined by X-ray diffraction (XRD, Rigaku, Japan) with Cu Kα radiation in an angular range of 10-100° (2θ) with a step of 0.02°.
3. RESULTS AND DISCUSSION
3.1 Corrosion products
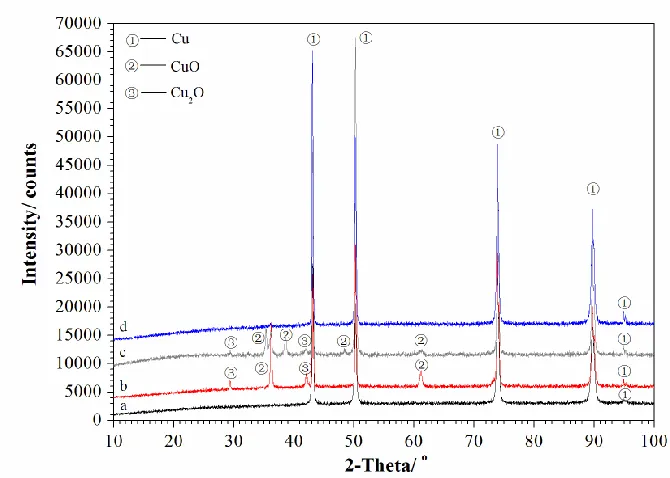
Figure 1. XRD patterns of the copper surfacesin the LiNO3 solutions for 200 h, a- polished copper; b-
in 55 wt. % LiNO3 at pH 9.7; c- in 55 wt. % LiNO3 at pH 6.7; d- in 55 wt. % LiNO3 + 0.3 wt. % Li2CrO4 at 180 °C and pH 9.7
Fig. 1 presents the XRD patterns of the copper surface in the LiNO3 solutions, in which a denotes the polished copper; b denotes the 55 wt. % LiNO3 solution at pH 9.7 and 180 °C; c denotes the 55 wt. % LiNO3 solution at pH 6.7 and 180 °C; and d denotes the 55 wt. % LiNO3 + 0.3 wt. % Li2CrO4 solution at pH 9.7 and 180 °C.
[image:4.596.130.465.354.593.2]
and 9.7 were identical, the mechanisms for the anodic oxidation of copper should be different. In the alkaline solution, OH- played an important role in the copper anodic oxidation. The anodic reactions on the copper surface should be as follows [35-38]:
-
-2 2
2Cu + 2OH = Cu O + H O + 2e φCu⊝ = - 0.356 VSHE (3)
-
-2 2
Cu O + 2OH = 2CuO + H O + 2e φCu₂O⊝ = - 0.187 VSHE (4)
Reaction (3) is the anodic oxidation reaction of copper in an alkaline solution, which results in the formation of Cu2O. In a concentrated LiNO3 solution, major Cu2O is further oxidized to CuO through reaction (4). Thus, a film comprising Cu2O and CuO is finally formed on the sample surface, where CuO should be dominant. However, at pH 6.7, the anodic oxidation of copper is related to free water instead of OH-. The anodic reactions of copper are supposed to be as follows [36, 39, 40]:
+
-2 2
2Cu + H O = Cu O + 2H + 2e φCu⊝ = 0.473 VSHE (5)
+
-2 2
Cu O + H O = 2CuO + 2H + 2e φCu₂O⊝ = 0.642 VSHE (6)
Reaction (5) is the anodic oxidation reaction of copper in a neutral solution. Similar to the corrosion in an alkaline solution, Cu2O is further oxidized to CuO through reaction (6). Thus, a complex film comprising Cu2O and CuO is also finally formed at pH 6.7.
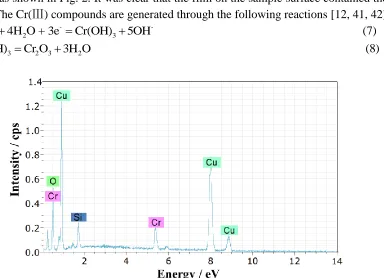
By comparing XRD spectrum d with a, it was found that there was no peak but Cu in the XRD spectrum of the corrosion products of the 55 wt. % LiNO3 + 0.3 wt. % Li2CrO4 solution at 180 °C and pH 9.7. This is likely because the film of the corrosion product on the sample surface was too thin to be detected. Nevertheless, using SEM/EDS, the element peaks of O, Cu and Cr were observed in the EDS spectrum as shown in Fig. 2. It was clear that the film on the sample surface contained the oxides of Cu and Cr. The Cr(Ⅲ)compoundsare generated through the following reactions [12, 41, 42]:
2- -
-4 2 3
CrO 4H O + 3e Cr(OH) 5OH (7)
3 2 3 2
2Cr(OH) Cr O 3H O
(8)
Figure 2. EDS spectrum of the copper surface in the 55 wt. % LiNO3 + 0.3 wt. % Li2CrO4 solution at
[image:5.596.124.508.423.701.2]
The hydroxide of Cr(Ⅲ) is generated through the cathodic reaction of CrO4
2-, which is thermodynamically metastable at a high temperature. It generally forms a more stable compound of Cr2O3 through dehydration reaction (8). Therefore, it is confirmed that a thin passive film comprising CuO, Cu2O, and Cr2O3 was formed on the sample surface for 55 wt. % LiNO3 + 0.3 wt. % Li2CrO4 solution at 180 °C.
In the weight loss measurement, the generation of some non-condensate gas was observed through recording the pressure change in the autoclave. The corrosion product gas may result from the cathodic reduction reactions. In this study, the generation of the non-condensate gas was thermodynamically analysed based on Gibbs free energy criterion [43, 44]:
,
(G)T P nF 0(spontaneous reaction) (9)
where (∆G)T,P (J mol-1) is the Gibbs free energy change of the electrode reaction under isothermal and isobaric conditions, n is the electron number in the elctrode reaction, F (96500C) is the Faraday constant, and ε(V) is the elctromotive force of cell, which equals to the difference between the cathode electrode potential φC (V) and the anode electrode potential φA (V). Because the activities of ions and the partial pressures of generated gases are difficult to be obtained, the electrode potential can not be determined by Nernst equation. Usually, the Gibbs free energy change of the electrode reaction at standard state (∆G⊝)
T,P (J mol-1) is applied to judge the direction of metal corrosion approximatively. The standard electrode potential φ⊝ (V) is calculated by the following equation:
m,f 1 ( ) i i v G nF
(10)where vi is the stoichiometric coefficient of a certain substance, and (∆G⊝m,f)i (J mol-1) is the standard molar free energy of formation of a certain substance in the electrode reaction. In this work, the φ⊝ were calculated using the ∆G⊝
m,f reported in the Lange′s Handbook of Chemistry [45].
At both pH 6.7 and 9.7, hydrogen evolution reactions are almost impossible thermodynamically, because the standard Gibbs free energy changes being a big positive value that was calculated according to the anodic oxidation reaction and the hydrogen evolution reaction:
-2 2
2H O + 2e = H 2OH φ⊝= - 0.828 VSHE (11)
The corrosion product gas should be generated through the reduction of NO3-. Copper corrosion in other solutions with nitrate ions, such as sodium nitrate and nitric acid, was investigated by previous researchers [46-48]. The corrosion of copper in a nitric acid solution involves the reduction of the nitrate ion to NO. The corrosion of copper in an alkaline sodium nitrate solution involves the reduction of the NO3- to N2, N2O, and NH3. These reduction products are also possible thermodynamically for copper corrosion in the LiNO3 solution at pH 9.7 under standard conditions. However, at pH 6.7, the reduction reaction of the NO3- to NO2, N2O4, NO, N2O2, N2O, and N2 may occur thermodynamically. In the above reactions, the reduction of NO3- to N2 has the largest standard electrode potential at both pH values, meaning that the reduction of NO3- to N2 has the strongest tendency. Therefore, the corrosion product gas is most likely to be nitrogen through the following cathodic reactions:
- +
-3 2 2
- -
-3 2 2
2NO 6H O + 10e N 12OH (pH 9.7) φ⊝= 0.250 VSHE (13)
The generation of nitrogen was also verified by analyzing the corrosion product gas with a gas chromatograph (GC6820, Agilent Technologies). The results showed that N2/O2 ratios of the corrosion product gases for both pH 6.7 and 9.7 were significantly larger than that for air.
3.2 Corrosion rate measurements
3.2.1 Effect of concentration on the corrosion rate
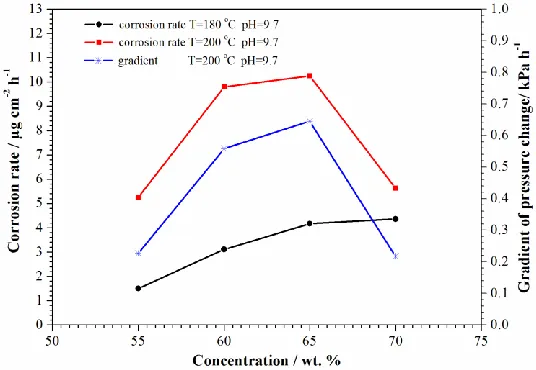
Figure 3. Effect of the concentration of the LiNO3 solutions on the corrosion rate of copper and the gradient of pressure change in the autoclave at pH 9.7 for 200 h
Figure 4. Pressures in the autoclaves for copper corrosion in the LiNO3 solutions with different concentrations at pH 9.7 and 200 °C for 200 h
[image:7.596.166.434.227.412.2] [image:7.596.160.431.475.655.2]
rate at 180 °C increased with increasing concentrations, and this trend became mild when the concentration was over 65 wt.%. The corrosion rate at 200 °C increased with increasing concentrations, whereas it decreased with further increasing concentrations from 65 wt.%. This indicated that the LiNO3 concentration had opposite effects on copper corrosion.
In the weight loss measurements, the pressure changes in the autoclaves with corrosion time for the LiNO3 solutions at pH 9.7 and 200 °C are shown in Fig. 4. The autoclave pressures increased almost linearly with the corrosion time from the initial pressures, which were the saturated vapor pressures of the LiNO3 solutions. A plot of the gradient of linear line obtained with a linear regression against the concentration is given in Fig. 3, and it is clear that there is a strong correlation between the gradient and the corrosion rate, indicating that the pressure change may be another quantitative measurement of the metal corrosion or that it can be used to assess the abnormality in the corrosion measurement with the weight loss method.
The copper corrosion should be resulted from the oxidization of NO3-. As the concentration of NO3- increased, the reduction reaction of NO3- was promoted. Correspondingly, oxidation reactions (3) and (4), resulting in the formation of Cu2O and CuO, were also promoted. However, the concentration of LiNO3 also had another opposite effect on the corrosion. Similar to a concentrated LiBr solution, the water activity decreased with increasing concentrations of LiNO3, due to the decrease in the free water and the increase in the hydration water [49]. Since water was the reactant of the reduction reaction of NO3- at pH 9.7, as the water activity decreased, the cathodic reaction was depressed thermodynamically, leading to a decrease in copper corrosion. Meanwhile, the ion diffusion coefficient decreased with increasing concentrations, because of the increase in viscosity. The diffusion coefficient equation is given below [30, 50, 51]:
6
i i
kT D
r
(14)
Where Di is the diffusion coefficient of ion, ri is the effiective radius of ion, η is the viscosity of solution, T is the absolute temperature. As the ion diffusion coefficient decreased, the diffusion of the reactants and products of the corrosion reactions was depressed kinetically, leading to the corrosion decreasing as well. The water activity of the LiNO3 solution has a positive correlation with its saturated vapor pressure, while the diffusion coefficient has a negative correlation with the viscosity. According to the results in our previous study [28], both the decrease in the vapor pressure and the increase in the viscosity were remarkable as the concentration increased from 65 wt. % to 70 wt. %, corresponding to the significant decreases in the water activity and the ion diffusion coefficient. Therefore, at a concentration above 65 wt. %, the effects of the water activity and the ion diffusion coefficient could become dominant on the corrosion rate.
Figure 5. SEM morphologies of the copper surface in the 55 wt. % and 65 wt. % LiNO3 solutions at pH 9.7 and 200 °C for 200 h
According to Fig. 5(b), the sample surface was covered by fine particles, and a compact film was formed in the 55 wt. % LiNO3 solution. As shown in Fig. 5(d), a scattered and loose film, which was weak against corrosion, was observed in the 65 wt. % LiNO3 solution. This is consistent with the result that the corrosion in the 65 wt. % LiNO3 solutions was heavier than that in the 55 wt. % LiNO3 solutions.
3.2.2 Effect of pH on the corrosion rate
The effects of pH on the corrosion rates of copper in the LiNO3 solutions at various concentrations are shown in Fig. 6. With the same concentration and temperature, the corrosion rates of copper at pH 9.7 were smaller than those at pH 6.7, and the effect of pH was enhanced with increasing concentrations.
In the mild alkaline solution, OH- has the opposite effect on copper corrosion. According to anodic reactions (3) and (4), OH- is helpful in the oxidization of Cu and the further oxidization of Cu2O. However, OH- is also the product of cathodic reactions (13), thus the cathodic reaction is depressed in the alkaline solution. This should play a prominent role in reducing the copper corrosion in the concentrated LiNO3 solution, especially at higher concentrations. Moreover, the chemical dissolution of Cu2O and CuO in the formed passive film can be depressed by OH- in the mild alkaline solution. In contrast, in the neutral solution, proton generation through reactions (5) and (6) leads to a local decrease in pH value, which may promote the dissolution of the Cu2O in the passive film through the following reactions [52]:
2+ -
-2 2
[image:9.596.138.463.69.325.2]
- + 2
OH + H = H O (16)
Additionally, CuO in the film is also thermodynamically unstable under acidic conditions. It can be dissolved through the following reaction [40]:
+ 2+ 2
CuO 2H = Cu +H O (17)
From the reaction (12), the local increase of H+ also enhances the oxidation of NO3-, leading to the promotion of the copper corrosion. Thus, copper immersed in the concentrated LiNO3 solution at pH 6.7 has a larger corrosion rate.
Figure 6. Effect of pH on the corrosion rate of copper in the LiNO3 solution with various concentrations at 180 °C for 200 h
3.2.3 Effect of the inhibitor on the corrosion rate
[image:10.596.175.420.225.400.2] [image:10.596.180.414.500.672.2]
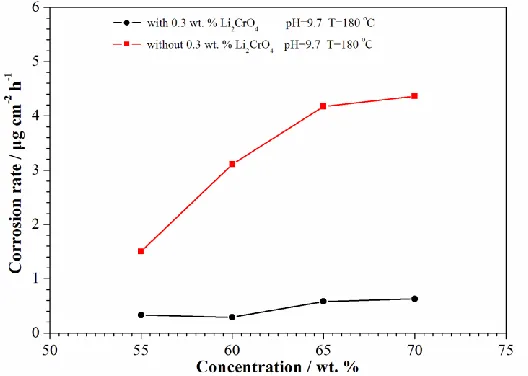
Figure 8. Effect of Li2CrO4 on the corrosion rates of copper in the LiNO3 solutions at pH 9.7 and 180 °C with various concentrations for 200 h
The use of copper corrosion inhibitors have been previously investigated by many researchers, including inorganic inhibitors (such as chromate CrO42-, molybdate MoO42- and tetraborate B4O72-) and a larger number of organic inhibitors (such as azoles, amines, amino acids and many derivatives) [53-55]. Organic inhibitors generally have the possibility of degradation with time and temperature. Among the inorganic inhibitors, chromate is generally accepted as an efficient corrosion inhibitor, which shows much better inhibition efficiency than that of molybdate and tetraborate [55]. Therefore, in this study, chromate CrO42- is used as the inhibitor of copper corrosion in the concentrated LiNO3 solution at temperatures above 160 oC.
Figs. 7 and 8show the effect of the commonly used inhibitor of Li2CrO4 on the corrosion rate of copper in the LiNO3 solutions at 180 °C with pH 6.7 and 9.7, respectively. The corrosion rates under different concentrations and pH values were obviously reduced by adding 0.3 wt. % Li2CrO4. According to the XRD patterns and EDS spectrum shown in Figs. 1 and 2 for the corrosion surface of copper with 0.3 wt. % Li2CrO4, the inhibition effect of Li2CrO4 should be based on the formation of a thin passive film comprising CuO, Cu2O, and Cr2O3 due to the strong oxidizing ability of Li2CrO4. This complex film, which was more compact than the film comprising CuO and Cu2O, effectively blocked the diffusion of the reactants and products of the corrosion reactions. Thus, the anodic oxidation of Cu and Cu2O was largely inhibited.
3.2.4 Effect of temperature on the corrosion rate
[image:11.596.166.430.70.258.2]
0 1 0
IE (%) v v 100
v
(18)
where v0 and v1 are the corrosion rates of the copper specimens in the LiNO3 solutions without and with 0.3 wt. % Li2CrO4, respectively.
[image:12.596.167.432.159.344.2]Figure 9. The effect of temperature on the corrosion rates of copper and the inhibition efficiency of Li2CrO4 in the 70 wt. % LiNO3 solution at pH 9.7 for 200 h
Figure 10. Digital picture of the surface of the copper specimens in the 70 wt. % LiNO3 solutions with and without Li2CrO4 at pH 9.7 for 200 h
[image:12.596.198.401.405.557.2]
180 °C, and it was confirmed that this passive film effectively inhibited the copper corrosion. However, at 240 °C, a gray black film was observed on both the sample surfaces with and without Li2CrO4. Meanwhile, the color of the solution with Li2CrO4 at 240 °C after the corrosion became heavily dark green, which represents the color of the Cr(III). It was more likely that the Cr(III) compound was formed first on the copper surface and then broken off due to the instability of the passive film over 220 oC. The Cu2O in the film may be dissolved in the alkaline solution under such a high temperature through the following equations [35, 56]:
-
-2 2 2
Cu O + OH = [Cu O H ] (19)
- -
2-2 2 2 2 2
Cu O H + OH = [Cu O ] + H O (20)
As the above Cu(І) species are rather unstable, the following possible reactions may also occur [35]:
-
-2 2 2
[Cu O H ] = Cu + CuO H (21)
2-
2-2 2 2
[Cu O ] = Cu + CuO (22)
Thus, the passive compact film was difficult to form above 220 °C. From the corrosion surfaces shown in Fig. 10, no local corrosion was observed, thus, the copper corrosion in the LiNO3 solution should be general corrosion. From the corrosion perspective for both copper and carbon steel[29] in the LiNO3 solution with the addition of 0.3 wt. % Li2CrO4 at pH 9.7, the concentrated LiNO3 solution can be applied as a working fluid at a temperature as high as 220 °C, which is especially important for high-temperature absorption heat pumps.
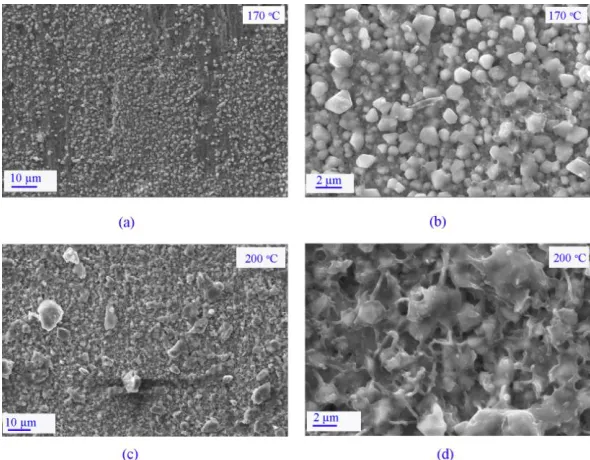
Figure 11. SEM morphologies of the copper surface in the 70 wt. % LiNO3 solutions at pH 9.7 and temperatures of 170 °C and 200 °C for 200 h
[image:13.596.150.445.414.644.2]
according to Fig. 11(c) and (d), the sample surface was loosely covered with irregular and relatively large particles at 200 °C, which was less protective against corrosion. This is also consistent with the result of the corrosion of copper at 200 °C, which was more severe than that at 170 °C.
3.3 Comparison with LiBr solution
To compare the corrosivity of the LiNO3 solution with that of the LiBr solution, the corrosion rates of copper in concentrated LiBr solutions with and without Li2CrO4 were also measured at a high temperature. The comparisons are given inFigs. 12 and 13. Obviously, the corrosion rates of copper in the LiNO3 solutions were significantly smaller than those in the LiBr solutions under the same conditions, especially when adding Li2CrO4. Moreover, being different from LiNO3 solution, the corrosion rates of copper in LiBr solution with Li2CrO4 were larger than those without Li2CrO4. This was likely due to the difference between Br- and NO3-. Br- plays a key role in the dissolution of Cu through the following complexation reactions [57, 58].
-
-2 s
Cu + 2Br = (CuBr ) e (23)
-
-2 s 2 E
(CuBr ) = (CuBr ) (24)
Reaction (23) is the complex formation between Br- anions and copper. Reaction (24) is the dissolution of (CuBr2)-s from the copper surface to the bulk solution and it is the controlled step in the anodic dissolution of copper. Therefore, due to the strong aggressivity of Br-, a compact passive film is hardly formed on the copper surface. In contrast, the complexation reaction between NO3- and copper barely occurs because of N in NO3- not having lone pair electrons in its outer electronic orbit.
Figure 12. Comparison of the corrosion rate of copper in the LiNO3 and LiBr solutions without Li2CrO4 at pH 9.7 and temperatures of 180 °C and 220 °C for 200 h
[image:14.596.182.414.453.611.2][image:15.596.141.460.160.385.2]
the addition of Li2CrO4, there were some peaks of CuO and Cu2O in addition to Cu in the XRD spectrum for the LiBr solution, whereas only the peaks of Cu were observed in the LiNO3 solution. It wasconcluded that the amount of corrosion product formed on the copper surface in the LiBr solution was much more than that in the LiNO3 solution.
Figure 13. Comparison of the corrosion rate of copper in the LiNO3 and LiBr solutions with Li2CrO4 at pH 9.7 and temperatures from 160 °C to 220 °C for 200 h
[image:15.596.137.458.467.688.2]
Figure 15. Comparison of SEM morphologies of the copper surfaces in 70 wt. % LiBr and 70 wt. % LiNO3 solutions with and without Li2CrO4 for 200 h
Fig. 15 shows a comparison of the SEM morphologies of the copper surface for LiNO3 and LiBr solution at pH 9.7 and 220 °C, in which (a) is for 70 wt. % LiNO3 solution; (b) is for 70 wt. % LiNO3 + 0.3 wt. % Li2CrO4 solution; (c) is for 70 wt. % LiBr solution; and (d) is for 70 wt. % LiBr + 0.3 wt. % Li2CrO4 solution. As shown in Fig. 15(a) and (c), the films that formed in both the LiBr and the LiNO3 solutions without Li2CrO4 were rough and loose, which cannot effectively prevent copper corrosion. As shown in Fig. 15(b), with the addition of Li2CrO4, a thin and compact passive film that effectively blocked the diffusion of the reactants and products of the corrosion reactions was formed on the surface in the LiNO3 solution. In contrast, as shown in Fig. 15(d), the film that formed in the LiBr solution was not effective at blocking the diffusion of the reactants and products of the corrosion reactions due to being thick yet nonhomogeneous and porous. This is consistent with the results of the corrosion measurement and XRD analysis.
4. CONCLUSIONS
[image:16.596.147.451.68.309.2]
(2) The copper corrosion was heavier in the neutral solution than in the mild alkaline solution. At pH 6.7, H+ generated from the oxidation of Cu and Cu2O promoted the cathodic reduction reaction of NO3-, while at pH 9.7, OH-depressedthe reduction of NO3-;
(3) A thin and compact passive film comprising CuO, Cu2O and Cr2O3 was formed in the LiNO3 solution with the addition of 0.3 wt. % Li2CrO4. This complex film effectively inhibited copper corrosion;
(4) Elevation of the temperature kinetically enhanced the diffusion rates of the corrosion reactants and products, and promoted both the anodic reaction and cathodic reaction, leading to increases in the Cu corrosion rate. The IE of Li2CrO4 decreased with increasing temperatures. When the temperature was over 220 °C, IE decreased to less than 10% as the compact passive film was difficult to form at such a high temperature;
(5) The corrosion rate had a strong correlation with the increasing rate of the pressure in the autoclave, which was related to the gaseous corrosion products;
(6) The corrosion rate of copper in the LiNO3 solution was much smaller than that in the LiBr solution. Regarding corrosivity, the maximum applicable temperature for the absorption heat pump was extended from 165°C to 220 °C using a LiNO3 solution instead of a LiBr solution as the working fluid.
ACKNOWLEDGEMENTS
The authors gratefully acknowledge the financial support from the China Postdoctoral Science Foundation (No.: 2014M560049), the Science Foundation of the Ministry of Education of China (No.: FRF-TP-15-023A2) and the National Nature Science Foundation of China (NO.:51506005).
References
1. C. Keil, S. Plura, M. Radspieler and C. Schweigler, Appl. Therm. Eng., 28 (2008) 2070. 2. Y. Li and L. Fu, Energy, 36 (2011) 4570.
3. E. Sarmiento, J.G. Gonzalez-Rodriguez and J. Uruchurtu, Surf. Coat. Tech., 203 (2008) 46. 4. M. Itagaki, Y. Hirata and K. Watanabe, Corros. Sci., 45 (2003) 1023.
5. K. Tanno, S. Saito, M. Itoh and A. Minato, Boshoku Gijutsu, 33 (1984) 516.
6. R. Sánchez-Tovar, M. T. Montañés and J. García-Antón, Corros. Sci., 60 (2012) 118. 7. R. Sánchez-Tovar, M. T. Montañés and J. García-Antón, Corros. Sci., 52 (2010) 722.
8. M. J. Muñoz-Portero, J. García Antón, J. L. Guiñón and V. Pérez Herranz, Corrosion, 62 (2006) 1018.
9. H. Cheng, Sep. Purif. Technol., 52 (2006) 191.
10.A. Igual Muñoz, J. García Antón, J. L. Guiñón and V. Pérez Herranz, Electrochim. Acta, 50 (2004) 957.
11.N. Huang, C. Cheng, Journal of Dalian University of Technology, 44 (2004) 646.
12.N. Huang and C. Cheng, Journal of Chinese Society for Corrosion and Protection, 24 (2004) 179. 13.M. Finšgar and I. Milošev, Corros. Sci., 52 (2010) 2737.
14.Y. H. Lei, N. Sheng, A. Hyono, M. Ueda and T. Ohtsuka, Prog. Org. Coat., 77 (2014) 339. 15.Z. Chen, L. Huang, G. Zhang, Y. Qiu and X. Guo, Corros. Sci., 65 (2012) 214.
16.S. M. Milić and M. M. Antonijević, Corros. Sci., 51 (2009) 28.
18.D. Gelman, D. Starosvetsky and Y. Ein-Eli, Corros. Sci., 82 (2014) 271. 19.E. M. Sherif and S.M. Park, Electrochim. Acta, 51 (2006) 6556.
20.D. Q. Zhang, B. Xie, L. X. Gao, H. G. Joo and K. Y. Lee, J. Appl. Electrochem., 41 (2011) 491. 21.T. T. Qin, J. Li, H.Q. Luo, M. Li and N.B. Li, Corros. Sci., 53 (2011) 1072.
22.G. Tansuğ, T. Tüken, E. S. Giray, G. Fındıkkıran, G. Sığırcık, O. Demirkol and M. Erbil, Corros. Sci., 84 (2014) 21.
23.D. Itzhak and T. Greenberg, Corrosion, 55 (1999) 795.
24.A. Igual Muñoz, J. García Antón, J. L. Guiñón and V. Pérez Herranz, Corrosion, 59 (2003) 32. 25.E. Martinez Meza, J. Uruchurtu Chavarin and J. Genesca Liongeras, Corrosion, 65 (2009) 461. 26.E. A. Abd El Meguid and N. K. Awad, Corros. Sci., 51 (2009) 1134.
27.C. Luo, Q. Su and W. Mi, Int. J. Refrig., 36 (2013) 1689. 28.C. Luo, Q. Su and W. Mi, J. Chem. Eng. Data, 58 (2013) 625. 29.C. Luo and Q. Su, Corros. Sci., 74 (2013) 290.
30.C. Luo, Int. J. Electrochem. Sci., 10 (2015) 4706.
31.S. Jiangzhou and R. Wang, Appl. Therm. Eng., 21 (2001) 1161. 32.C. Liang and X. Hu, J. Iron. Steel Res. Int., 15 (2008) 49.
33.H. Zarrok, A. Zarrouk, B. Hammouti, R. Salghi, C. Jama and F. Bentiss, Corros. Sci., 64 (2012) 243.
34.Y. G. Avdeev, Y. I. Kuznetsov and A. K. Buryak, Corros. Sci., 69 (2013) 50.
35.M. R. Gennero de Chialvo, S. L. Marchiano and A. J. Arvía, J. Appl. Electrochem., 14 (1984) 165. 36.L. D. Burke, M. J. Ahern and T. G. Ryan, J. Electrochem. Soc., 137 (1990) 553.
37.G. M Brisard, J. D. Rudnicki, F. Mclarnon and E. J. Cairns, Electrochim. Acta, 40 (1995) 859. 38.F. Rosalbino, R. Carlini, F. Soggia, G. Zanicchi and G. Scavino, Corros. Sci., 58 (2012) 139. 39.M. Scendo, Corros. Sci., 50 (2008) 1584.
40.D. Tromans and R. Sun, J. Electrochem. Soc., 139 (1992) 1945.
41.Y. B. Zhu, Z. C. Shen, C. F. Zhang, D. P. Huang, Z. X. Yu and H. Z. Gong, Handbook of Electrochemical Data, Hunan Science and Technology Press, (1985) Hunan, China.
42.M. Pourbaix, Atlas of Electrochemical Equilibria in Aqueous Solutions, Pergamon Press, (1966) Oxford, UK.
43.M. Gong, Z. X. Yu and L. Chen, Metal Corrosion Theory and Corrosion Control, Chemical Industry Press, (2009) Beijing, China.
44.Y. Sun and J. Hu, Metal Corrosion and Corrosion Control, Harbin Institute of Technology Press, (2010) Harbin, China.
45.J.A. Dean, Lange’s Handbook of Chemistry, McGraw-Hill Book Company, (1985) New York, USA.
46.A. M. Eldesoky, H. M. Hassan and A. S. Fouda, Int. J. Electrochem. Sci., 8 (2013) 10376. 47.K. Bouzek, M. Paidar, A. Sadilkova and H. Bergmann, J. Appl. Electrochem., 31 (2001) 1185. 48.J. D. Genders and D. Hartsough, J. Appl. Electrochem., 26 (1996) 1.
49.K. Tanno, M. Itoh, T. Takahashi, H. Yashiro and N. Kumagai, Corros. Sci., 34 (1993) 1441. 50.Q. X. Cha, Introduction to Kinetics of Electrode Processes, Science Press, (2002) Beijing, China. 51.Z. Panossian, N. L. de Almeida, R. M. F. de Sousa, G. de Souza Pimenta and L. B. S. Marques,
Corros. Sci., 58 (2012) 1.
52.L. Wu, L. Tsui, N. Swami and G. Zangari, J. Phys. Chem. C, 114 (2010) 11551.
53.M. A. Ramirez-Arteaga, J. G. Gonzalez-Rodriguez, E. Sarmiento-Bustos and I. Rosales, Int. J. Electrochem. Sci., 9 (2014) 161.
54.A. Zarrouk, I. Warad, B. Hammouti, A. Dafali, S. S. Al-Deyab and N. Benchat, Int. J. Electrochem. Sci., 5 (2010) 1516.
55.M. M. Antonijevic and M. B. Petrovic, Int. J. Electrochem. Sci., 3 (2008) 1. 56.N. B. Huang and C. H. Liang, Refrigeration, 4 (2002) 28.
58.R. Leiva-García, M. J. Muñoz-Portero, J. García-Antón and R. Sánchez-Tovar, Int. J. Electrochem. Sci., 7 (2012) 1332.