Open Access
R E S E A R C H A R T I C L E
© 2010 Aletras et al; licensee BioMed Central Ltd. This is an Open Access article distributed under the terms of the Creative Commons Attribution License (http://creativecommons.org/licenses/by/2.0), which permits unrestricted use, distribution, and reproduction in any medium, provided the original work is properly cited.
Research article
Development and preliminary validation of a
questionnaire to measure satisfaction with home
care in Greece: an exploratory factor analysis of
polychoric correlations
Vassilis H Aletras*
1,2, Arsenis Kostarelis
2, Maria Tsitouridou
2, Dimitris Niakas
2and Anna Nicolaou
1Abstract
Background: The primary aim of this study was to develop and psychometrically test a Greek-language instrument for measuring satisfaction with home care. The first empirical evidence about the level of satisfaction with these services in Greece is also provided.
Methods: The questionnaire resulted from literature search, on-site observation and cognitive interviews. It was applied in 2006 to a sample of 201 enrollees of five home care programs in the city of Thessaloniki and contains 31 items that measure satisfaction with individual service attributes and are expressed on a 5-point Likert scale. The latter has been usually considered in practice as an interval scale, although it is in principle ordinal. We thus treated the variable as an ordinal one, but also employed the traditional approach in order to compare the findings. Our analysis was therefore based on ordinal measures such as the polychoric correlation, Kendall's Tau b coefficient and ordinal Cronbach's alpha. Exploratory factor analysis was followed by an assessment of internal consistency reliability, test-retest reliability, construct validity and sensitivity.
Results: Analyses with ordinal and interval scale measures produced in essence very similar results and identified four multi-item scales. Three of these were found to be reliable and valid: socioeconomic change, staff skills and attitudes and service appropriateness. A fourth dimension -service planning- had lower internal consistency reliability and yet very satisfactory test-retest reliability, construct validity and floor and ceiling effects. The global satisfaction scale created was also quite reliable. Overall, participants were satisfied -yet not very satisfied- with home care services. More room for improvement seems to exist for the socio-economic and planning aspects of care and less for staff skills and attitudes and appropriateness of provided services.
Conclusions: The methods developed seem to be a promising tool for the measurement of home care satisfaction in Greece.
Background
The elderly in the European Union constitute a signifi-cant segment of the society, which is expected to rise in the future [1]. In 2005 there were 79 million individuals over the age of 65 in Western and Central Europe. This figure will increase to 107 million in 2025 (+ 35%) and to 133 million in 2050 (+ 68%). The largest growth in this age group will be observed for those over 80 years (+
180%). By 2030, in contrast, all other adult age groups will be declining in size. There is therefore a gradual shift from a society dominated by young individuals to a soci-ety in which the elderly will become the majority. The need for the provision of social services is exacerbated by the observed social exclusion, financial difficulties and health problems related to this particular age group. The World Health Organization has thus placed "good aging" fifth among its targets for the 21st century.
This has led to the adoption of practices which aimed at the promotion of the well-being of the elderly on a social
* Correspondence: [email protected]
1 Department of Business Administration, University of Macedonia, 156 Egnatia
str., P.O. Box 1591, Thessaloniki 54006, Macedonia, Greece
as well as on a physical level. Home care programs have been evolving in European countries for many decades based on the aforementioned and comprise the most important attempt to support the vulnerable social group of the elderly [2]. As one of the few social initiatives of local government in Greece ten years ago, legislation was enacted in the majority of municipalities for the elderly and people with disabilities. The program aimed at improving the quality of life of the enrollees. Its effective-ness nevertheless has never been formally assessed. This is not surprising since research on patient satisfaction by means of validated questionnaires is in fact very scarce in Greece [3,4].
The program of providing home care services to the elderly and disabled begun in 1996 and quickly spread to most municipalities in Greece [5]. Seventy five percent of the necessary funds have been provided by the European Union and the rest through national financing [6]. By the beginning of 2005 there were 1084 home care units estab-lished serving 40,060 enrollees [7]. The general purpose of the program was to confront the social exclusion and institutionalization as well as to improve the quality of life of the elderly and the disabled. Priority has been given to individuals with an inability for self-care, who lived alone and had limited financial resources to improve their liv-ing standards and become independent.
In order to achieve these goals, social work, nursing care and life assistance services have been used [8]. The social worker is responsible, at an initial stage, for the needs assessment of the applicants, the scheduling of home visits and the determination of the range of pro-vided services. Moreover, this employee is assigned with the task of co-operating with local parties, welfare ser-vices, voluntary organizations and the linking of the home care program with the participants and the local community. His/her role also includes provision of coun-seling and emotional support to the enrollees and their caregivers as well as admission to various institutions (e.g. hospitals, welfare, mental health units) when neces-sary. Nursing care is prevention-oriented. Information is provided regarding the illnesses and diseases enrollees are facing or are likely to face in the future. Nursing also addresses the enrollees' nutrition. Blood tests (including blood glucose tests), examination of vital signs and medi-cation compliance are targeted towards the preservation of health, the self-care of enrollees and the establishment of a safe environment. Information is provided and the family and other caregivers are trained, so that they can handle problems more effectively. The aide workers' assistance includes help with personal hygiene, light housework, grocery shopping or other small purchases, payment of bills, meal preparation and other life-assisting activities. The interaction of all team members is often essential, especially for activities such as companionship,
social mobilization of enrollees, emotional and psycho-logical support and co-operation with caregivers.
In this study we developed and tested a questionnaire for measuring home care satisfaction in Greece. Although other questionnaires were available on an inter-national level, there are significant differences in the vari-ous national settings that made the development of a customized instrument necessary. First, in several coun-tries the specific home care services enjoyed by the par-ticipants depend on private payments or a person's contribution to a health insurance fund, whereas in Greece all services are provided free of charge by the municipalities. They are therefore determined solely by assessing relative needs. Second, in Greece the team which offers the home care services comprises mainly of a social worker, a nurse and two aide workers, whereas other specialties (medical doctors, psychologists, physio-therapists) encountered in other countries might or might not be included, depending on the specific munici-pality's policy. In addition, other services, such as meal preparation, might be available to all upon request abroad, yet only in certain programs and individuals in Greece. In general, there are important differences in the structure and mode of provision of home care services between countries, related to the methods of financing, as well as the cultural and social factors.
The aim of this study was to measure home care satis-faction by developing an appropriate questionnaire that covers the Greek home care provision. The tool devised was psychometrically tested and subsequently the level of satisfaction with home care services was measured. A novel concept in this work is the use of polychoric corre-lations in the factorial analysis and psychometric testing, which acknowledges the ordinal nature of the data, typi-cally ignored in relevant prior research.
Methods
A questionnaire in Greek was developed to measure the satisfaction of enrollees with home care services. Items were phrased using a typical 5-point Likert scale with 1 indicating "strongly disagree" and 5 corresponding to "strongly agree". Positively and negatively worded items were interchanged to avoid positive biases [9]. Negative worded questions were therefore subsequently re-coded so that higher values would indicate higher levels of enrollee satisfaction, and vice versa.
Satisfaction items reflect all the important aspects of the home care program, namely effectiveness, safety, respect, attention, participation in planning, correctness of planning, access, socialization and technical abilities of staff. The literature sought included theoretical papers, questionnaire validations and qualitative analyses [10-29]. Two questions included referred to general satisfac-tion from the provided home care services. Regarding socioeconomic and demographic variables, we recorded gender, age, educational level, income, family status, enrolment duration, visit frequency and informal caregiv-ers [10]. Two more items were incorporated in order to exclude individuals that gave inconsistent responses. These had the same meaning as other questions but were differently phrased.
An important subsequent step in instrument develop-ment was pretesting, which took the form of cognitive interviews with elderly and disabled participating in the programs [30]. There were 10 such subjects from each group. These identified problems with the content and understanding of the questions, as well as additional causes of (dis)satisfaction, not captured by the instru-ment, thus enhancing reliability and content validity. Towards the same end, individuals pinpointed questions identified by the literature search that had to be removed from the instrument as being unimportant. The same persons were approached after a revision of the question-naire and no additional issues were identified. Moreover, expert panel judgment was also exploited to ensure con-tent validity and item clarity.
We initially screened the data by assessing (Spearman's) correlation coefficients between the items capturing sat-isfaction from specific characteristics of home care and the two items measuring overall satisfaction. Theory sug-gests that there might be a relationship apparent between overall satisfaction and satisfaction from individual ser-vices [9,31]. Specifically, overall satisfaction emerges from customer's evaluations of service encounters, which in turn are evaluated on the basis of service attributes (e.g. response time of the nurse). The latter are evaluated on the basis of positive and negative events that occur during the encounter with the provider. In this sense, the overall evaluation of the provider might be a weighted average of all evaluations of service attributes, the weights being the importance assigned by the customer to each attribute.
In our context, however, one needs additional justifica-tion for excluding items from the survey, than simply observing insignificant correlations, for two reasons. First, we employed in this research two questions that have been used most frequently in practice for measuring overall satisfaction. It is nevertheless theoretically possi-ble that they do not fully cover all the aspects of satisfac-tion from the service encounter, as perceived by customers. Second, a single item might have to move a
great deal in order to have a significant effect on overall quality and there might be additional effects of the partic-ular item when combined with other related questions. For these reasons, statistically insignificant correlations observed in this study only served as triggers for further investigation of specific items.
The questionnaire was administered to enrollees of home care programs, who were elderly and disabled in the age group of 65 to 90 years. An inclusion criterion to the study entailed that the subjects should have been par-ticipating in the program for at least two months, follow-ing Westra et al. [15]. The sample was approached from March 7 to April 3, 2006 with face-to-face interviews by trained interviewers. The study was approved by the Review Board of the Hellenic Open University. Subjects were told that their anonymity would be assured in the study. We excluded those who faced health disorders/ problems that affected their mental state (e.g. Alzheimer's disease, severe stroke). Subsequently, five home care pro-grams in Thessaloniki were randomly selected from a total of 36 programs that existed in municipalities of the city having more than 10,000 residents: Municipality of Stavroupoli (two home care programs), Municipality of Thermaikos, Municipality of Menemeni and Pefka Vil-lage. Although a consensus is lacking, samples with at least 200 persons and an observation-to-item ratio higher than 5:1 are generally acceptable in this type of research [32]. The interviewers visited the houses of all 319 enroll-ees in these programs that matched the inclusion criteria at the time of the study.
Summated scales were formed by exploratory factor analysis [33]. The Kaiser-Meyer-Olkin measure of sam-pling adequacy and Bartlett's test of sphericity were used to check whether the data were suitable for factor analy-sis. Values of KMO greater than 0.70 have been charac-terized as "middling" (and greater than 0.90 as "marvelous"). Bartlett's test of sphericity tests the null hypothesis that the correlation matrix is an identity matrix (i.e. that there is no relationship between the items) [34].
The main factor analysis carried out in this study acknowledges the fact that the 5-point Likert scale is in fact ordinal [39]. It was hence based on polychoric corre-lations. The polychoric correlation coefficient assumes that pairs of ordinal scores are in fact generated by latent bivariate normally distributed random variables. Measur-ing the association between ordinal variables entails the estimation of the product moment correlation between the corresponding normally distributed variables. Inter-estingly, a recent study that utilized a generalized poly-choric coefficient found that it does not outperform the typical polychoric measure in cases where the sample size is smaller than 400 observations and the number of ordi-nal categories in the response scale is greater than three [40]. The polychoric correlation matrix was estimated using the two-stage procedure described in Jöreskog [41] and implemented in PRELIS v.2.8 [42]. Note that since the matrix was estimated in a pairwise fashion it was pos-sible to be non-positive definite. An exploratory factor analysis was then performed entering the estimated poly-choric correlation matrix into SPSS v.15.
Since prior research has mainly assumed that the Likert scale can be treated as an interval or ratio scale, we also performed, for comparative purposes, typical factor anal-yses based on Pearson correlations. In addition to unweighted least squares, we also extracted factors with principal axis factoring to account for the skewness observed in the data [43,44].
Internal consistency reliability measures the extent to which all items within a scale are indeed capturing the same construct. Cronbach's alpha coefficients greater than 0.80 indicate high levels of internal consistency, whereas values less than 0.70 suggest that the researcher should attempt deleting individual items from the scales to examine whether consistency improves [45]. Due to the ordinal nature of the data, an ordinal standardised item alpha coefficient was also derived by inserting poly-choric correlations into the simplified formula of the alpha coefficient [46,47]. Note that prior research has examined the potential effect of skewness to this form of reliability coefficients and has found no impact of square root and log transformations on Cronbach's alpha coeffi-cients [48]. A further criterion used to assess internal consistency reliability was inter-item correlations. Prior research has argued that items within a scale with lower correlations than 0.30 might not be sufficiently related to be used as measures of the same phenomenon, whereas items with correlations higher than 0.70 might be redun-dant [49]. We calculated Spearman's coefficients, thus taking into account potential skewness.
The degree to which scales are sensitive to external fac-tors in successive measurements was assessed by examin-ing test-retest reliability. The second administration occurred two weeks after the initial measurement. In this
study, intraclass correlations were preferred to Pearson product moments coefficients because the test and retest variables originated from the same group of individuals and the former coefficients could detect systematic errors [50,51]. There is no consensus regarding the appropriate standards for the value of the coefficients [52]. Neverthe-less, a value of 0.70 is considered satisfactory in practice [53]. In addition, to account for possible skewness in the data, we also employed Kendall's Tau b, which is a distri-bution-free correlation measure.
Multi-trait analysis was then performed to assess inter-nal consistency reliability, construct validity and within-scale item additivity. It is a psychometric technique applied when a questionnaire is hypothesized to capture several distinct theoretical constructs - concepts, each measured by several individual items (questions). The criteria assessed are [54]:
• Each item should have a high correlation with all other items in the summated scale in which it is assumed to belong (item internal consistency). 0.40 represents the lowest acceptable correlation reflecting consistency.
• The correlation of an item with the sum of all other items in its scale should be higher than its respective correlations with all other summated scale scores (item discriminant validity).
• For items within a summated scale, the correlation between one item and the sum of the other items should be of roughly the same magnitude for all items (equal item-own scale correlation).
• Items in the same summated scale should have roughly equal variances.
If criteria 1 and 2 are not met, the groupings should be reconsidered and if criteria 3 and 4 are not met, weight-ing of items while formweight-ing summated scales should be pursued.
In the multi-trait analysis conducted we acknowledged the ordinal nature of the data as well as the potential skewness of individual item scores. We therefore com-pared Pearson, Spearman, polychoric and polyserial cor-relation results, following prior research [55]. In the first case, we used a t-statistic for testing the significance of the difference between two dependent correlations [56]. Spearman's Rho is suitable for ordinal data since it is based on ranks of data. Note also that wherever a variable (multi-item scale) had more than 15 categories, it was treated as continuous. Therefore, a polyserial correlation was used for its association with other ordinal variables.
account for data ordinality and skewness we computed polychoric, polyserial, Spearman and Kendall's Tau b coefficients.
Ceiling and floor effects for the created multi-item scales were examined by assessing the percentage of responses falling into the highest and lowest possible sat-isfaction scores (i.e. strongly agree and strongly disagree). These are measures of the sensitivity of the tool. Finally, we computed the means and medians of the created scales in order to measure satisfaction with various aspects of home care as well as overall enrollee satisfac-tion. In fact, we linearly converted the scores into a 0-100 point scale.
Results
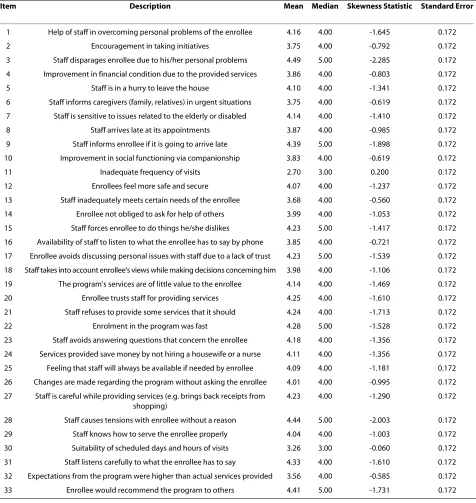
Initially, the questionnaire created included 33 items measuring satisfaction with individual aspects of home care. For most items, Spearman correlation coefficients between items and the two questions of overall satisfac-tion were statistically different from zero (p < 0.05). In contrast, two questions meant to capture satisfaction with individual attributes of home care had correlations with overall measures that were insignificant. These were "I believe there should be more staff (e.g. nurses, social workers) involved in the program" and "The home care program is in need of additional specialties (e.g. physi-cians, physiotherapists)". The reason why we eventually decided to exclude these two items was that they seem to refer to somehow technical aspects of care that the enrollees might not be to an extent able to answer cor-rectly. Content validity does not seem to be sacrificed from this exclusion due to the existence of items 11 and 13, which ask enrollees whether they believe they should be visited more frequently and whether their needs are met. The items measuring individual aspects of enrollee satisfaction we used in the statistical analyses were there-fore 31. Two more questions reflected overall satisfaction with home care programs. These are shown in Table 1 (Additional file 1 contains the original questionnaire).
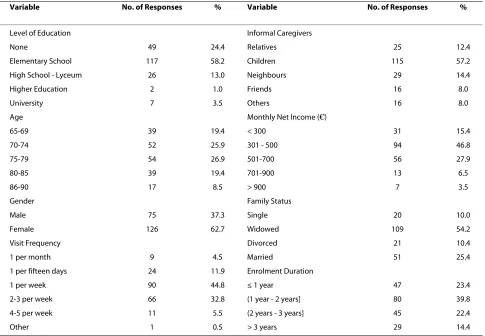
From the 319 home care enrollees visited, 17 were absent at the time of the visit and 91 refused to partici-pate in the study, yielding an initial sample of 211 face-to-face interviews. Among the participants, 93 were living in Stavroupoli (44.1%), 46 in Thermaikos (21.8%), 41 in Menemeni (19.4%) and 31 in Pefka (14.7%). Six respon-dents were excluded failing the validity test by providing different replies in the two control questions. Four more did not respond to the majority of items. The final sample consisted of 201 usable interviews, yielding a response rate of 63% and an observation-to-item ratio of 6.48:1. There were no missing values in the remaining question-naires. This entails clarity of the constructed items. The majority of enrollees in the final sample was women and had little or no education. Most participants were being
visited 1-3 times each week by workers of the home care program and were getting additional help in their lives from their children. Their net monthly income was less than €700 (Table 2).
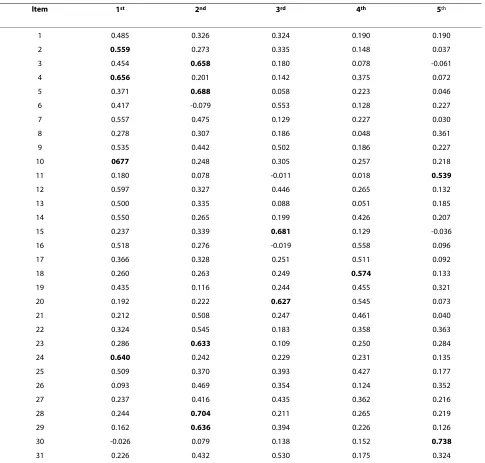
The KMO measure was 0.942 and Bartlett's test was statistically significant (p < 0.01). As can be seen in Table 3, factor analysis based on polychoric correlations and performed with unweighted least squares and varimax rotation yielded five factors, which explain 61.16% of the variance in the original 31 variables. One factor con-tained only one item and thus could not form a sum-mated scale by itself. Items 2, 4, 10 and 24 made up the scale "socio-economic change", questions 3, 5, 23, 28 and 29 constituted the scale "staff skills and attitudes", items 15 and 20 the scale "service appropriateness" and ques-tions 11 and 30 formed the scale "service planning". Note that item 20 in the "service appropriateness" scale had in fact a high factor loading also with the one-item factor mentioned above. Since that factor has been disregarded for having only one item, we decided to retain item 20 and its two-item scale, despite the fact that the difference in factor loadings was less than 0.20.
The factor analysis was repeated with Pearson correla-tions. The variance explained was similarly high (62.97%) and - although there were some differences in the actual correlations used- the factors obtained with this approach were identical to those obtained with poly-choric correlations. Hence these results are not presented here. Furthermore, given the skewed nature of the data documented in Table 1, analysis was also carried out with principal axis factoring. Results (not shown here) indi-cated that the factors identified were identical to those derived by unweighted least squares.
three scales ranged from 0.359 to 0.624. However, the two items we assigned to the "service planning" dimension had a correlation coefficient of only 0.280.
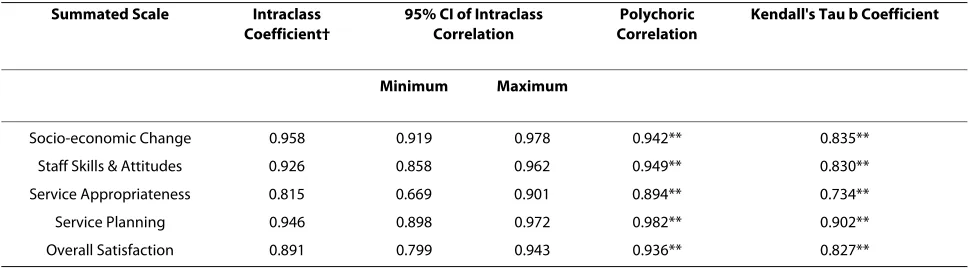
Table 6 reports test-retest correlations. 52 enrollees were approached and 36 had agreed to complete the questionnaire for a second time, a response rate of 69.23%. The values of the statistics are considered to be satisfactory for all scales.
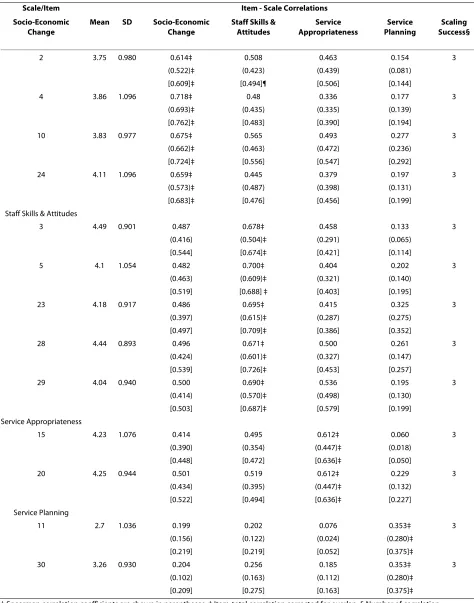
Multitrait scaling yielded satisfactory results. Table 5 shows that the first criterion of item internal consistency
[image:6.595.61.537.114.617.2]was met for three scales, since the Pearson, Spearman and polychoric correlations took values above 0.40. It was not satisfied, however, for the service planning scale. The second criterion of divergent validity was fully met for all scales. Regardless of which correlation coefficient we employed, in all cases the correlation of an item with its own scale was higher than its correlation with other sum-mated scales. Differences were in fact significant (p < 0.05). With respect to the third criterion, for the two scales that contained more than two items, the ranges of Table 1: Description of items measuring satisfaction with home care
Item Description Mean Median Skewness Statistic Standard Error
1 Help of staff in overcoming personal problems of the enrollee 4.16 4.00 -1.645 0.172
2 Encouragement in taking initiatives 3.75 4.00 -0.792 0.172
3 Staff disparages enrollee due to his/her personal problems 4.49 5.00 -2.285 0.172
4 Improvement in financial condition due to the provided services 3.86 4.00 -0.803 0.172
5 Staff is in a hurry to leave the house 4.10 4.00 -1.341 0.172
6 Staff informs caregivers (family, relatives) in urgent situations 3.75 4.00 -0.619 0.172
7 Staff is sensitive to issues related to the elderly or disabled 4.14 4.00 -1.410 0.172
8 Staff arrives late at its appointments 3.87 4.00 -0.985 0.172
9 Staff informs enrollee if it is going to arrive late 4.39 5.00 -1.898 0.172
10 Improvement in social functioning via companionship 3.83 4.00 -0.619 0.172
11 Inadequate frequency of visits 2.70 3.00 0.200 0.172
12 Enrollees feel more safe and secure 4.07 4.00 -1.237 0.172
13 Staff inadequately meets certain needs of the enrollee 3.68 4.00 -0.560 0.172
14 Enrollee not obliged to ask for help of others 3.99 4.00 -1.053 0.172
15 Staff forces enrollee to do things he/she dislikes 4.23 5.00 -1.417 0.172
16 Availability of staff to listen to what the enrollee has to say by phone 3.85 4.00 -0.721 0.172
17 Enrollee avoids discussing personal issues with staff due to a lack of trust 4.23 5.00 -1.539 0.172
18 Staff takes into account enrollee's views while making decisions concerning him 3.98 4.00 -1.106 0.172
19 The program's services are of little value to the enrollee 4.14 4.00 -1.469 0.172
20 Enrollee trusts staff for providing services 4.25 4.00 -1.610 0.172
21 Staff refuses to provide some services that it should 4.24 4.00 -1.713 0.172
22 Enrolment in the program was fast 4.28 5.00 -1.528 0.172
23 Staff avoids answering questions that concern the enrollee 4.18 4.00 -1.356 0.172
24 Services provided save money by not hiring a housewife or a nurse 4.11 4.00 -1.356 0.172
25 Feeling that staff will always be available if needed by enrollee 4.09 4.00 -1.181 0.172
26 Changes are made regarding the program without asking the enrollee 4.01 4.00 -0.995 0.172
27 Staff is careful while providing services (e.g. brings back receipts from shopping)
4.23 4.00 -1.290 0.172
28 Staff causes tensions with enrollee without a reason 4.44 5.00 -2.003 0.172
29 Staff knows how to serve the enrollee properly 4.04 4.00 -1.003 0.172
30 Suitability of scheduled days and hours of visits 3.26 3.00 -0.060 0.172
31 Staff listens carefully to what the enrollee has to say 4.33 4.00 -1.610 0.172
32 Expectations from the program were higher than actual services provided 3.56 4.00 -0.585 0.172
the various correlation coefficient values were quite nar-row. Similar values were also evident for the variances in the four summated scales, suggesting that the last crite-rion of the multitrait analysis was also satisfied.
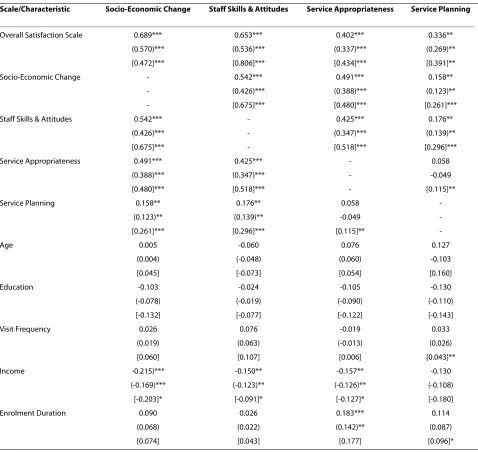
Inter-scale correlations are reported in Table 7. For the scales "socio-economic change", "staff skills & attitudes" and "service appropriateness" spearman, polychoric and polyserial correlations were all higher than the suggested literature value of 0.40 and significant (p < 0.05), whereas Kendall Tau coefficients in some cases fell a little short of this and yet were still statistically significant. Further-more, as expected, summated scale scores were positively related to overall satisfaction. Regarding "service plan-ning", the criterion for the inter-scale correlations was not met and the relationship with overall satisfaction was weaker than that of other scales with the same global measure.
Finally, Spearman's and Kendall's Tau correlations sug-gest some significant relationships of scales with respon-dents' characteristics that conform to our prior beliefs. As expected, net monthly income was negatively related to satisfaction with socio-economic change, staff skills & attitudes and service appropriateness. It was unrelated to
service planning satisfaction. In addition, the duration of enrolment might be positively related to satisfaction with service appropriateness. These results however should be interpreted with some caution since polychoric and poly-serial correlations lacked statistical significance (p > 0.05). These latter correlations also revealed an expected significant positive relation between visit frequency and satisfaction with service planning.
The percentages of observations falling into the highest satisfaction score category for the four summated scales were 7%, 15.4%, 35.3% and 3.5%, respectively. The respec-tive floor effects were very limited and equal to 0.5%, 0.5%, 2% and 2.5%. Note that high ceiling effects are not uncommon in the literature [58], although some studies do find such effects to be more limited, that is lower than 10-12% [59].
[image:7.595.57.542.113.449.2]Median (mean) satisfaction from socio-economic aspects of care, staff skills and attitudes, appropriateness of provided services and planning was 75.00 (72.17), 85.00 (81.27), 87.5 (81.03) and 60.00 (59.60), respectively. Overall satisfaction was 75.00 (74.63). This means that most enrollees were satisfied yet not very satisfied overall with provided services. In fact, 81.6% of all participants Table 2: Characteristics and descriptive statistics of the final sample
Variable No. of Responses % Variable No. of Responses %
Level of Education Informal Caregivers
None 49 24.4 Relatives 25 12.4
Elementary School 117 58.2 Children 115 57.2
High School - Lyceum 26 13.0 Neighbours 29 14.4
Higher Education 2 1.0 Friends 16 8.0
University 7 3.5 Others 16 8.0
Age Monthly Net Income (€)
65-69 39 19.4 < 300 31 15.4
70-74 52 25.9 301 - 500 94 46.8
75-79 54 26.9 501-700 56 27.9
80-85 39 19.4 701-900 13 6.5
86-90 17 8.5 > 900 7 3.5
Gender Family Status
Male 75 37.3 Single 20 10.0
Female 126 62.7 Widowed 109 54.2
Visit Frequency Divorced 21 10.4
1 per month 9 4.5 Married 51 25.4
1 per fifteen days 24 11.9 Enrolment Duration
1 per week 90 44.8 ≤ 1 year 47 23.4
2-3 per week 66 32.8 (1 year - 2 years] 80 39.8
4-5 per week 11 5.5 (2 years - 3 years] 45 22.4
were to some extent satisfied with the home care pro-grams, whilst 9% expressed some level of dissatisfaction. A point of concern, nevertheless, relates to the lower sat-isfaction with service planning documented.
Discussion
A preliminary validation of a new psychometric tool for measuring satisfaction with home care was conducted with a sample of 201 individuals enrolled in five home care programs operating in the City of Thessaloniki. The questionnaire had 31 items and was expressed on a Likert
scale. Although this scale has been typically considered in practice as interval it is in principle ordinal. We have therefore extended the usual research design to compara-tively include ordinal methods, such as polychoric corre-lations.
Results from this exploratory analysis suggested that four multi-item factors are associated with home care sat-isfaction: socioeconomic change (4 items), staff skills and attitudes (5 items), appropriateness of provided services (2 items), and planning of services (2 items). An addi-tional two-item scale was formed reflecting overall satis-Table 3: Factor analysis with polychoric correlations†
Item 1st 2nd 3rd 4th 5th
1 0.485 0.326 0.324 0.190 0.190
2 0.559 0.273 0.335 0.148 0.037
3 0.454 0.658 0.180 0.078 -0.061
4 0.656 0.201 0.142 0.375 0.072
5 0.371 0.688 0.058 0.223 0.046
6 0.417 -0.079 0.553 0.128 0.227
7 0.557 0.475 0.129 0.227 0.030
8 0.278 0.307 0.186 0.048 0.361
9 0.535 0.442 0.502 0.186 0.227
10 0677 0.248 0.305 0.257 0.218
11 0.180 0.078 -0.011 0.018 0.539
12 0.597 0.327 0.446 0.265 0.132
13 0.500 0.335 0.088 0.051 0.185
14 0.550 0.265 0.199 0.426 0.207
15 0.237 0.339 0.681 0.129 -0.036
16 0.518 0.276 -0.019 0.558 0.096
17 0.366 0.328 0.251 0.511 0.092
18 0.260 0.263 0.249 0.574 0.133
19 0.435 0.116 0.244 0.455 0.321
20 0.192 0.222 0.627 0.545 0.073
21 0.212 0.508 0.247 0.461 0.040
22 0.324 0.545 0.183 0.358 0.363
23 0.286 0.633 0.109 0.250 0.284
24 0.640 0.242 0.229 0.231 0.135
25 0.509 0.370 0.393 0.427 0.177
26 0.093 0.469 0.354 0.124 0.352
27 0.237 0.416 0.435 0.362 0.216
28 0.244 0.704 0.211 0.265 0.219
29 0.162 0.636 0.394 0.226 0.126
30 -0.026 0.079 0.138 0.152 0.738
31 0.226 0.432 0.530 0.175 0.324
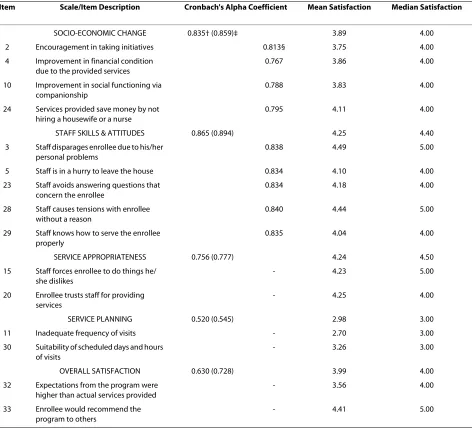
[image:8.595.57.542.111.574.2]faction with the programs. The first three multi-item scales had satisfactory internal consistency reliability, test-retest reliability and construct validity. An additional dimension suggested by factor analysis was "service plan-ning" which has been found to have lower internal consis-tency reliability. Future research should further investigate whether the specific summated scale can be improved or legitimately ignored without sacrificing con-tent validity.
There are differences as well as similarities between our scale dimensions and those found in other international studies. For instance, Reeder & Chen's confirmatory fac-tor analysis lumped together three previously
docu-mented scales -namely professional/technical, interpersonal/trust and educational- into one unique dimension [13]. Using the same instrument, Laferriere found four dimensions of client satisfaction with home nursing care: technical quality of care, communication, personal relationships between client and provider, and service delivery [11]. Bear et al. instead reported two fac-tors: service delivery and service sufficiency [20]. Netten
[image:9.595.68.540.113.541.2]et al. and Jones et al. mentioned carer quality - opinions towards carer, service quality and outcomes [27,60]. Finally, Geron et al. classified items into the categories homemaker/health aide, care management service, home-delivered meal service and grocery service [22]. Table 4: Internal consistency reliability and satisfaction scores
Item Scale/Item Description Cronbach's Alpha Coefficient Mean Satisfaction Median Satisfaction
SOCIO-ECONOMIC CHANGE 0.835† (0.859)‡ 3.89 4.00
2 Encouragement in taking initiatives 0.813§ 3.75 4.00
4 Improvement in financial condition due to the provided services
0.767 3.86 4.00
10 Improvement in social functioning via companionship
0.788 3.83 4.00
24 Services provided save money by not hiring a housewife or a nurse
0.795 4.11 4.00
STAFF SKILLS & ATTITUDES 0.865 (0.894) 4.25 4.40
3 Staff disparages enrollee due to his/her personal problems
0.838 4.49 5.00
5 Staff is in a hurry to leave the house 0.834 4.10 4.00
23 Staff avoids answering questions that concern the enrollee
0.834 4.18 4.00
28 Staff causes tensions with enrollee without a reason
0.840 4.44 5.00
29 Staff knows how to serve the enrollee properly
0.835 4.04 4.00
SERVICE APPROPRIATENESS 0.756 (0.777) 4.24 4.50
15 Staff forces enrollee to do things he/ she dislikes
- 4.23 5.00
20 Enrollee trusts staff for providing services
- 4.25 4.00
SERVICE PLANNING 0.520 (0.545) 2.98 3.00
11 Inadequate frequency of visits - 2.70 3.00
30 Suitability of scheduled days and hours of visits
- 3.26 3.00
OVERALL SATISFACTION 0.630 (0.728) 3.99 4.00
32 Expectations from the program were higher than actual services provided
- 3.56 4.00
33 Enrollee would recommend the program to others
- 4.41 5.00
† Summated scale's Cronbach coefficient. ‡ Ordinal standardised item Cronbach alpha.
Table 5: Multi-trait analysis with Pearson, Spearman, polychoric and polyserial correlations †
Scale/Item Item - Scale Correlations
Socio-Economic Change
Mean SD Socio-Economic
Change
Staff Skills & Attitudes
Service Appropriateness
Service Planning
Scaling Success§
2 3.75 0.980 0.614‡ 0.508 0.463 0.154 3
(0.522)‡ (0.423) (0.439) (0.081)
[0.609]‡ [0.494]¶ [0.506] [0.144]
4 3.86 1.096 0.718‡ 0.48 0.336 0.177 3
(0.693)‡ (0.435) (0.335) (0.139)
[0.762]‡ [0.483] [0.390] [0.194]
10 3.83 0.977 0.675‡ 0.565 0.493 0.277 3
(0.662)‡ (0.463) (0.472) (0.236)
[0.724]‡ [0.556] [0.547] [0.292]
24 4.11 1.096 0.659‡ 0.445 0.379 0.197 3
(0.573)‡ (0.487) (0.398) (0.131)
[0.683]‡ [0.476] [0.456] [0.199]
Staff Skills & Attitudes
3 4.49 0.901 0.487 0.678‡ 0.458 0.133 3
(0.416) (0.504)‡ (0.291) (0.065)
[0.544] [0.674]‡ [0.421] [0.114]
5 4.1 1.054 0.482 0.700‡ 0.404 0.202 3
(0.463) (0.609)‡ (0.321) (0.140)
[0.519] [0.688] ‡ [0.403] [0.195]
23 4.18 0.917 0.486 0.695‡ 0.415 0.325 3
(0.397) (0.615)‡ (0.287) (0.275)
[0.497] [0.709]‡ [0.386] [0.352]
28 4.44 0.893 0.496 0.671‡ 0.500 0.261 3
(0.424) (0.601)‡ (0.327) (0.147)
[0.539] [0.726]‡ [0.453] [0.257]
29 4.04 0.940 0.500 0.690‡ 0.536 0.195 3
(0.414) (0.570)‡ (0.498) (0.130)
[0.503] [0.687]‡ [0.579] [0.199]
Service Appropriateness
15 4.23 1.076 0.414 0.495 0.612‡ 0.060 3
(0.390) (0.354) (0.447)‡ (0.018)
[0.448] [0.472] [0.636]‡ [0.050]
20 4.25 0.944 0.501 0.519 0.612‡ 0.229 3
(0.434) (0.395) (0.447)‡ (0.132)
[0.522] [0.494] [0.636]‡ [0.227]
Service Planning
11 2.7 1.036 0.199 0.202 0.076 0.353‡ 3
(0.156) (0.122) (0.024) (0.280)‡
[0.219] [0.219] [0.052] [0.375]‡
30 3.26 0.930 0.204 0.256 0.185 0.353‡ 3
(0.102) (0.163) (0.112) (0.280)‡
[0.209] [0.275] [0.163] [0.375]‡
The reasons for the observed differences between the number and content of scales in the home care satisfac-tion literature have not been studied. In our research some dissimilarity with other findings was expected due to the differences in the Greek home care service provi-sion outlined previously.
There is some evidence to suggest that satisfaction rat-ings with home care are influenced by monthly income and duration of enrolment in the program. Individuals with fewer own financial resources were in most need of home care services and hence reported higher satisfac-tion, and vice versa. Further, the more years an enrollee had been participating in the home care program, the more he trusted staff to carry out tasks for him and pre-sumably did not allow aides to force him do things he dis-liked. Yet one should be cautious in uncritically adopting these associations and explanations since some correla-tion measures lacked statistical significance.
It is important to note that the results of this study were not influenced by the approach employed. That is, whether one assumed that the 5-point Likert scale was an interval scale or an ordinal one had in essence no signifi-cant effect in the study findings. Similar findings from ordinal and Pearsonian exploratory factor analyses have also been documented for the Big Five Questionnaire [39].
Finally, overall enrollees were satisfied with the home care programs. Higher levels of satisfaction were associ-ated with the skills and attitudes of the staff and the suit-ability of services. Whereas lower levels were associated with the social and economic aspects of provided help and service planning. There are no existing studies in the Greek setting with which to compare the current find-ings. Although home care services in other countries dif-fer, have been evaluated with other tools and refer to different populations, we simply note that findings such as ours are not uncommon. For instance, the mean
satis-faction in this study was 74.63, whereas in a US study a mean of 74.1 was reported [22].
This study has certain limitations related both to the measurement of satisfaction and the validation of the questionnaire. Since the provision of home care programs in Greece is decentralized and information on the charac-teristics of the population of enrollees is not gathered by the central government, we were unable to investigate whether our sample was representative. The sample was in fact geographically restricted to the city of Thessalon-iki. Moreover, there were no other studies in the Greek setting with which we could compare our findings. The summated scales "service planning" and "overall satisfac-tion" had low reliability values and "service appropriate-ness" a marginally acceptable Cronbach's alpha coefficient. The fact that these were all two-item scales might partly account for that. Nevertheless, we note that scales comprising of only two questions have often been found highly reliable in the Greek setting [4]. Finally, the measurement of satisfaction has been criticized for its weak conceptual foundation and potential biases due to acquiescent response set [61,62].
Conclusions
[image:11.595.56.545.113.248.2]Summing up, exploratory ordinal and traditional factor analyses alongside reliability and validity tests revealed three reliable and valid multi-item scales: socioeconomic change, staff skills and attitudes and appropriateness of services. A fourth dimension -service planning- had lower internal consistency reliability. Overall, enrollees were satisfied with the home care program. Future research should further validate the questionnaire with the use of confirmatory factor analysis and larger samples from other home care programs. Moreover, the role of service planning in the determination of home care satis-faction should be further assessed.
Table 6: Test-retest reliability coefficients
Summated Scale Intraclass
Coefficient†
95% CI of Intraclass Correlation
Polychoric Correlation
Kendall's Tau b Coefficient
Minimum Maximum
Socio-economic Change 0.958 0.919 0.978 0.942** 0.835**
Staff Skills & Attitudes 0.926 0.858 0.962 0.949** 0.830**
Service Appropriateness 0.815 0.669 0.901 0.894** 0.734**
Service Planning 0.946 0.898 0.972 0.982** 0.902**
Overall Satisfaction 0.891 0.799 0.943 0.936** 0.827**
Additional material
Competing interests
The authors declare that they have no competing interests.
Authors' contributions
VHA conceived and designed the study, helped to finalize the tool, carried out data analysis and interpretation, and drafted the manuscript. AK and MT
reviewed the literature, drafted the questionnaire and carried out the study administration. DN designed and supervised the study. AN contributed to all the statistical analyses. All authors read and approved the final manuscript.
Acknowledgements
No funding was provided for this research.
Author Details
1Department of Business Administration, University of Macedonia, 156 Egnatia
str., P.O. Box 1591, Thessaloniki 54006, Macedonia, Greece and 2Faculty of
Social Sciences, Hellenic Open University, Patra, Greece
[image:12.595.61.539.111.563.2]Additional file 1 Home Care Satisfaction Questionnaire. A question-naire in Greek that measures satisfaction with home care services.
Table 7: Correlations between scale scores and respondents' characteristics †
Scale/Characteristic Socio-Economic Change Staff Skills & Attitudes Service Appropriateness Service Planning
Overall Satisfaction Scale 0.689*** 0.653*** 0.402*** 0.336**
(0.570)*** (0.536)*** (0.337)*** (0.269)**
[0.472]*** [0.806]*** [0.434]*** [0.391]**
Socio-Economic Change - 0.542*** 0.491*** 0.158**
- (0.426)*** (0.388)*** (0.123)**
- [0.675]*** [0.480]*** [0.261]***
Staff Skills & Attitudes 0.542*** - 0.425*** 0.176**
(0.426)*** - (0.347)*** (0.139)**
[0.675]*** - [0.518]*** [0.296]***
Service Appropriateness 0.491*** 0.425*** - 0.058
(0.388)*** (0.347)*** - -0.049
[0.480]*** [0.518]*** - [0.115]**
Service Planning 0.158** 0.176** 0.058
-(0.123)** (0.139)** -0.049
-[0.261]*** [0.296]*** [0.115]**
-Age 0.005 -0.060 0.076 0.127
(0.004) (-0.048) (0.060) -0.103
[0.045] [-0.073] [0.054] [0.160]
Education -0.103 -0.024 -0.105 -0.130
(-0.078) (-0.019) (-0.090) (-0.110)
[-0.132] [-0.077] [-0.122] [-0.143]
Visit Frequency 0.026 0.076 -0.019 0.033
(0.019) (0.063) (-0.013) (0.026)
[0.060] [0.107] [0.006] [0.043]**
Income -0.215)*** -0.150** -0.157** -0.130
(-0.169)*** (-0.123)** (-0.126)** (-0.108)
[-0.203]* [-0.091]* [-0.127]* [-0.180]
Enrolment Duration 0.090 0.026 0.183*** 0.114
(0.068) (0.022) (0.142)** (0.087)
[0.074] [0.043] [0.177] [0.096]*
† Data outside parentheses are Spearman's correlations, whereas figures inside them represent Kendall's Tau b correlations. Polychoric or polyserial correlations are reported inside brackets.
References
1. Muenz R: Aging and demographic change in European Societies: main
trends and alternative policy options. In Social Protection Discussion Paper No. 0703 The World Bank; 2007.
2. World Health Organization: Home Care in Europe: The Solid Facts.
Bocconi University, Milan; 2008.
3. Merkouris A, Yfantopoulos J, Lanara V, Lemonidou C: Developing an
instrument to measure patient satisfaction with nursing care in Greece. J Nurs Manag 1999, 7:91-100.
4. Aletras VH, Papadopoulos EA, Niakas DA: Development and preliminary
validation of a Greek-language outpatient satisfaction questionnaire with principal components and multi-trait analyses. BMC Health Serv
Res 2006, 6:66.
5. Ministry of Economy & Finance and Ministry of Health & Welfare:
Implementation of a Pilot Home Care Program in the Municipality of Peristeri. 1996. Common Ministerial Decree No.4514/12-8-96, Athens;. [In Greek]
6. Ministry of the Interior Public Administration and Decentralisation
Ministry of Employment & Social Protection and Ministry of Health &
Welfare: Project Management System - Implementation Process for the
Action "Home Care and Day Care Centers for the Elderly", co-Financed by the European Social Fund in the Context of Regional Planning of the 3rd Community Support Framework. 2001. Common Ministerial Decree No.4035/30-8-01, Athens [In Greek]
7. Ministry of Employment & Social Protection: National Action Plan on
Social Inclusion. 2005. Athens; 2005. [In Greek]
8. Ministry of Health and Social Solidarity: Description of the "Home Care"
Action in the Context of Regional Planning of the 3rd Community Support Framework. Project Management Team for the initiation and management of programs related to the family child, elderly disabled and vulnerable groups; 2001. [In Greek]
9. Krowinski WJ, Steiber SR: Measuring and Managing Patient Satisfaction.
2nd edition. Chicago: American Hospital Publishing; 1996.
10. Wilson A, Hewitt G, Matthews R, Richards S, Shepperd S: Hospital at
home: assessing patients' and carers' views. In Report to the NHS Executive University of Leicester Department of Health Sciences; 2004.
11. Laferriere R: Client satisfaction with home health care nursing. J
Community Health Nurs 1993, 10:67-76.
12. Dansky KH, Brannon D, Wangsness S: Human resources management
practices and patient satisfaction in home health care. Home Health Care Serv Q 1994, 15:43-56.
13. Reeder PJ, Chen S-PC: Determining client satisfaction with home health
care. Home Health Care Manag Pract 1994, 6:8-16.
14. Edebalk PG, Samuelsson G, Ingvad B: How elderly people rank-order the
quality characteristics of home services. Ageing Soc 1995, 15:83-102.
15. Westra BL, Cullen L, Brody D, Jump P, Geanon L, Milad E: Development of
the Home Care Client Satisfaction Instrument. Public Health Nurs 1995,
12:393-399.
16. Forbes DA: Clarification of the constructs of satisfaction and
dissatisfaction with home care. Public Health Nurs 1996, 13:377-385.
17. Woodruff L, Applebaum R: Assuring the quality of in-home supportive
services: a consumer perspective. J Aging Stud 1996, 10:157-169.
18. Capitman J, Abrahams R, Ritter G: Measuring the adequacy of home care
for frail elders. Gerontologist 1997, 37:303-313.
19. Geron SM: Assessing the satisfaction of older adults with long-term
care services: measurement and design challenges for social work. Res Soc Work Pract 1998, 8:103-119.
20. Bear M, Sauer M, Norton A: Client satisfaction with service coordinators'
provision of home-based long-term care services. Home Health Care Serv Q 1999, 18:47-60.
21. Long CO: Patient satisfaction in home healthcare: what are the
essentials? Home Healthc Nurse Manag 1999, 3:9-13.
22. Geron SM, Smith K, Tennstedt S, Jette A, Chassler D, Kasten L: The home
care satisfaction measure: a client - centred approach to assessing the satisfaction of frail older adults with home care services. J Gerontol
2000, 55B:S259-S270.
23. Mylod DE, Kaldenberg DO: Data mining techniques for patient
satisfaction data in home care settings. Home Health Care Manag Pract
2000, 12:18-29.
24. Samuelsson G, Wister A: Client expectations and satisfaction of quality
in home care services: a consumer perspective. Home Care Provid 2000,
5:223-230.
25. Barrett VW, Gurland BJ: A method for advancing quality of life in home
care. Home Health Care Manag Pract 2001, 13:312-321.
26. Francis J, Netten A: Raising the quality of home care: a study of service
users' views. Soc Policy Adm 2004, 38:290-305.
27. Netten A, Francis J, Jones K, Bebbington A: Performance and quality: user
experiences of home care services. In Discussion Paper 2104/3 Personal Social Services Research Unit University of Kent. Canterbury; 2004.
28. Porter EJ: Sources of systematic error in instruments measuring
satisfaction with home care. Home Health Care Serv Q 2004, 23:19-39.
29. Woodward CA, Abelson J, Tedford S, Hutchison B: What is important to
continuity in home care? Perspectives of key stakeholders. Soc Sci Med
2004, 58:177-192.
30. Willis G: Cognitive Interviewing: A Tool for Improving Questionnaire
Design. Thousand Oaks: Sage Publications; 2004.
31. Fiebelkorn SL: Retail Service Encounter: Model and Measurement. In
The Service Encounter: Managing Employee/Customer Interaction in Service Businesses Edited by: Czepiel JA, Solomon MR, Surprenant CF. Lexington MA: Lexington Books; 1985:181-194.
32. Raftopoulos V, Theodosopoulou T: Scale validation methodology.
Archives of Hellenic Medicine 2002, 19:577-589. [In Greek]
33. Kline P: An Easy Guide to Factor Analysis. London: Routledge; 1994.
34. Pett MA, Lackey NR, Sullivan JJ: Making Sense of Factor Analysis: The Use
of Factor Analysis for Instrument Development in Health Care Research. Thousand Oaks: Sage Publications; 2003.
35. Costello AB, Osborne JW: Best practices in exploratory factor analysis:
four recommendations for getting the most from your analysis.
Practical Assessment, Research & Evaluation 2005, 10:1-9.
36. Birhanu Z, Assefa T, Woldie M, Morankar S: Determinants of satisfaction
with health care provider interactions at health centres in central Ethiopia: a cross sectional study. BMC Health Serv Res 2010, 10:78. 37. Labarere J, Francois P, Bertrand D, Peyrin JC, Robert C, Fourny M:
Outpatient satisfaction: validation of a French-language questionnaire: data quality and identification of associated factors. Clin Perform Qual Health Care 1999, 7:63-69.
38. Westaway M, Rheeder P, van Zyl D, Seager J: Interpersonal and
organizational dimensions of patient satisfaction: the moderating effects of health status. Int J Qual Health 2003, 15:337-344.
39. Holgado FP, Carrasco MA, del Barrio MV, Moscoso S: Factor analysis of the
Big Five Questionnaire using polychoric correlations in children. Qual Quant 2009, 43:75-85.
40. Roscino A, Pollice A: A generalization of the polychoric correlation
coefficient. In Data analysis classification and the forward search: proceedings of the meeting of the classification and data analysis group (CLADAG) of the Italian Statistical Society Edited by: Zani S, Cerioli A, Riani M, Vichi M. Berlin: Springer; 2005:135-142.
41. Jöreskog KG: New developments in LISREL: analysis of ordinal variables
using polychoric correlations and weighted least squares. Qual Quant
1990, 24:387-404.
42. Jöreskog KG, Sorbom D: PRELIS 2: User's reference guide. Chicago: SSI;
1996.
43. Fabrigar LR, Wegener DT, MacCallum RC, Strahan EJ: Evaluating the use
of exploratory factor analysis in psychological research. Psychol Methods 1999, 4:272-299.
44. Wouters E, Heunis C, van Rensburg D, Meulemans H: Patient satisfaction
with antiretroviral services at primary health-care facilities in the Free State South Africa - a two year study using four waves of cross-sectional data. BMC Health Serv Res 2008, 8:210.
45. Cronbach LJ: Coefficient alpha and the internal structure of tests.
Psychometrika 1951, 16:297-334.
46. Nunnally JC, Bernstein ICH: Psychometric Theory. 3rd edition. New York:
McGraw-Hill; 1994.
47. Zumbo BD, Gadermann AM, Zeisser C: Ordinal versions of coefficients
alpha and theta for Likert rating scales. J Mod Appl Stat Methods 2007,
6:21-29.
48. Norris AE, Aroian KJ: To transform or not transform skewed data for
psychometric analysis: that is the question! Nurs Res 2004, 53:67-71.
49. Ferketich S: Focus on psychometrics: aspects of item analysis. Res Nurs
Health 1991, 14:165-168.
Received: 21 January 2010 Accepted: 5 July 2010 Published: 5 July 2010
This article is available from: http://www.biomedcentral.com/1472-6963/10/189 © 2010 Aletras et al; licensee BioMed Central Ltd.
This is an Open Access article distributed under the terms of the Creative Commons Attribution License (http://creativecommons.org/licenses/by/2.0), which permits unrestricted use, distribution, and reproduction in any medium, provided the original work is properly cited.
50. McGraw KO, Wong SP: Forming inferences about some intraclass correlation coefficients. Psychol Methods 1996, 1:30-46.
51. Yen M, Lo LH: Examining test - retest reliability: an intraclass correlation
approach. Nursing Res 2002, 51:59-62.
52. Streiner DL, Norman GR: Health Measurement Scales: A Practical Guide
to their Development and Use. New York: Oxford University Press; 2003. 53. Nedjat S, Montazeri A, Holakouie K, Mohammad K, Majdzadeh R:
Psychometric properties of the Iranian interview-administered version of the World Health Organization's Quality of Life Questionnaire (WHOQOL-BREF): a population-based study. BMC Health Serv Res 2008,
8:61.
54. Ware JE, Gandek B: Methods for testing data quality scaling
assumptions and reliability the IQOLA project approach. J Clin Epidemiol 1998, 51:945-952.
55. Bjorner JB, Damsgaard MT, Watt T, Groenvold M: Tests of data quality
scaling assumptions and reliability of the Danish SF-36. J Clin Epidemiol
1998, 51:1001-1011.
56. Steiger JH: Tests for comparing elements of a correlation matrix.
Psychol Bull 1980, 87:245-251.
57. Jayasekara H, Rajapaksa L, Bredart A: Psychometric evaluation of the
European Organization for Research and Treatment of Cancer in-patient satisfaction with care questionnaire ("Sinhala" version) for use in a South-Asian setting. Int J Qual Health Care 2008, 20:221-226.
58. Labarere J, Francois P, Auquier P, Robert C, Fourny M: Development of a
French inpatient satisfaction questionnaire. Int J Qual Health Care 2001,
13:99-108.
59. Hendriks A, Vrielink M, Van Es S, De Haes H, Smets E: Assessing inpatients'
satisfaction with hospital care: should we prefer evaluation or satisfaction ratings? Patient Educ Couns 2004, 55:142-146.
60. Jones K, Netten A, Francis J, Bebbington A: Using older home care user
experiences in performance monitoring. Health Soc Care Community
2007, 15:322-332.
61. Scott A, Smith RD: Keeping the customer satisfied: issues in the
interpretation and use of patient satisfaction surveys. Int J Qual Health
Care 1994, 6:353-359.
62. Rapkin B, Weiss E, Chhabra R, Ryniker L, Patel S, Carness J, Adsuar R,
Kahalas W, Delemarter C, Feldman I, Delorenzo J, Tanner E: Beyond
satisfaction: using the dynamics of care assessment to better understand patients' experiences in care. Health Qual Life Outcomes
2008, 6:20.
Pre-publication history
The pre-publication history for this paper can be accessed here: http://www.biomedcentral.com/1472-6963/10/189/prepub
doi: 10.1186/1472-6963-10-189