City, University of London Institutional Repository
Citation: Gounopoulos, D., Molyneux, P., Staikouras, S., Wilson, J. O. S. & Zhao, G.
(2013). Exchange rate risk and the equity performance of financial intermediaries.International Review of Financial Analysis, 29, pp. 271-282. doi: 10.1016/j.irfa.2012.04.001
This is the accepted version of the paper.
This version of the publication may differ from the final published
version.
Permanent repository link: http://openaccess.city.ac.uk/15794/
Link to published version: http://dx.doi.org/10.1016/j.irfa.2012.04.001
Copyright and reuse: City Research Online aims to make research
outputs of City, University of London available to a wider audience.
Copyright and Moral Rights remain with the author(s) and/or copyright
holders. URLs from City Research Online may be freely distributed and
linked to.
1
Exchange Rate Risk and the Equity Performance
of Financial Intermediaries
Dimitris GOUNOPOULOS *
University of Surrey Business School, University of Surrey, Guildford GU2 7XH, U.K. email: [email protected]
Philip MOLYNEUX
Bangor Business School, Bangor University, Bangor LL57 2DG, U.K. email: [email protected]
Sotiris K. STAIKOURAS
Cass Business School, City University, London EC1Y 8TZ, U.K. ALBA Graduate Business School, Athens 16671, Greece
email: [email protected]
John O.S. WILSON
School of Management, University of St Andrews, St Andrews, Fife KY16 9RJ, U.K. email: [email protected]
Gang ZHAO
Westminster Business School, University of Westminster, London NW1 5LS, U.K. Email: [email protected]
Abstract
This study uses the VAR-BEKK methodology to examine the relationship between equity returns and currency exposure for a sample of U.S., U.K. and Japanese banks and insurance firms during 2003-2011. The findings indicate that banks’ equity returns are negatively related to changes in foreign currency value during the recent financial crisis (2008-2011). That is, the U.S. (Japanese) banking sector returns are negatively correlated to changes in the Japanese Yen (U.S. dollar). Equity returns of U.S./U.K. insurers are negatively linked to changes in the value of Japanese Yen, and this relationship is accentuated during the crisis. Home currency exposure is not significant for any insurer. When size is taken into account, only small U.S. banks are exposed to home currency changes, while only large Japanese banks are exposed to foreign currency changes. Overall, the negative relationship between the foreign currency value and bank/insurance equity returns supports the “flight to quality” hypothesis from the U.S./U.K. to Japan.
* We would like to thank Amir Alizadeh, Elena Kalotychou, Sunil Mohanty, Giorgio Questa, Natasa Todorovic, as well as the anonymous
2
1. Introduction
Prior to the collapse of the Bretton Woods system in 1971, foreign currency fluctuations along with their impact on equity markets received little attention. In the post-Bretton Woods era, currencies began to float freely against each other driven by demand and supply in global markets. Since then, the impact of currency fluctuations has received greater attention (Shapiro, 1975; Flood and Lessard, 1986; He and Ng, 1998). More recently, Bredin and Hyde (2011)
investigate the sources of foreign exchange exposure of industry level portfolios in the G7 and conclude that such exposure increases with the level of trade openness and competiveness. The currency effect on financial institutions’ performance has been examined by scholars focusing on U.S. banking (Grammatikos et al., 1986; Choi et al., 1992; Wetmore and Brick, 1994, 1998), Japanese banking (Chamberlain et al., 1997) as well as the insurance industry (Mange 2000; Elyasiani et al., 2007). Typically the extant literature focuses on large institutions, given that these are more likely to be international in focus and therefore potentially more exposed to currency risks. Yet, such firms may also engage in greater currency hedging activities given their access to exchange and over-the-counter currency derivatives – so this could mitigate such risks.
The contribution of the current study is threefold. First, we examine the currency sensitivity of financial institutions across major geographical regions (UK, Japan and U.S.) and types of institutions (banks and insurers).
Doukas et al. (1999) and Grant and Marshall (1997) among others, have focused on either different types of institutions within a country or the same type of institutions across countries, although (to our knowledge) no study to date does both1. Second, we use an alternative estimation framework, namely the VAR-BEKK model, aiming to
capture the time-varying conditional variance-covariance among asset returns, while increasing estimation efficiency (simultaneous estimation of return and variance-covariance). Finally, unlike previous studies focusing on home currency fluctuations, this paper looks at both home and foreign currency sensitivity of bank/insurance equity portfolio returns. With regard to the latter, we test for both home and foreign currency effects2. Changes in
currency values across markets mirror investors’ preferences towards different currencies. Financial assets are usually traded in home currency terms and thus the need to obtain that currency is apparent3. In addition, according
to the “flight to quality”hypothesis (Lang and Nakamura, 1995;Eichengreen et al., 2001; Vayanos, 2004) investors are likely to reallocate their investments from risky to safer ones4. Therefore, changes in currency values can mirror
investors’ preference across countries. However, investor’s preferences represented by home currency effects may be difficult to detect. Chow et al. (1997a) argue that due to effective hedging activity, the impact of home currency
1 See Doukas et al (1999) and Grant and Marshall (1997) using Japanese and U.K. institutions; Chamberlain et al. (1997) for banking firms in the U.S. and Japan;
Martin (2000) for major banks in Japan, Switzerland, the U.S. and the U.K.; and Elyasiani and Mansur (2003) using banks from Japan, Germany and the U.S.
2 Home (foreign) currency effect is defined as the relationship between the equity returns of a financial institution and its home (the foreign) currency value
fluctuations measured as the return of a trade weighted currency price index. The latter is a basket of currencies from 21 industrial countries constructed by the BoE.
3 This is based on the “asset approach” hypothesis first introduced by Branson (1983) and Frankel (1983). Empirically, the studies by Kanas (2000) and Froot and
Ramadorai (2005) support this argument. Froot and Ramadorai (2005) refer to the relationship between supply/demand of a currency and the currency value as the “flow-centric” view. The “flow” refers to the order flow for a currency from major currency traders. The empirical evidence show the order flow information is significantly related to currency value.
4 Oetzel et al. (2001) show that the stability of a country’s currency value is related to the country’s economic risk level, which is represented by four different
measures in their study: Institutional Investor Index, country risk rating from Euromoney, data from International Country Risk Guide (ICRG), and risk level from
3
variations on firm’s equity value is weak or even undetectable, especially in the short-run. Reichert and Shyu (2003)
also argue that the currency swaps generally reduce the currency risk for the U.S., European and Japanese banks. Thus, a model using only home currency fluctuations may fail to detect the existence of the “flight to quality” effect.
A multivariate VAR-BEKK model comprising a VAR system of conditional mean equations for sector portfolio returns and a conditional variance-covariance estimation framework with a BEKK parameterization is employed. The sample period is 2003-11 (1st quarter) and focuses on the U.S., U.K. and Japanese banking and insurance
industries. Equally weighted portfolios are constructed for the banking and insurance firms. The conditional mean equation of portfolio returns is specified as a function of market, interest rate, home and foreign currency-related risk factors. The latter includes both the changes and variability of currency values. A structural break is introduced into the VAR-BEKK model in order to investigate the effects of the recent financial crisis on the relationship between fluctuating currency values and the returns of banks and insurance firms.
The empirical analysis suggests that the impact of foreign currency on banking portfolios has changed after the recent financial turmoil. Changes in the value of the U.S. Dollar (Japanese Yen) have a negative influence on large Japanese (U.S.) bank returns providing support for the “flight to quality” hypothesis. Equity returns for U.K. and U.S. insurance firms are negatively related to changes in the Japanese Yen. This relationship is accentuated during the recent financial crisis. The returns of the insurance portfolios are unaffected by home currency exposure, but foreign currency exposure has a significant impact on U.K. and U.S. insurers.
The remainder of the paper is organized as follow. Section 2 provides a summary of the literature investigating the relationship between currency exposure and the returns of financial institutions. Section 3 describes the data and estimation framework used to test our research hypotheses. Section 4 presents the results of the empirical analysis and Section 5 concludes the paper.
2. Literature Review
This section presents a summary of recent studies into the relationship between currency fluctuations and equity values5. The literature is categorized according to whether it focuses on the currency exposure of financial
institutions, firm size effects or alternative modeling approaches.
2.1. Currency Exposure of Financial Institutions
One of the early studies by Grammatikos et al. (1986) shows that foreign currency denominated gaps on banks’ balance sheet are responsible for their FOREX exposure during 1976-81. Banks are highly exposed to individual foreign currencies but not at an aggregate level. They argue that the low aggregate currency exposure of U.S. banks is due to diversification effects given the low/negative correlations among foreign currencies6.
5 To keep the task manageable, this section presents a brief overview of some of the empirical findings with no intention to lessen the importance of any studies
excluded. A detailed survey is beyond the scope of the current study.
6 The study investigates the U.S. banks’ exposure to five different foreign currencies (Canadian dollar, German mark, French franc, GBP and JPY). The currency
4
Most of the subsequent literature tends to focus on the currency exposure of large banks7. Wetmore and Brick
(1994, 1998) investigate the currency exposures of the 79 largest U.S. banks during 1986-95. Both studies conclude that the main source of currency exposure results from un-hedged foreign loan activities. Chamberlain et al. (1997)
support this argument when evaluating the currency exposure of the largest U.S. (30) and Japanese (89) banks during 1986-93. Their findings indicate that currency exposure is negatively related to the volume of hedging activity, as measured by the nominal value of off-balance sheet items (interest rate and foreign exchange derivates). This argument is dismissed, however, by Choi and Elyasiani (1997) who provide empirical evidence based on the 59 largest U.S. banks over 1975-92. They show that hedging activity (gauged by the level of off-balance sheet activity) could increase systemic risk – especially when hedging is via currency derivatives. Martin (2000) examines the currency exposure of the world’s 30 largest banks from 1994 to 1996. He finds that over 40% of the banks were significantly exposed to changes in the value of their home currency. The currency exposure of the U.S. banking sector, however, was found to be insignificant during the sample period suggesting that U.S. banks were more risk averse or their hedging was more effective.
In contrast to the attention paid to banks, few studies have examined the currency exposure of insurance companies. Mange (2000) was the first to demonstrate, theoretically, how fluctuations in the value of the home currency influences the equity value of insurance firms. He shows that both life and non-life insurance companies may be exposed to currency risk through issuing insurance products in foreign markets. This is true when they are issuing long-term products. Elyasiani et al. (2007) provide the first empirical study into the currency exposure of U.S. insurance firms using data spanning 1991 to 2001. They find a significant and positive relationship between changes in the trade weighted USD price index and the returns of U.S. insurers.
2.2. Firm Size and Currency Exposure
Given that large companies are more likely to engage in global activity, then that makes them prone to a greater currency risk exposure (Jorion, 1990). Greater currency exposure for large firms, however, may be mitigated if there are significant economies of scale in currency hedging activity. Nance et al. (1993) argue that hedging vehicles are more likely to be deployed by companies that benefit from economies of scale due to the associated transaction costs. Based on 169 firms from Fortune 500 (in 1986), they find that firms making greater use of hedging instruments are usually large, a finding later confirmed by both Mian (1996) and Crabb (2002).
Size effects of financial institutions have not been extensively explored in the literature. Tai (2000) evaluates the potential size effect among commercial banks in the U.S. market during 1987-98. His sample (31 banks) reveals that currency exposure is only significant for large banks – reinforcing Chamberlain et al.’s (1997) findings. This view is questioned, by Choi and Jiang (2009) who claim that the currency exposure of internationally oriented firms,
currency exposure refers to the changes of the USD against another currency (all five currencies). The largest/lowest correlation is between the Canadian dollar/GBP and the German mark (30% / -29%).
7Chamberlain et al. (1997) suggest that research should focus on large banks for three reasons: 1) large banks are more likely to be involved in international
5
operating in the U.S. during 1983-2006, is less than that of purely domestic-focused companies (suggesting multinationals benefit from operational hedging). Using multinational corporations (MNCs) and non-MNCs, they find that the non-MNCs currency exposure is significantly higher than that of MNCs and argue that the latter are more likely to hedge foreign exposures compared to non-MNCs – a result consistent with the findings of Crabb (2002).
2.3. Modeling Firm Currency Exposure
Early studies use linear modeling approaches and employ price levels (rather than changes) as exogenous risk factors (Adler and Dumas, 1984). Linear estimations, however, can be biased as they do not take the non-stationarity of exogenous variables into account. As a result some studies employ changes in values (Adler et al., 1986). Jorion
(1990) argues further that a market risk factor should also be included in such models. Prasad and Rajan (1995)
suggest that changes in interest rates should also be included given the evidence of a strong link between interest rate fluctuations and firm value. Staikouras (2003, 2006) provides a survey on the interest rate risk exposure of financial intermediaries. Elsewhere, others suggest that firm’s value only reacts to unexpected changes in currency value (Chow et al., 1997a, 1997b). Tai (2000) and Koutmos and Martin (2003), for instance, propose the use of estimated residuals from an autoregressive model to represent the unexpected changes in currency value. Unlike previous studies, Kolari et al. (2008) and Choi and Jiang (2009)adopt an alternative specification by adding the home currency changes to the Fama and French(1993) model to evaluate currency exposure.
3. Data and Methodology
3.1. Data
The sample period starts on January 1, 2003 and finishes on March 31, 2011 providing 1,924 daily observations after accounting for non-trading days. The focus is on the U.S., U.K. and Japanese banking/insurance industries. Equally weighted portfolios are constructed for the banking and insurance firms. These firms are later split to form size portfolios when enough companies are available (e.g. Japanese and U.S. banks). Given our annual rebalancing, institutions in the top quartile comprise the large firms while the remaining institutions are categorized as small. Furthermore, for each country the market index and long-term government bond yields are collected, while trade weighted currency price indices for the Japanese Yen (JPY), British Pound (GBP) and the US Dollar (USD) are obtained from the Bank of England (BoE). These variables form the set of exogenous risk factors. All data information is provided by Thompson Reuters. Table 1 provides some descriptive statistics for our sample.
TABLE 1
6
when the sub-prime industry in the U.S. market began to collapse with more than 25 sub-prime lenders declaring bankruptcy during February and March. The peak of the crisis is generally viewed as the September 15, 2008 when Lehman Brothers filed for bankruptcy. Therefore, we calculate the pre/post-crisis average daily return for bank/insurance portfolios based on two dates: a) January 1, 2007 and b) September 15, 20088. While insurers were
also affected by the credit crisis, the impact was smaller compared to that of banks. From Table 1, one can see that the mean returns for all sector portfolios are positive before January 1, 2007. After then the average daily returns are -0.100%/-0.097%/-0.083% for Japanese/U.K./U.S. banks and -0.103%/-0.032%/-0.072% for Japanese/U.K./U.S. insurers. One can also see that portfolio returns of all banks and insurers became noticeably worse after the Lehman Brothers bankruptcy on September 15, 2008. Of course, the differential impact of the recent financial crisis on banks and insurers owes much to the varying features of these institutions as well as to their exposure to credit and liquidity risks9.
3.2. Methodology
A multivariate VAR-BEKK model is employed for the current study. The VAR-BEKK model has two components: a) a VAR system of conditional mean equations for sector portfolio returns, and b) a conditional variance-covariance estimation framework with a diagonal BEKK parameterization.
The conditional mean equation of portfolio returns is specified as a function of market, interest rate, home and foreign currency-related risk factors. Currency-related risk factors, including both the changes and variability of currency values, are employed to explain variations in financial institution portfolio returns (Tai,2000; Koutmos and Martin, 2003). The conditional variance-covariance of portfolio returns is estimated using a BEKK framework. Kroner and Ng (1998), Cappiello et al. (2006) indicate that conditional correlation among financial asset returns is not constant over time. Unlike the constant correlation assumption used in Elyasiani et al. (2007), there is no restriction on the conditional correlations among equity returns employed in our BEKK approach. Therefore, the chosen model is more flexible and provides superior estimation accuracy10. In order to improve estimation efficiency, the model is
estimated simultaneously for both the conditional mean and variance-covariance equations. The estimation approach is based on the Bollerslev and Wooldridge (1992) framework, which optimizes the parameter estimation by maximizing the sum of the quasi-conditional log-likelihood ratios.
Another point worth noting is that the foreign exchange market is occasionally subject to significant shocks. A vivid example is the 2007 financial crisis when currency volatility increased noticeably (Melvin and Taylor, 2009). In order to investigate the potential influence of the crisis on the relationship between fluctuating currency values and
8 Note that for our estimations the September 15, 2008 is employed as the cut-off point. The second date (January 1, 2007) is only used in the descriptive
statistics to show how much returns have changed before and during the crisis. In that way we ascertain that the daily negative performance of financial institutions, during the whole sample period, is directly related to their poor performance over the crisis period.
9 For discussion on credit and liquidity risks for banks and insurers please refer to the report by The Geneva Association under the title of Systemic Risk in Insurance, An analysis of insurance and financial stability, see: www.genevaassociation.org. See also Harrington (2009) and Eling and Schmeiser (2010) regarding the performance for these two intermediaries.
7
the bank/insurance equity returns, a structural break is introduced into the VAR-BEKK model. Failure to capture the time series structural break could generate biased coefficients (Levi, 1994). It is known by now that the currency exposure of financial institutions is time-varying, especially when systemically important events occur. For instance,
Choi et al. (1992) show that the currency exposure of U.S. banks changed noticeably after the establishment of the
1979 International Banking Act. The current study introduces slope-dummy variables into the model to capture potential changes in currency exposure during the financial crisis11. According to Melvin and Taylor (2009), the
bankruptcy announcement made by Lehman Brothers on September 15, 2008 had a significant impact on the foreign exchange market and as such this date is used as the cut-off point12. Figures 1-2 illustrate the noticeable changes, for
both the level of the three currency price indices (Figure 1) and their conditional volatilities (Figure 2) during the entire sample period.
FIGURES 1-2
In addition to the above, the effect of trading hours under different time zones13 should not be ignored. It is
reasonable to assume that information generated from the Japanese and U.K. markets is likely to influence the performance of the U.S. market on the same trading day. For the U.S. market, however, its daily price information can only affect the performance of the Japanese and U.K. markets on the following trading day. Similarly, for the U.K. it is assumed that its daily price movement can only affect the Japanese market on the following day. On this basis, lag values are employed to capture any spillover effects due to non-synchronous trading among geographic regions.
Given all the aforementioned information, the proposed VAR-BEKK model can be now illustrated, in matrix format, as follows.
Conditional mean equation:
𝑅!=𝛽∙𝑀𝐹!!+𝐺∙𝐹𝑋!!+𝑍∙𝐹𝑋𝑉!!+Γ∙𝐷∙𝐹𝑋!!+Θ∙𝐷∙𝐹𝑋𝑉!!+𝜀! (1)
Conditional variance-covariance equation:
𝐻! =𝐶!"#∙𝐶!"#!+𝐴!"#𝜀!!!𝜀!!!!𝐴!"#!+𝐵!"#𝐻!!!𝐵!"#!, with 𝑡∈ 0, (2)
𝐻! =𝐶!"#$∙𝐶!"#$!+𝐴!"#$𝜀!!!𝜀!!!!𝐴!"#$!+𝐵!"#$𝐻!!!𝐵!"#$! with 𝑡 ∈ +1,𝑇
superscript T is the transpose operator
τ is the cut-off date (September 15, 2008) capturing the onset of the crisis period
11 The dummy variable is only introduced into the conditional mean equation and not to the conditional covariance equation. The conditional
covariance equation of the proposed model is based on a BEKK parameterization, which contains a component representing the unconditional variance-covariance matrix of the financial sector portfolio returns. However, the unconditional variance-variance-covariance matrix may not change in a linear way before and after the structural break. Therefore, the introduction of a dummy variable may not be suitable for representing a structural break in the BEKK model. In order to resolve the issue, the estimation for conditional variance-covariance equations is separated into two sub-periods, namely the pre- and post-crisis periods. Interactive (slope) dummies have also been introduced for the market and interest rate risk factor, but such specification did not alter the results of the currency exposure which is the main objective of the current study. It is also worth noting that by introducing interactive dummies for the other risk factors we increase the number of estimated parameters and reduce the estimation efficiency for the currency-related risk factors.
12 The relative value of both GBP and USD fell markedly immediately following the collapse of Lehman Brothers, whereas the JPY appreciated dramatically.
Furthermore, the conditional variances of all three currency price indices increased significantly.
13 The Tokyo Stock Exchange opens at GMT 0:00 and closes at GMT 6:00. It is then followed by the U.K. which opens at GMT 8:00 and closes at 16:30. The New
8
Rt = a [n x 1] matrix representing the bank/insurance portfolio returns (ri,t) over day t, with i corresponding to the country where the sector portfolio belongs to and n referring to the number of portfolios employed.
β = a [n x 3] matrix with the first column representing the constants, while the second and third columns
representing market (βi,Market) and interest rate (βi,IR) betas for the corresponding portfolios.
MFt = a [n x 3] matrix with the first column representing the constants. The second and third columns contain the market (rmi,t) and interest rate (iri, t) risk factors over day t for country i. The market risk factor is represented by the local market index; the interest rate risk factor is represented by the unexpected changes (estimated residual from a fitted ARMA model) in the holding period return of a long-term government bond.
FXt = a [3 x 1] matrix containing the unexpected changes in the trade weighted currency indices (JPY, GBP, USD) over day t. The unexpected change is the estimated residual from a fitted ARMA-GARCH model14.
FXVt = a [3 x 1] matrix containingthe conditional variances for the trade weighted currency indices (JPY, GBP, USD) over day t. The conditional variance is generated from the same fitted ARMA-GARCH model as FXt.
G = a [n x 3] parameter matrix representing the equity return sensitivity given changes in home/foreign currency value (FX) over the whole sample period. The elements of G are gi,j signifying the impact of currency value changes from country j on the portfolio return of country i. The return sensitivity on home currency changes are represented by gi (i=j).
Z = a [n x 3] parameter matrix representing the equity return sensitivity given changes in home/foreign currency variability (FXV) over the whole sample period. The elements of Z are zi,j signifying the impact of currency variability from country j on the portfolio return of country i. The return sensitivity on home currency variability are represented by zi (i=j).
Γ = a [n x 3] parameter matrix representing the potential changes in equity return sensitivity given changes in home/foreign currency value (FX) over the crisis period. The elements of Γ are γi,j
signifying the impact of currency value changes from country j on the portfolio return of country i. Changes in return sensitivity on home currency changes are represented by γi (i=j).
Θ = a [n x 3] parameter matrix representing potential changes in equity return sensitivity given changes in home/foreign currency variability (FXV) over the crisis period. The elements of Θ are θi,j signifying
14 The unexpected changes and variances of the currency price index are obtained from a fitted ARMA-GARCH model : CPIi,t = cons + ∑ pi=1 αi CPIi,t-1 + ∑ qi=1 βi CPIi,t-1 + ui,t u~(0,ht), hi,t = c + a hi,t-1 + b u2i,t-1
The CPIi,t is the trade weighted currency price index for currency i (e.g. JPY for i = Japan) on day t; cons is the constant for the mean equation, ui,t is the estimated
residual for currency i on day t, which represents the CPI’s unexpected changes (FXt) on day t; hi,t is the CPI’s conditional variance (FXVt) on day t. In the current
9
the impact of currency variability from country j on the portfolio return of country i. Changes in return sensitivity on home currency variability are represented by θi (i=j).
D = a dummy variable representing the crisis period i.e. D = 0 (1) before (after) September 15, 2008. Ht = a [n x n] matrix representing the conditional variance-covariance matrix among the bank/insurance
portfolio returns over day t.
εt = a [n x 1] matrix representing the error term vector from the conditional mean equations over day t.
Cpre/post= a [n x n] upper triangle matrix representing the unconditional part of the variance-covariance matrix over the pre-/post-crisis period.
Apre/post = a [n x n] diagonal parameter matrix representing the ARCH effect of the conditional variance-covariance matrix over the pre-/post-crisis period.
Bpre/post = a [n x n] diagonal parameter matrix representing the GARCH effect of the conditional variance-covariance matrix over the pre-/post-crisis period.
3.3. Joint-Hypotheses
Four hypotheses are constructed to investigate the joint-significance of parameters for risk factors representing home/foreign currency changes (FX) and variability (FXV). In order to perform these joint-hypotheses tests, a set of VAR-BEKK models are estimated with alternative conditional mean specifications by restricting the relevant parameters equal to zero. For clearer illustration, the unrestricted conditional mean equation (1) is presented in a scalar form as follows:
𝑟!,!=𝑐!+ !,!"#$%&𝑟𝑚!,!+ !,!"𝑖𝑟!,!+ 𝑔!,!𝐹𝑋!,!+ 𝑧!,!𝐹𝑋𝑉!,!+ !,!, 𝐷 𝐹𝑋!,! + !,! 𝐷 𝐹𝑋𝑉!,! +𝜀!,! (1a)
with i and j∈ [Japan, U.K., U.S.].
The variables and parameters used in the above equation are the elements from the variable and parameter matrices presented in Equation (1). The four joint-hypotheses are presented below:
H1: No home and/or foreign currency variability (FXV) effect Restrictions zi,j = θi,j = 0
H2: No foreign currency changes (FX) and/or foreign currency variability (FXV) effects Restrictions gi,j =γi,j = zi,j = θi,j = 0 (i≠j)
H3: No change in home currency (FX) and/or home currency variability (FXV) effect during the crisis Unrestricted model gi,j =γi,j = zi,j = θi,j = 0 (i≠j)
Restricted model gi,j =γi,j = zi,j = θi,j = 0 (i≠j) plus γi = θi = 0
H4: No change in home and/or foreign currency (FX) and/or home and/or foreign currency variability (FXV) effects during the crisis
10
4. Estimation Results
The following section presents the results from the VAR-BEKK model. First, the results of the four joint-hypotheses are discussed. Second, we examine the impact of currency fluctuation on bank/insurer portfolio returns. Finally, we investigate potential size effects using large and small U.S./Japanese bank portfolios.
4.1. Joint-Hypotheses Tests
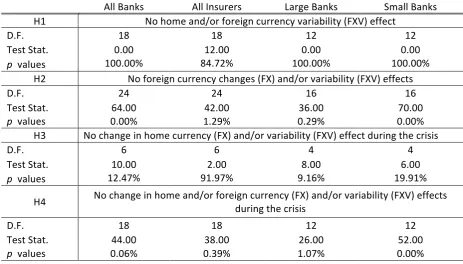
Table 2 summarizes the results of the four joint-hypotheses tests. As discussed in Section 3, the first two (H1-H2) investigate the effect of home and/or foreign currency fluctuations (FX/FXV) on banking/insurance portfolio returns over the entire sample period. The remaining hypotheses (H3 - H4) examine any change in these effects during the recent financial crisis.
TABLE 2
In general, the analysis provides us with three main findings. First, financial institutions’ stock returns are not affected by home/foreign currency variability (FXV). Second, financial institutions’ stock returns are affected by foreign currency (FX) movements. Third, financial institutions’ equity sensitivity to foreign exchange (FX) movements has changed significantly during the crisis period. The first finding (i.e. the returns of bank/insurance portfolios are not sensitive to home/foreign currency variability -FXV- over the sample period) comes from testing the H1 hypothesis, which examines the return sensitivity due to home/foreign currency variability (FXV) over the whole sample period. From Table 2, it is clear that the null hypothesis cannot be rejected by all sector portfolios. This is in contrast to Koutmos and Martin (2003) who find evidence of a strong and positive link between home currency variability and the performance of U.S. financial institutions during 1992-98. They argue that the positive relationship is because greater variation in currency values induces more hedging, which increases the profit of underwriters (e.g. banks) who issues these hedging instruments (e.g. FOREX derivatives). We argue that the conflict in the results is mainly due to the different sample period employed. We believe that during our sample period the main concern for investors is credit risk rather than currency exposure. This becomes more evident during the recent crisis. Therefore, the trading volume of FOREX derivatives should only represent a small proportion of the overall derivatives market compared to credit-related instruments. Even though higher variation of currency values will increase the sales of FOREX derivatives, its apparent impact on the profitability of financial institutions appears to be limited. Our argument is supported by the report from the World Federation of Exchanges (WFE)15. During the
8-year period from 1998 to 2006, the trading volume of the currency derivatives is almost unchanged. The trading volume of credit-related instruments, however, has increased dramatically during the same period. As a result, the proportion of currency derivatives dropped from around 25% of the total derivatives trading volume in 1998 to 8% at the end of 2008.
11
The second finding (i.e. changes in foreign currency value -FX- affect the bank/insurance portfolios returns over the sample period) is generated by combining the test results of H1 and H2 hypotheses. The latter investigates whether foreign currency changes (FX) and variability (FXV) can affect portfolio returns. Given that the null hypothesis of H2 is rejected by all sector portfolios, it is interesting to see whether foreign currency changes (FX) or variability (FXV) influence the return performance of bank/insurance portfolios. We already know (from H1 test results) that foreign currency variability (FXV) has no influential power over the bank/insurance returns. Thus, we observe that bank/insurance portfolios are only sensitive to changes in foreign currency value (FX).
The third finding (i.e. the return sensitivity of these sector portfolios, given changes in foreign exchange -FX-, has altered during the crisis period) is derived from the test results of H3 and H4 hypotheses. The former investigates the potential change in portfolio returns upon home currency fluctuations (FX/FXV) during the crisis period; while the latter examines the potential change in portfolio returns upon both home and foreign currency fluctuations (FX/FXV). The test results indicate that all bank/insurance portfolios reject the null hypothesis of H4 but not H316.
That means the return sensitivity due to foreign currency fluctuations (FX/FXV) has changed during the crisis period. From H1, we already know that home and foreign currency variability (FXV) do not have a significant impact on bank/insurance portfolio returns during the entire sample period. Therefore, only the impact of foreign currency changes (FX) has intensified during the crisis period17.
4.2. Currency Value Fluctuations and Bank/Insurance Portfolio Returns
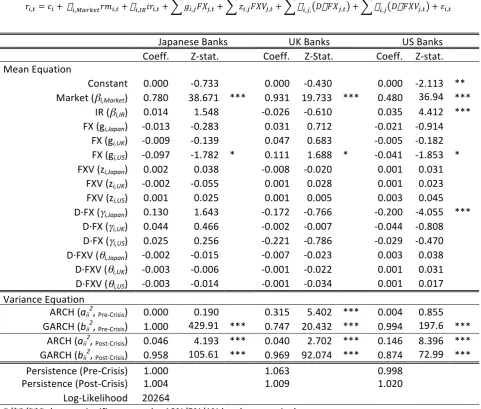
The estimation results of the VAR-BEKK model for the bank/insurance portfolios across the three markets are presented in Tables 3 to 6. Table 3 summarizes the estimated parameters for the banking portfolios, while Table 4 summarizes those for the insurance portfolios. Table 5 and 6 present the estimation results for large and small banking portfolios for the U.S. and Japanese markets.
TABLE 3
The results show that the relationship between changes in home currency value (FX) and returns of the Japanese and U.K. banking portfolios are insignificant over the entire estimation period. Lack of significance for the home currency exposure could be due to hedging practices (Levi, 1994; Bartov et al., 1996; Chow et al., 1997a), while it is empirically established that derivatives usage can be an effective way to hedge currency exposure (Cummins et al., 1996; Grant and Marshall, 1997). We noted earlier that credit derivatives have become relatively more important (globally) compared to currency derivatives although the latter are relatively more important for the U.K. banks. Data from the BoE suggests that foreign currency derivatives were popular hedging instruments among the
16 The only exception comes from the large banking sector portfolio, which we discuss later in detail – see discussion for Tables 5 and 6.
17 We also test two additional joint-hypotheses a) no change in home currency (FX) effect and b) no change in home and/or foreign currency (FX) effects during
12
U.K. banks since the turn of the millennium and especially during the crisis18. On average, the outstanding volume of
foreign currency-related derivatives accounted for approximately 25% of the total volume of financial derivatives used by the U.K. banking industry19. We suggest that the lack of home currency exposure for the U.K. banks is mainly
due to their effective hedging activities. Contrary to these results, the home currency exposure of the U.S. banking portfolio is significantly negative over the whole sample period. The estimated coefficient for home currency changes (FX) is -4.1% and statistically significant. It is possible that the significant currency exposure of the U.S. banking sector is derived from activities of relatively small banks because they have less incentive to hedge their currency exposures due to economies of scale required for hedging purposes20. The coefficient of the foreign
currency changes (FX) is significant for the banking portfolios across all three markets. Looking at the JPY (USD) effect on the U.S. (Japanese) banks, it is clear that the currency value is negatively correlated with bank returns during the crisis period. For the Japanese banks, the estimated impact of the USD is -9.7% during the entire sample period, while for the U.S. banks the impact of the JPY reduces by 20.0% points over the crisis period21.
According to the “flight to quality” hypothesis, changes in currency values can be treated as an alternative measure of investors’ preferences. The value of a country’s currency is related to the investors’ willingness to hold financial assets in this country (Branson, 1983; Frankel, 1983). As investors shift their investments from one country to another, the value of these countries’ currencies should change accordingly. Melvin and Taylor (2009) support this hypothesis by showing that the value of the JPY steadily increased during the global financial crisis because Japan did not suffer the same adverse effects as Europe and the U.S. Interestingly, the value of the GBP and the USD fell following the onset of the crisis. Under the “flight to quality” hypothesis, the GBP and the USD depreciated because the level of economic risk in the U.K./U.S. markets increased significantly during the crisis and investors shifted their investments away from these two markets and into Japan. In such an environment, the returns generated by the U.K./U.S. financial sectors should have an inverse relationship with the value of JPY. As one can see from Table 3, the relationship between changes in JPY (USD) and returns on the U.S. (Japanese) banking portfolio is indeed negative supporting the “flight to quality” hypothesis. Contrary to our findings, Swanson (2003) shows that exchange rates play a minor role in equity markets with some of the results exhibiting mixed patterns22.The U.K.
banking portfolio is positively related to changes in the USD with a significant coefficient for the USD effect (11.1%)
18 The derivative position for the U.K. banks is collected from the Financial Derivative Positions of Banks at Market Value issued by the BoE, see:
http://www.bankofengland.co.uk/statistics/bankstats/current/tabf1.1.xls.
19 In the case of U.K. banks, the most frequently used financial derivatives are interest rate-related derivatives, which account for more than 50% of total
derivative usage in terms of market value. The commodity- and credit-related derivatives only account for approximately 13% and 7%, respectively, of the total derivative volume used by the U.K. banking industry. Please note that we do not have first hand information regarding the exact usage of foreign currency derivatives or their effectiveness in terms of offsetting home and/or foreign currency value fluctuations (banks do not disclose that). We argue, however, that the large volume of foreign currency derivatives provides a possible/reasonable explanation for our empirical findings.
20 For the home currency effect on large and small U.S. banks see discussion for Tables 5 and 6.
21 It is worth noting that the estimated coefficients during the crisis period only reflect change in returns’ sensitivity to a particular risk factor. The coefficients
during the crisis period are percentage points rather than percentages. In order to obtain the full magnitude of any factor’s impact during the crisis period, one needs to sum up the estimated coefficient over the entire period (gij/zij) and the estimated coefficient during the crisis period (γij/θij). In the case of Japanese
banks, the coefficient for the USD effect remains the same and significant during the crisis period since the change in the coefficient (0.025) during the crisis is insignificant. In the case of the U.S. banks, the estimated coefficient for the JPY effect is insignificant over the entire sample period, but the change in the coefficient (-0.200) during the crisis is significant.
22 Swanson (2003) finds that changes in the value of Deutschemark (against USD) have a negative relationship with the German equity market, while changes in
13
over the entire sample period. This finding further reinforces the “flight to quality” among financial institutions. The U.K. and the U.S. markets are highly connected over the sample period23 and Chiang and Zheng (2010) show that the
two countries are linked through herding behavior. Ceteris paribus, the value of the USD will decrease when investors withdraw from the U.S., which in turn will negatively affect the U.K. market. Therefore, the USD should be positively correlated with the performance of the U.K. market, and therefore with the banking sectors in both countries. Finally, it’s worth noting that our analysis does not show any statistically significant relationship between the Japanese banks and their home currency fluctuations during the crisis period24. This is interesting as the
Japanese banking sector was heavily exposed to non-performing loans during 2008-09 and as such one would expect that a home currency appreciation will reduce the impact of foreign loan losses in home currency terms.
Now our focus turns to the insurance sector. Table 4 contains the estimated coefficients for the insurance portfolios. The results indicate that home and foreign currency variability (FXV) effects are insignificant over the sample period. This could be attributed to the fact that insurers are not highly involved in currency derivatives.
TABLE 4
Only for U.K. insurers the estimated coefficient for home currency (FX) effects (7.8%) is significant over the whole estimation period. It could be that U.K. insurers issue insurance products in overseas markets causing this effect (Mange, 2000). According to the information provided by the Association of British Insurers (ABI), around 20% of the net premium income of U.K. insurance sector derives from overseas and more than 70% of this is from sales of long-term products25.
Based on the estimation results for foreign currency (FX) effects, one can see that the returns of the U.K. insurance portfolio are negatively linked to changes in JPY and, for the U.S., during the crisis. The estimated coefficient of the JPY effect on U.K. insurance portfolio is -7.0% over the entire estimation period, while the JPY effect on the U.S. insurance portfolio is -17.7% during the crisis. For the Japanese market, changes in the USD have a negative and significant impact on the insurance portfolio returns the estimated coefficient of the USD effect is -23.2% over the whole estimation period. Overall, the results indicate the existence of competitive effects between Japan and the U.K./U.S. in the sense of attracting investor’s funds. This is another shred of evidence supporting the “flight to quality” hypothesis.
In addition, the GBP effect on U.S. insurers is 8.1% over the sample period. However, this relationship has changed noticeably during the course of the crisis. The estimated coefficient for the GBP effect has fallen by 12.9% points, namely a decline from 8.1% to -4.8% (i.e. 8.1%-12.9%). One possible explanation for this could be that investors no longer treat the equities of insurance companies in these two markets as assets with similar characteristics. Therefore, currency changes in one market may (in this case at least) no longer serve as an indicator
23 The unconditional correlation between the U.K. and U.S. wide market index returns is 53.4% over the entire sample period. Information related to the
unconditional correlations among the risk factors is available upon request.
24 The Z-statistic for the Japanese home currency fluctuations during the crisis period (
γi Japan) is 1.643. See more discussion in the next section when banks are
separated according to size (Tables 5 and 6).
14
of investors’ preferences in another. By conducting additional tests for life and non-life insurance portfolios separately, we find that changes in GBP affect only the U.S. non-life insurers26. We believe this change is attributed
to the different asset compositions of the U.S. and U.K. non-life insurers. Data provided by Swiss Re indicates that during the financial crisis the asset compositions of the U.K. and U.S. non-life insurance sectors were distinctly different27. The U.K. non-life insurers invested more than 15% of their assets in real estate loans, while non-life
insurers in the U.S. had no property-related assets in 2008. Finally, the relationship between the JPY and the U.K. insurers has changed significantly during the crisis. That is, the JPY coefficient has increased by 9.9% points during the recent turmoil, pointing towards a relatively good performance of the U.K. insurance market compared to the Japanese/U.S. insurers.
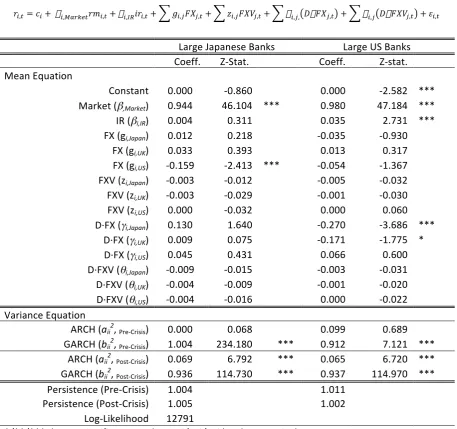
4.3. Size Effects and Currency Risks
The positive relationship between fluctuations in the currency value and firm size may be due to incentives to hedge (Mian, 1996) or the risk characteristics associated with size of an institution (He and Ng, 1998). This section investigates the currency exposure of large and small banking portfolios in the U.S. and Japan. The results are presented in Tables 5 and 6.
TABLES 5 - 6
Looking at large and small U.S. banks, it is apparent that small banks are exposed to home currency value changes (FX) over the entire sample period, while large banks are not. Economies of scale required for hedging activities could be the reason behind this size effect. Large companies are more likely to engage in hedging activities because the economic incentive for hedging is greater (Mian, 1996). During the financial crisis, however, both large and small U.S. banks are negatively affected (-27.0% and -19.5%, respectively) by changes in the JPY; while only large U.S. banks are negatively affected (-17.1%) by changes in the GBP. Consistent with the finding from the H1 joint-hypothesis test, currency volatility (FXV) in either home or foreign currency does not seem to be a risk factor throughout the sample period.
On the other hand, changes in the USD have a significant negative impact (-15.9%) only on large Japanese banks over the entire sample period, while such sensitivity does not change during the crisis28. This differing response
(large vs small) cannot be attributed to asymmetry effects i.e. banks respond differently in periods of depreciation than in periods of appreciation29. Furthermore, it could be argued that, during the crisis, Japanese banks benefited
from the USD depreciation (given the -0.159 coefficient), while the U.S. banks suffered from the JPY appreciation (given the -0.270 coefficient). Interestingly, when we look at the impact of the JPY on large/small Japanese banks,
26 Test results are available upon request.
27 The information is collected from the report by the Swiss Re under the title SIGMA – Insurance Investment in a Challenging Global Environment (2010), see:
www.swissre.com.
28 In the case of large Japanese banks, the estimated coefficient for the USD effect (0.045) is insignificant during the crisis period.
29 Testing for asymmetry effects has revealed insignificant values – results are available upon request. Incorporating asymmetry effects in the current system of
15
during the crisis period (coefficient γi,Japan), the results show no home currency sensitivity. Similar insignificant results
are reported in Table 3 when size is not taken into account. Chamberlain et al. (1997) shows that large banks suffered greater foreign loan losses during crises as they were more involved in international business. Thus, one would expect that an increase in home currency value will reduce the impact of foreign loan losses in home currency terms. Data obtained from the Japanese Bankers Association (JBA) unveils that the non-performing loans written-off by Japanese banks increased from JPY452 trillion in 2007 to JPY1,409 trillion in 200930. Therefore, banks with large
foreign losses should benefit from a home currency appreciation, which does not show up in our Japanese sample (coefficient γi,Japan). Our findings are in contrast to Choi and Jiang (2009) who show that, after controlling for size,
MNCs (non-MNCs) face lesser (greater) exchange rate exposure – suggesting that multinationals benefit from operational hedging. We show that large (and possibly multinational) U.S./Japanese banks are more likely to be exposed to home/foreign currency fluctuations than smaller banks.
Finally, no home/foreign currency (FX) effects are observed for small Japanese banks. The reason for this could be attributed to the increased liquidity premiums for such institutions. Previous empirical studies, investigating the liquidity premium, suggest that small firms usually have lower market liquidity31 compared to their larger
counterparts (Brennan and Subrahmanyam, 1996; Amihud, 2002). One could argue that market liquidity tends to decline during market downturns making investors even more concerned about assets’ liquidity (Hameed et al., 2010). That means investors would prefer to invest into large financial institutions, during crises, as they provide higher market liquidity compared to smaller ones. Thus, small Japanese banks are less likely to benefit from any depreciation in the USD compared to their larger rivals, especially during a period of financial distress.
5. Concluding Remarks
This paper uses the VAR-BEKK methodology to examine the relationship between the returns and currency exposure for a sample of U.S., U.K. and Japanese bank and insurance firms between January 2003 and March 2011. We find little evidence that the portfolio returns of banks and insurance firms are related to the conditional variance of home or foreign currencies.
Looking at the banking portfolios, we find that both home and foreign currency changes affect returns and the latter are more pervasive. We also find that the impact of foreign currency on banking portfolios generally change after the recent financial crisis. Typically, the home currency effects on bank returns are found to be more important in the U.S. than in the U.K. or Japan – this is put down to the activities of relatively small banks who have less incentive to hedge or are otherwise limited in their currency hedging activities.
30 The balance sheet information is collected from the Financial Statement of All Banks (FY2008 – FY2011) provided by the JBA, see:
http://www.zenginkyo.or.jp/en/stats/year2_01/index.html. In 2009, more than 70% of the total loan written-offs (i.e. around JPY1,002 trillion) were contributed by large Japanese banks. Besides, during the 4-year period from 2008 to 2011, large Japanese banks had written off JPY2,248 trillion worth of loans compared to around JPY1,000 trillion by the rest of the banking sector.
16
Considering the results for insurance firms, we find that the portfolio returns of both U.K. and U.S. insurers are negatively related to changes in the JPY. However, the impact of the JPY on the U.K. insurers has changed from negative to positive during the crisis period. For the Japanese insurers, changes in the USD have also a negative impact on their equity return over the entire sample period. Furthermore, insurance portfolios are generally free from home currency exposure - apart from the U.K. insurers who have extensive operations in foreign markets.
Finally, when size is taken into account, we find that only small U.S. banks are exposed to home currency value fluctuation over the entire sample period. Changes in the value of the USD (JPY) have a negative influence on large Japanese (U.S.) banks providing support for the “flight to quality” hypothesis. That is, assets in the Japanese market benefit from USD depreciation while the U.S. banks suffer from an appreciation of JPY. The results indicate that competitive effects exist between Japan and the U.K./U.S. in the sense of attracting investor’s funds. Overall, these findings emphasize the importance of currency markets and their impact on bank/insurance equity returns; and gauge the impact of portfolio size as well as the recent financial turmoil.
17 References
Adler, M., and B. Dumas, 1984. Exposure to currency risk: Definition and measurement, Financial Management 13, 41-50.
Adler, M., B. Dumas, and D. Simon, 1986. Exchange risk surprises in international portfolios, Journal of Portfolio Management 12, 44-53.
Amihud, Y., 2002. Illiquidity and stock returns: Cross-section and time-series effects, Journal of Financial Markets 5, 31-56.
Bartov, E., G. M. Bodnar, and A. Kaul, 1996. Exchange rate variability and the riskiness of U.S. multinational firms: Evidence from the breakdown of Bretton Woods system, NBER Working Paper Series No.5323.
Bollerslev, T., and J. M. Wooldridge, 1992. Quasi-maximum likelihood estimation and inference in dynamic models with time-varying covariances, Economic Reviews 11, 143-172.
Branson, W. H., 1983. Macroeconomic determinants of real exchange risk, in Herring, R.J. ed: Managing Foreign Exchange Rate Risk (London).
Bredin, D., and S. Hyde, 2011. Investigating sources of unanticipated exposure in industry stock returns, Journal of Banking and Finance 35, 1128-1142.
Brennan, M. J., and A. Subrahmanyam, 1996. Market microstructure and asset pricing: On the compensation for illiquidity in stock returns, Journal of Financial Economics 41, 441-464.
Brunnermeier, M.K., and L.H. Pedersen, 2009. Market liquidity and funding liquidity, Review of Financial Studies 22, 2201-2238.
Cappiello, L., R. Engle, and K. Sheppard, 2006. Asymmetric dynamics in the correlations of global equity and bond returns, Journal of Financial Econometrics 4, 537-572.
Chamberlain, S., J. S. Howe, and H. Popper, 1997. The exchange rate exposure of U.S. and Japanese banking institutions, Journal of Banking and Finance 21, 871-892.
Chiang, T. C., and D. Z. Zheng, 2010. An empirical analysis of herd behaviour in global stock markets, Journal of Banking and Finance 34, 1911-1921.
Choi, D. M., and C. Jiang, 2009. Does multinationality matter? Implications of operational hedging for the exchange risk exposure, Journal of Banking and Finance 33, 1973-1982.
Choi, J. J., and E. Elyasiani, 1997. Derivative exposure and the interest rate and exchange rate risks of U.S. banks, Journal of Financial Service Research 12, 267-286.
Choi, J. J., E. Elyasiani, and K. J. Kopecky, 1992. The sensitivity of bank stock returns to market, interest and exchange rate risks, Journal of Banking and Finance 16, 983-1004.
Chow, E. H., W. Y. Lee, and M. E. Solt, 1997a. The exchange rate risk exposure of asset returns, Journal of Business 70, 105-123.
Chow, E. H., W. Y. Lee, and M. E. Solt, 1997b. The economic exposure of U.S. multinational firms, Journal of Financial Research 20, 191-210.
Crabb, P. R., 2002. Multinational corporations and hedging exchange rate exposure, International Review of Economics and Finance 11, 299-314.
Cummins, J. D., R. D. Philip, and S. D. Smith, 1996. Corporate hedging in the insurance industry: The use of financial derivatives by U.S. insurers, The Working Paper Series from The Wharton Financial Institution Center.
Davydoff, D., and G. Naacke, 2009. Derivative trading: Trends since 1998, World Federation of Exchanges.
Doukas, J., P. H. Jall, and L. H. P. Lang, 1999. The pricing of currency risk in Japan, Journal of Banking and Finance 23, 1-20.
Eichengreen, B., G. Hale, and A. Mody, 2001. Flight to quality: Investor risk tolerance and the spread of emerging market crises (Kluwer Academic Publisher, Netherlands).
Eling, M., and H. Schmeiser, 2010. Insurance and the credit crisis: Impact and ten consequences for risk management and supervision, Geneva papers on risk and insurance – Issues and practice 35, 9-34.
Elyasiani, E., and I. Mansur, 2003. International spillover of risk and return among major banking institutions: A bivariate GARCH model, Journal of Accounting, Auditing and Finance 18, 303-330
Elyasiani, E., I. Mansur, and M. S. Pagano, 2007. Convergence and risk-return linkages across financial service firms, Journal of Banking and Finance 31, 1167-1190.
18
Fama, E., and K. French, 1993. Common risk factors in the returns on bonds and stocks, Journal of Financial Economics 33, 3-56.
Flood, E., and D. Lessard, 1986. On the measurement of operating exposure to exchange rates, Financial Management 15, 25-36.
Froot, K. A., and T. Ramadorai, 2005. Currency returns, intrinsic value, and institutional-investor flows, Journal of Finance 60, 1535-1566.
Frankel, J. A., 1983. Monetary and portfolio-balanced models of exchange rate determinants (MIT Press, United States).
Grammatikos, T., A. Saunders, and I. Swary, 1986. Returns and risks of U.S. bank foreign currency activities, Journal of Finance 41, 671-682.
Grant, K., and A. P. Marshall, 1997. Large UK companies and derivatives, European Financial Management 3, 191-208. Guillén, M.F., 2009. The global economic and financial crisis: A timeline. Working Paper of The Lauder Institute,
University of Pennsylvania.
Hameed, A., W.J. Kang, and S. Viswanathan, 2010. Stock market decline and liquidity, Journal of Finance 65, 257-293. Harrington, S., 2009. The financial crisis, systematic risk, and the future of insurance regulation, Journal of Risk and
Insurance 76, 785-819.
He, J., and L. K. Ng, 1998. The foreign exchange exposure of Japanese multinational corporations, Journal of Finance 53, 733-753.
Jorion, P., 1990. The exchange rate exposure of U.S. multinationals, Journal of Business 63, 331-345.
Kanas, A., 2000. Volatility spillovers between stock returns and exchange rate changes: International Evidence, Journal of Business Finance and Accounting 27, 447-467.
Kolari, J. W., T. C. Moorman, and S. M. Sorescu, 2008. Foreign exchange risk and the cross-section of stock returns, Journal of International Money and Finance 27, 1047-1097.
Koutmos, G., and A. D. Martin, 2003. First and second moment exchange rate exposure: Evidence from U.S. stock returns, Financial Review 38, 455-471.
Kroner, K. E., and V. K. Ng, 1998. Modelling asymmetric comovements of asset returns, Review of Financial Studies 11, 817-844.
Lang, W. W., and L. I. Nakamura, 1995. ‘Flight to quality’ in banking and economic activity, Journal of Monetary Economics 36, 145-164.
Levi, M. D., 1994. Exchange rates and the valuation of firms (New York University Press).
Mange, J. I., 2000. Measuring foreign exchange risk in insurance transactions, North American Actuarial Journal 4, 88-100.
Martin, A. D., 2000. Exchange rate exposure of the key financial institutions in the foreign exchange market, International Review of Economics and Finance 9, 267-286.
Melvin, M., and M. P. Taylor, 2009. The crisis in the foreign exchange market, Journal of International Money and Finance 28, 1317-1330.
Mian, S. L., 1996. Evidence on corporate hedging policy, Journal of Financial and Quantitative Analysis 31, 419-439. Naes, R., J. A. Skjeltorp, and B. A. Ødegaard, 2011. Stock market liquidity and business cycle, Journal of Finance 66,
139-176.
Nance, D. R., C. W. Smith, and C. W. Smithson, 1993. On the determinants of corporate hedging, Journal of Finance 48, 267-284.
Oetzel, J. M., R. A. Bettis, and M. Zenner, 2001. Country risk measures: How risky are they? Journal of World Business 36, 128-145.
Prasad, A. M., and M. Rajan, 1995. The role of exchange and interest risk in equity valuation: A comparative study of international stock markets, Journal of Economics and Business 47, 457-472.
Reichert, A. and Y. W. Shyu, 2003. Derivative activities and the risk of international banks: A market index and VaR approach, International Review of Financial Analysis 12,489-511.
Shapiro, A. C., 1975. Exchange rate changes, inflation and the value of multinational corporations, Journal of Finance 30, 485-502.
19
Staikouras, S. K., 2006. Financial intermediaries and interest rate risk: II, Financial Markets, Institutions and Instruments 15, 225-272.
Swanson, P.E., 2003. The interrelatedness of global equity markets, money markets, and foreign exchange markets, International Review of Financial Analysis 12,135-155.
Tai, C. S., 2000. Time-varying market, interest rate, and exchange rate risk premia in the U.S. commercial bank stock returns, Journal of Multinational Financial Management 10, 397-420.
Tai, C.S., 2005. Asymmetry currency exposure of U.S. bank stock returns. Journal of Multinational Financial Management 15, 455-472.
Tai, C.S., 2008. Asymmetric currency exposure and currency risk pricing. International Review of Financial Analysis 17,647-663.
Vayanos, D., 2004. Flight to quality, flight to liquidity, and the pricing of risk, NBER Working Paper Series No.10327. Wetmore, J. L., and J. R. Brick, 1994. Commercial bank risk: Market, interest rate, and foreign exchange, Journal of
Financial Research 4, 585-596.
20
Figure 1. Time series of the trade weighted currency price indices*
* The trade weighted currency price index is the relative value of one currency against a basket of other currencies from 21 major industrial countries – source Bank of England. The level of the currency indices has been rescaled to 100 at the beginning of the sample period.
Figure 2. Conditional variances of the trade weighted currency price indices
60 70 80 90 100 110 120 130
2003 2004 2005 2006 2007 2008 2009 2010 2011
Japan UK US
0.00E+00 1.00E-04 2.00E-04 3.00E-04 4.00E-04 5.00E-04 6.00E-04 7.00E-04
2003 2004 2005 2006 2007 2008 2009 2010 2011
US UK Japan
Failure of Lehman Brothers – 15/09/08
[image:21.595.50.504.466.736.2]21
Table 1. Banking and Insurance Portfolios Information
Panel A. Sector Portfolio Size* (Number of Institutions)
Banking Sector* Insurance Sector
Japan UK US Japan UK US
Date All Small Large All All Small Large All All All
2003 79 59 20 6 86 65 21 3 19 61
2004 80 60 20 7 98 74 24 3 22 66
2005 81 61 20 7 101 76 25 3 26 67
2006 83 62 21 8 105 79 26 3 27 69
2007 84 63 21 8 111 83 28 3 33 73
2008 84 63 21 8 111 83 28 3 34 75
2009 86 65 21 8 112 84 28 3 34 75
2010 87 65 22 8 113 85 28 4 34 79
2011 87 65 22 8 114 86 28 4 34 79
* The large and small banking sector portfolios are rebalanced on an annual basis with large banks coming from the top 25 percentile while the rest are considered small banks.
Panel B. Sector Portfolio Statistics
Daily Return (%)
Banking Sector Insurance Sector
Japan UK US Japan UK US
All Small Large All All Small Large All All All
Mean -0.023 -0.022 -0.031 -0.051 -0.035 -0.027 -0.050 -0.006 0.004 -0.015
Mean-Pre 0.000 0.009 -0.004 -0.025 -0.019 -0.015 -0.018 0.064 0.007 0.013
Mean-Post -0.077 -0.123 -0.066 -0.105 -0.073 -0.130 -0.049 -0.162 -0.002 -0.083
Mean-Pre* 0.052 0.064 0.038 0.001 0.015 0.025 0.013 0.098 0.043 0.042
Mean-Post* -0.100 -0.121 -0.080 -0.097 -0.083 -0.122 -0.065 -0.103 -0.032 -0.072
Maximum 13.47 13.21 15.03 15.17 13.29 13.06 15.34 12.328 5.202 10.386
Minimum -10.31 -10.55 -12.26 -15.34 -13.95 -12.68 -18.09 -17.58 -5.05 -16.56
Std. Dev. 1.55 1.49 1.90 1.85 1.45 1.27 2.29 2.44 0.84 1.76
Distributional Properties
Skewness -0.081 -0.094 0.006 -0.207 -0.529 -0.821 -1.031 -0.223 -0.134 -1.019
Kurtosis 10.019 10.630 9.089 14.881 27.178 35.090 16.976 9.301 7.097 17.535
Normality Test 3958 4677 2977 11348 47028 82898 16024 3204 1354 17296
ADF Test -44.62 -44.89 -43.81 -43.18 -22.34 -22.41 -22.83 -43.56 -42.64 -23.93 The Mean-Pre/Post represents the average daily portfolio returns before and after September 15, 2008. This date signifies the collapse of Lehman Brothers and is used as our cut-off point (structural break) for our estimations.
The Mean-Pre*/Post* represents the average daily portfolio returns before and after January 1, 2007. This date is only used for this table to ascertain that the daily negative performance of many financial institutions, during the whole sample period, is directly related to their poor performance during the crisis.
22
Table 2. Joint-Hypotheses Tests
The following table summarizes the test statistics for the four joint-hypotheses tests designed to investigate the joint-significance of the estimated parameters for the FX and FXV risk factors. For each hypothesis test, the test statistics are calculated for banking/insurance portfolios across market and sizes.
All Banks All Insurers Large Banks Small Banks
H1 No home and/or foreign currency variability (FXV) effect
D.F. 18 18 12 12
Test Stat. 0.00 12.00 0.00 0.00
p values 100.00% 84.72% 100.00% 100.00%
H2 No foreign currency changes (FX) and/or variability (FXV) effects
D.F. 24 24 16 16
Test Stat. 64.00 42.00 36.00 70.00
p values 0.00% 1.29% 0.29% 0.00%
H3 No change in home currency (FX) and/or variability (FXV) effect during the crisis
D.F. 6 6 4 4
Test Stat. 10.00 2.00 8.00 6.00
p values 12.47% 91.97% 9.16% 19.91%
H4 No change in home and/or foreign currency (FX) and/or variability (FXV) effects during the crisis
D.F. 18 18 12 12
Test Stat. 44.00 38.00 26.00 52.00
p values 0.06% 0.39% 1.07% 0.00%
D.F. represents degrees-of-freedom of the joint-hypothesis test, which is equal to the number of restricted parameters between restricted and unrestricted model.