*For correspondence: [email protected] Competing interest:See page 14
Funding:See page 15 Received:09 June 2016 Accepted:23 August 2016 Reviewing editor: Marianne E Bronner, California Institute of Technology, United States
Copyright McConnell et al. This article is distributed under the terms of theCreative Commons Attribution License, which permits unrestricted use and redistribution provided that the original author and source are credited.
A novel optical microscope for imaging
large embryos and tissue volumes with
sub-cellular resolution throughout
Gail McConnell
1*, Johanna Tra¨ga˚rdh
1, Rumelo Amor
1, John Dempster
1, Es Reid
1,
William Bradshaw Amos
1,21
Centre for Biophotonics, Strathclyde Institute for Pharmacy and Biomedical
Sciences, University of Strathclyde, Glasgow, United Kingdom;
2MRC Laboratory of
Molecular Biology, Cambridge, United Kingdom
Abstract
Current optical microscope objectives of low magnification have low numerical aperture and therefore have too little depth resolution and discrimination to perform well in confocal and nonlinear microscopy. This is a serious limitation in important areas, including the phenotypic screening of human genes in transgenic mice by study of embryos undergoing advanced organogenesis. We have built an optical lens system for 3D imaging of objects up to 6 mm wide and 3 mm thick with depth resolution of only a few microns instead of the tens of microns currently attained, allowing sub-cellular detail to be resolved throughout the volume. We present this lens, called the Mesolens, with performance data and images from biological specimens including confocal images of whole fixed and intact fluorescently-stained 12.5-day old mouse embryos.DOI: 10.7554/eLife.18659.001
Introduction
During experiments with laser scanning confocal microscopes in the mid-1980s, it became obvious that the optical sectioning, which is the main advantage of the confocal method, did not work with the available low-magnification objectives, because of their low numerical aperture (N.A.) (White et al., 1987). In specimens such as mouse embryos at the 10–12.5 day stage, when the major organs are developing (Kaufman, 1992), it was impossible to see individual cells in the interior despite the lateral (XY) resolution being sufficient. Since then, stitching and tiling of large datasets has proved to be possible using computer-controlled specimen stages, but this results in a checker board pattern in the final image due to inhomogeneity of illumination and focus height errors which often cannot be corrected by software. Commercial and open source software algorithms are avail-able to perform stitching and tiling but inhomogeneities and problems with dataset registration are clearly visible (Legesse et al., 2015). Because of the continuous scanning laser spot that we use with the Mesolens, we do not observe differences in fluorescence signal from one region of the image to another unless it is present in the specimen.
were found to be unsuitable because of poor aberration correction including high field curvature, particularly when focused deeply into specimens immersed in fluid. The most successful attempt with a camera lens has been made recently by Zheng, Ou and Yang (Zheng et al., 2013a;Ou et al., 2016) who used a high-quality Pentax TV lens with an N.A. of approximately 0.3 to produce an image of a 10 mm diameter field with a lateral resolution of 1.56mm. For samples such as a 10 day old mouse embryo, which is 2–3 mm thick, however, an immersion lens is needed for optically-sec-tioned imaging, so that the spherical aberration introduced when imaging from air and through thicker material than the thin coverslip for which the lens is designed does not destroy the optical performance as the light is focused into the specimen. Large-field of view (FOV) water-immersion lenses of great complexity have been developed for photolithography in the manufacture of semi-conductor devices, but these work only with monochromatic light (e.g. at a wavelength of 193 nm) and a fixed object distance so they are not useful for biomedical imaging (Matsuyama et al., 2006). Fourier Ptychographic Microscopy (FPM) can give a very wide field of view image with sub-micron resolution (Zheng et al., 2013b). However, the depth of focus is purposefully large (~0.3 mm) in order to provide a large tolerance to microscope slide placement errors. This very large depth of focus is not suited to confocal laser scanning microscopy, where a small depth of focus is needed for optical sectioning of the imaged specimen. Also, the low N.A. lens used in wide-field FPM is for use in air only. While this is acceptable for thin tissue sections, restriction to air immersion would give dramatic fall-off in axial resolution performance at depth when imaging thick tissues because of spherical aberration, for which there are presently no correction collars or any other means of com-pensation. Furthermore, as noted by Zheng et al. the current FPM method is not a fluorescence technique. Therefore, while FPM gives high-resolution color images of thin specimens such as pathology slides, it is not suitable for fluorescence imaging of either thin or thick specimens in either 2D or 3D. Fluorescence Talbot microscopy is another method that can provide imaging over a large field of view. This usually involves placing the specimen in direct contact with the imaging sensor (Pang et al., 2013), which, because of the requirement for immersion and mounting of specimens in high-index material, is impractical for thick tissue imaging. The work of Panget al. overcomes this limitation (Pang et al., 2013), and makes possible imaging of specimens spatially separated from the sensor with fluorescence contrast and an exceptionally wide field of view. However, while the lat-eral performance is good the reported depth of focus limit of 60mm is too large to be useful for optically sectioning of thick tissue volumes. The imaging speed of 23 s of the instrument described by Pang et al. is attractive but the reported unevenness of Talbot spots over an area of 1 mm x 1 mm of 4.73% is very high when compared with both standard field imaging and our
wide-eLife digest
For hundreds of years, optical microscopes have allowed living tissues to be studied in fine detail. Unfortunately, the images captured through typical microscope lenses feature a compromise between the level of detail in the image and how much of a sample can be shown. For example, densely packed individual cells often cannot be distinguished in an image that shows an entire mouse embryo.To address this issue, McConnell et al. have developed a microscope lens called the Mesolens. This can magnify samples by up to four times in much higher detail than conventional lenses that produce the same magnification.
McConnell et al. tested the Mesolens as part of a technique called confocal microscopy, which can reconstruct the three-dimensional structure of a sample by collecting images from different layers. The resulting images allowed individual cells to be distinguished in cultures of rat brain cells. Furthermore, images of 10–12 day old mouse embryos contained enough detail to reveal many of the structures found inside cells, and allowed the distribution of cells to be tracked in developing organs such as the heart.
Ultimately, the Mesolens has the potential to be used in many different applications and could assist in the study of many biological processes. In the future, McConnell et al. will test how
effectively the Mesolens works as part of other microscopy techniques.
field imaging using the Mesolens. Tsai et al. have performed large FOV two-photon microscopy using a commercial low-magnification objective lens (XL Fluor 4X/340, N.A.=0.28, Olympus), but they observe modest depth penetration and low axial resolution of 16mm, as expected from the N. A. of the objective (Tsai et al., 2015). Furthermore, for objectives designed for multi-photon imag-ing, the performance (primarily colour correction) at visible wavelengths is poor or unpublished. Serial two-photon tomography can provide very high lateral resolution images of the fluorescent mouse brain (Oh et al., 2014). However, this imaging method requires the tissue to be destroyed because of the microtome sectioning needed and this makes repeat imaging impossible. More importantly, stitching and tiling of multiple datasets is required because of the large diameter of the tissue, and this can result in poor image registration and differences in fluorescence signal from one dataset to another. We finally note that some commercial microscopes are described as capable of imaging the same specimen from the macro-scale to the micro-scale (e.g. AZ100 Multizoom, Nikon) but at the low magnifications that permit imaging of large specimens, the N.A. of these microscopes is low, and thus the performance is as for a low N.A. objective. In this paper we present a cure for this problem. We describe a multi-immersion objective lens for wide-field epi-fluorescence and laser scanning confocal microscopy with a working distance of over 3 mm and a 6 mm FOV that is cor-rected for a wide range of wavelengths and demonstrate its advantages with large biological specimens.
Results
The lens was developed from first principles with the aid of optical design software (Zemax), and optimizing for an imaging FOV of 6 mm and an N.A. as close as possible to 0.5. The FOV was cho-sen to match the diameter of a 12.5 day old mouse embryo specimen, and the value of N.A. was chosen based on the well-known equations (Pawley, 2006)
rlat¼ 0
:61l
N:A: (1)
and
zmin¼
2nl
N :A ð Þ2
:
(2)
whererlatis the radius of the first dark ring around the central disk of the Airy diffraction image,zmin
is the distance of the centre of the three-dimensional diffraction pattern to the first axial minimum,n
is refractive index andlis wavelength. Since the depth of field (z resolution) is inversely proportional
to the square of the numerical aperture, it rapidly becomes poor for low N.A. lenses. Below N.A. =0.45 the lateral resolution remains tolerable but the axial resolution is no longer sufficient for resolving sub-cellular details (Figure 1—figure supplement 1). Another important design parameter was the large working distance, to enable focusing through the embryo which, at 10 days old, is around 3 mm thick. This dictated that the lens elements should be physically large, to accommodate the wide collection angles for light originating at a large distance from the lens.
refractive index of each selected sample had to be ascertained and the lens design adjusted to accommodate the small variations from one melt to another of nominally the same glass.
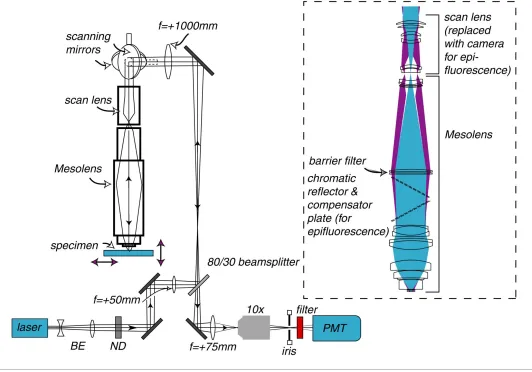
[image:4.612.41.573.70.442.2]The Mesolens is shown in schematic form inFigure 1. In total the Mesolens comprises of 15 opti-cal elements of up to 63 mm in diameter when used in laser scanning confoopti-cal mode. This increases to 17 elements for wide-field epi-fluorescence mode, where a (removable) chromatic reflector with a 30 degree angle of incidence with a custom mercury-line coating designed specifically for this angle of incidence (Chroma Technology Corp.) was incorporated into the optical train to introduce the incoherent light source, as shown in the insert toFigure 1. A tilted compensating plate, similar to the chromatic reflector but anti-reflection coated only, was added to eliminate astigmatism intro-duced by the chromatic reflector (Chroma Technology Corp.). The lens design required manufacture and mounting of the optical elements to fine tolerances, e.g. centration to better than 3mm. This was performed by IC Optical Systems Ltd.
Figure 1.Schematic diagram of the laser scanning confocal Mesolens system. BE=beam expander, ND= neutral density filter. Only one detection channel is shown here for ease of presentation. Inset: Illustration of the optical train of the Mesolens and scan lens. Also shown is the position of the compensator plates and camera when the Mesolens is used for wide-field epi-fluorescence imaging.
DOI: 10.7554/eLife.18659.003
The following figure supplements are available for figure 1:
Figure supplement 1.Lateral and axial resolution of a dry lens as a function of N.A.
DOI: 10.7554/eLife.18659.004
Figure supplement 2.Illustration of the excellent chromatic correction of the Mesolens.
For wide-field camera imaging in brightfield and epi-fluorescence modes, a camera with a 35 mm sensor chip was placed directly on top of the Mesolens via an F-mount. The excitation and detection beam path for laser scanning confocal microscopy is illustrated in Figure 1 and described in the Materials and methods section.
With elements of up to 63 mm in diameter and a scan lens with an aperture diameter of 30 mm the Mesolens cannot be fitted into an ordinary microscope frame and when used in scanned image modes such as confocal, the scanning mirrors have to be very large. We used custom mirrors together with a galvo scanner (8360K, Cambridge Technology) which were made from lightweight beryllium and back-thinned to reduce the mass. These mirrors were required to be flat tol/10 for sufficiently small aberrations. A multi-element scan lens made to our design by Beck Optronic Solu-tions was used to image the back focal plane of the Mesolens into an aperture of 30 mm diameter. The scan lens consisted of 6 optical elements, and was corrected for astigmatism, spherical aberra-tion and chromatic aberraaberra-tions for wavelengths between 400 nm and 750 nm.
We sawed through an upright microscope (Optiphot, Nikon) to remove all but the stage, sub-stage condenser, illuminator and base. We positioned this underneath the Mesolens and added a computer-controlled z-positioning system (Optiscan II, Prior Scientific). The condenser lens was of smaller aperture than the Mesolens and although it had a high-enough N.A. it could not fill the field of the Mesolens: for this, a new type of condenser would have to be designed. Nevertheless, it allowed for some basic optical transmission imaging.
[image:5.612.38.579.318.658.2]We note that with a 6 mm FOV the number of pixels required for a full Nyquist sampling of the image with the design lateral resolution of 0.6 mm is 20000 x 20000 pixels. Using a minimum
Figure 2.Optical resolution measurements for the Mesolens. (a) shows an image of the specimen consisting of a series of gratings with periods of 2
mm, 1mm, and 0.5mm obtained with brightfield illumination and captured in wide-field mode using a camera. (b) and (c) show intensity linescan measurements of this region of the specimen obtained in (b) laser scanning confocal reflection mode using a 514 nm laser and (c) in camera mode. The intensity profiles in (b) and (c) are obtained from the region indicated by the dashed line in (a).
practical pixel dwell time of ca. 0.5ms this leads to an acquisition time of 200 s for a full FOV, full res-olution image. This is similar to the time needed to image 6 mm x 6 mm using multiple images from a 10x objective with N.A.=0.4 yielding a similar z-resolution, and stitching and tiling them. With our imaging system, however, we circumvent the problems of image alignment. In this case the mirror speed is a mere 92 Hz, which is at the limit of what such large mirrors can achieve. In summary, despite appearance, this imaging system is not slower in data rate than a standard laser scanning confocal microscope. For imaging in wide-field camera mode, full Nyquist sampling would require a camera with 400 megapixels.
To summarize, the lens specifications were a magnification of intermediate image of 4x, an N.A. of 0.47, with a working distance of 3.15 mm, 3.40 mm, and 3.74 mm for water, glycerol, and oil immersion media respectively. The distortion was designed to be <0.7% at the periphery of the field. The lens was colour-corrected over the full visible range to allow imaging of samples with mul-tiple fluorescent labels. The flatness of field was designed to be <3mm for wavelengths of 400–700 nm across the 6 mm FOV.
Measurements of optical performance
For quantitative measurements of resolution, a special test target was prepared by electron beam lithography of a 75 nm thick nickel-chromium coating on glass (Oldenbourg et al., 1993). The lateral image resolution was judged by the visibility of a series of gratings with periods of 2mm, 1mm, and 0.5mm. In brightfield transmission mode using wide-field camera detection and in laser scanning confocal reflection mode using the 514 nm laser with photomultiplier tube (PMT) detection, the res-olution was found to be better than 1mm (Figure 2), with the 0.5mm grating unresolved but the 1
mm grating clearly resolved.
To evaluate the full point-spread function (PSF) we used yellow/green-emitting fluorescent beads. For comparison similar measurements were conducted with a conventional dry objective lens of simi-lar magnification (5x/0.15 N.A HCX PL Fluotar, Leica Microsystems) mounted on an upright micro-scope. The results are presented inTable 1. The bead diameter (dbead) was deconvolved using
dmeasured¼
ffiffiffiffiffiffiffiffiffiffiffiffiffiffiffiffiffiffiffiffiffiffiffi d2
beadþd 2 real q
: (3)
The lower than theoretical diffraction-limited resolution in z for laser scanning confocal mode was likely due to residual (primarily astigmatic) aberrations from the scan lens or from inaccuracies in the scan-lens-to-Mesolens separation. The astigmatic error was visible at the edges of the FOV. Never-theless, the z resolution is, as we will demonstrate below, sufficient to resolve sub-cellular detail, and far superior to a standard objective lens with comparable magnification.
[image:6.612.168.575.630.707.2]To investigate whether the lower than theoretical diffraction-limited axial resolution was associ-ated with the scan system and Mesolens, or arose only from the Mesolens, we performed measure-ments of the PSF in wide-field epi-fluorescence mode. The results are presented in Table 1 and shows that the z-resolution is 7mm, which is only somewhat higher than the theoretical resolution (6.3mm) and there are some residual astigmatic aberrations. The lack of improvement of the axial resolution in laser scanning confocal mode is therefore likely due to aberrations in the scan lens and illumination system. Nevertheless, the laser scanning confocal mode still achieves optical sectioning
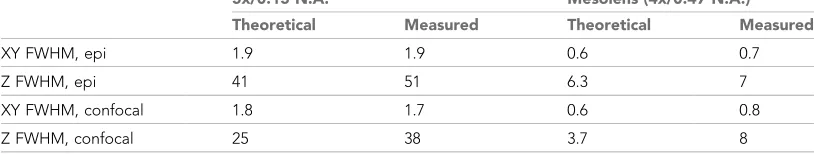
Table 1.Measured and calculated values (mm) for the FWHM of the PSF in laser scanning confocal mode and wide-field epi-fluorescence mode for a conventional 5x/0.15 N.A. lens and the 4x/0.47 N.
A. Mesolens used with oil immersion. We have assumed emissionl=550 nm for the calculations.
5x/0.15 N.A. Mesolens (4x/0.47 N.A.)
Theoretical Measured Theoretical Measured
XY FWHM, epi 1.9 1.9 0.6 0.7
Z FWHM, epi 41 51 6.3 7
XY FWHM, confocal 1.8 1.7 0.6 0.8
Z FWHM, confocal 25 38 3.7 8
not present with wide-field epi-fluorescence mode. The flatness of field was measured to be <=3mm over the central 4.2 mm of the FOV in reasonable agreement with the design specifications.
In order to make measurements of the relative optical throughput efficiency of the Mesolens as compared with a commercial low-magnification, low numerical aperture lens (4x/0.1 N.A. Plan, Nikon) a light-emitting diode (HLMP-2855, Broadcom) was used as a specimen of standard luminos-ity (Beach and Duling, 1993). The LED was driven at constant current and the intensity was moni-tored using a photodiode. The specimen was set up with the same CCD camera for the Mesolens in oil-immersion mode and the 4x/0.1 N.A. objective. Using the same exposure time the intensity with the Mesolens was found to be 25x that with the conventional objective, in good agreement with the 4.7 times higher N.A. available from the Mesolens. To measure the optical throughput we compared the laser power immediately after the beam splitter in the periscope (seeFigure 1) with the laser power at the specimen plane at a wavelength of 488 nm, and we measured an on-axis transmission of 11%. A significant loss results from overfilling the top mirror in the periscope, which is required in order to achieve the flattest possible wavefront. There are also additional losses from the scanning mirrors and in the scan lens. Although the optical throughput of a standard microscope objective can be several tens of percent, the transmission of the complete system is more similar to what we measure here. We also note that the transmission value of the complete system is rarely given explic-itly by microscope manufacturers but, based on the quoted power of the laser system (e.g. 50 mW for a Krypton-Argon laser operating at a wavelength of 488 nm) and measuring the maximum aver-age power at the specimen plane (e.g. 3 mW after the objective lens), we measure a similar magni-tude of optical loss with commercial confocal microscopes compared to the Mesolens. The good transmission of the Mesolens itself is also confirmed by our comparison of the transmission of the Mesolens with that of a 4x/0.1 N.A. lens in camera mode.
[image:7.612.37.576.395.660.2]Imaging of biological specimens
Figure 3 and the Video 1 show wide-field epi-fluorescence data from an explant culture of rat embryonic brain as a colour merge of three camera images at the same focus position. In this
Figure 3.Wide-field epi-fluorescence imaging of an explant culture of rat embryonic brain as a colour merge of three camera images at the same focus position, demonstrating the excellent colour correction of the Mesolens. The blue fluorescence is of nuclei stained with DAPI, neurons show green because of Alexa 488 conjugated to an antibody against beta-III tubulin and astrocytes are red because of Alexa 546 conjugated to anti-GFAP. (a) Full FOV (b) Software zoom of the area indicated in (a) (Video 1) to visualize individual nuclei and neurons.
preparation, the blue fluorescence is of nuclei stained for DNA with DAPI, neurones show green because of Alexa 488 conjugated to an antibody against beta-III tubulin and astrocytes are red because of Alexa 546 conjugated to anti-GFAP (glial fibrillary acid protein). A custom multiband reflector (Chroma) was used with a multiband barrier filter and, for each image, a different exci-tation waveband was selected from a mercury arc lamp. This image clearly shows the excellent chromatic correction of the lens with all three col-ours simultaneously in focus. Furthermore, the image demonstrates the possibility to view both the full large FOV and tiny details in the same image, using only (17x) software zoom.
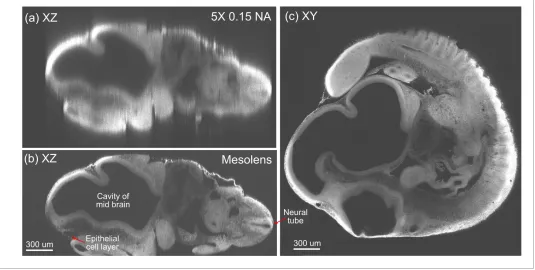
To demonstrate the superior sectioning capa-bility of the Mesolens compared to a standard objective lens with comparable magnification, we imaged the same fixed, cleared and acridine orange-stained 10 day old mouse embryo with the Mesolens and with a dry objective lens of similar magnification (5x/0.15 N.A. HCX PL Fluo-tar, Leica Microsystems) mounted on an upright laser scanning microscope. The embryo was lying on its side so that XY scanning produced an opti-cal section that was anatomiopti-cally sagittal. The XZ images are displayed in Figure 4a and b.
Figure 4awas taken with a z-plane spacing of 1.5
mm and a line average of n=12 and Figure 4b
has a plane spacing of 1mm and no averaging. For both lenses, but acutely for the 5x/0.15 N.A. lens, this is much smaller than the size of the PSF. The Mesolens can image throughout the entire 2 mm thick embryo with sub-cellular resolution (we can see individual nuclei all the way through). This is in contrast to the image with the commercial low magnification, low N.A. objective, where the long needle-like vertical structures indicate a very poor z resolution. The lateral resolution also remains micron-sized throughout the embryo, as can been seen fromFigure 4c, which presents an XY cross section midway through the same embryo. InFigure 4bthe dark cavity within the midbrain on the left and the neural canal within the spinal cord on the right are imaged with good axial resolu-tion even though they are deep within the embryo, which is equally-well resolved at the top and bot-tom of the z range. Although the larger cavities are also visible in the image taken with the 5x lens, finer details such as the dark extracellular spaces in the bright neural tube to the right of the image and the epithelial cell monolayer (upper right margin and left lower corner) are only visible in the Mesolens image (Figure 4b). In the XY section (Figure 4c) similar fine details including individual cell nuclei in all the tissues are clearly resolved. Structures within the embryo were identified by means of (Kaufman, 1992). The constant signal with increasing depth throughout the specimen arises from having a well-cleared specimen. We did not adjust the laser power or detector gain when imaging deeper into tissue.
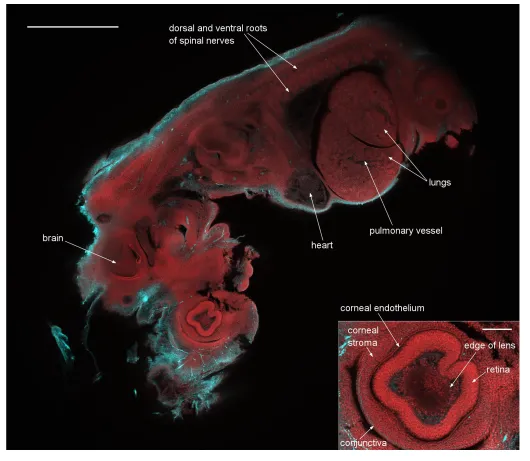
To demonstrate the capability of the instrument as a two-channel detection system, and to illus-trate the very large FOV, we imaged 12.5 day old embryos, which cover nearly the full 6 mm FOV. This embryo was stained with an antibody against axonal beta tubulin coupled to the fluorescent dye Alexa 594, to highlight nerve cells and with acridine orange, here used chiefly as a nuclear marker. A dual-colour single optical section of a 12.5 day embryo stained following this protocol is presented asFigure 5, with a 3D rendering around one of the eyes of the embryo shown asVideo 2. A lower-quality, smaller version of the same data is available asVideo 3. In the 3D rendering there are 60 images axially separated by 3.33mm, imaging a total thickness of 200 mm and we used the fluorescence mode of our image reconstruction software (Volocity, Perkin Elmer) which applies a direct opacity rendering. We can clearly identify fine structures throughout the embryo such as the
Video 1.Epi-fluorescence in an explant culture of rat embryonic brain as a colour merge of three camera images at the same focus position. The blue
fluorescence is from nuclei stained with DAPI, neurones show green because of Alexa 488 conjugated to an antibody against beta-III tubulin and astrocytes are red because of Alexa 546 conjugated to anti-GFAP. The zoom is generated by software only. Halfway into the movie we have changed to a smaller format camera mounted on an image magnifier to achieve fine enough sampling. Note that this will not enhance the optical resolution of the image but was necessary to overcome the lack of a camera able to record hundreds of megapixels in a single image.
developing heart muscle fibers and fine details in the eye such as the corneal endothelium. The inset shows a blow-up of the eye region revealing the individual cell nuclei. We emphasize that this image is only a software zoom from the full scan range of the confocal Mesolens system, not a smaller scanned region. In the eye, the lens was visible as a slightly absorbing structure with a sharply defined outline, surrounded in turn by cells within the aqueous humour and then the strongly-stained retina. All these structures were enclosed in the corneal stroma, lined on the inside with the corneal endothelium and on the outside with the epithelial precursor of the conjunctiva.
To demonstrate that an outstanding axial resolution is retained over the full FOV with only a small degradation at the edges of the image we performed a two-color XZ image of the 12.5 day old embryo. This is presented inFigure 5—figure supplement 1.
Discussion
[image:9.612.41.576.60.330.2]We have shown here that it is possible, using known design software and fabrication to exact toler-ances, to design and construct an objective to facilitate imaging of objects up to 6 mm wide and 3 mm thick in their entirety with depth resolution of only a few microns instead of the tens of microns currently attained, allowing sub-cellular detail to be resolved. We call this lens the Mesolens. In doing this work we have departed from a design principle of more than a century, which is that
Figure 4.Optical sectioning of an optically-cleared and fluorescently-stained 10 day old mouse embryo. (a) is the embryo imaged in XZ using a dry objective lens of similarly low magnification to the Mesolens (5x/0.15 N.A., HCX PL Fluotar, Leica Microsystems). (b) is the same embryo imaged at the same region in XZ using the Mesolens with oil immersion. The Mesolens can image throughout the entire 2 mm thick embryo with sub-cellular resolution: individual nuclei can be observed all the way through. This is in contrast to the image with the commercial low magnification, low N.A. objective, where the long needle-like vertical structures indicate a very poor z resolution.Figure 4cshows an XY cross section at a depth of around 1 mm into the same specimen imaged using the Mesolens. Full resolution versions of (b) and (c) are available asFigure 4—figure supplement 1and2.
DOI: 10.7554/eLife.18659.010
The following figure supplements are available for figure 4:
Figure 4—figure supplement 1.Optical sectioning of an optically-cleared and fluorescently-stained 10 day old mouse embryo imaged using the Mesolens.
DOI: 10.7554/eLife.18659.011
Figure supplement 2.Optical sectioning of an optically-cleared and fluorescently-stained 10 day old mouse embryo imaged using the Mesolens.
the number of lateral resolution units in the field diameter should be approximately the same for all objectives. As we have shown here, the lateral resolution in the image field of this new lens is too great for the human eye, but suits cameras of the highest pixel number available or laser scanning confocal operation and, crucially, the axial resolution justifies the collection of several hundred
Figure 5.A dual-colour optical section of a 12.5 day old mouse embryo obtained with the Mesolens in laser scanning confocal mode. The neuronal axons are stained with Alexa 594 (cyan) and nuclei with acridine orange (red). Scale bar=1 mm. The inset shows a blow-up of the eye region revealing the individual cell nuclei. The image plane of this inset is located 36mm closer to the specimen surface than in the full image shown. The scale bar on the inset image is 300mm. We can clearly identify fine structures throughout the embryo such as the developing heart muscle fibers and fine details in the eye such as the corneal endothelium. The cyan streak in the lower right corner of the blow-up indicates a stained nerve. A z-stack of the same specimen is presented inVideo 2.
DOI: 10.7554/eLife.18659.013
The following figure supplement is available for figure 5:
Figure supplement 1.Illustration of the high z-resolution throughout the full 6 mm FOV.
optical sections of a thick specimen within the working depth. We have shown that single cells, including the nucleated erythrocytes of mouse embryos, and syncytial heart muscle fibres can be seen not just near the surface as with conven-tional objectives but throughout the depth of the embryo. A biologist can therefore discover whether, for example, a defect in development involves changes in the shape of a deep-located organ, or of cell shape or cell number, or of the nucleus-to-cytoplasm ratio. No existing micro-scope can show all of these features simulta-neously in an intact mouse embryo in a single image.
With the Mesolens we also have the possibility of switching from a relatively slow laser scanning mode to fast camera mode with the large field of view in the same focal plane. This is not possible with higher magnification objective lenses. This is of value both in searching for rare image features, and in adjusting the compensation collars of the objective lens.
We do not observe difficulty with the penetration of the acridine orange stain for the E10 embryos, although for the thicker 12.5 day old embryos this might be part of the reason for the reduced signal in the centre of the embryo seen inFigure 5—figure supplement 1a.
If the volume of the point spread function of an objective lens to the first ellipsoidal minimum is divided into the total accessible 3D volume a measure of the number of resolved voxels can be obtained (a quantity comparable to the Nyquist sample but for a 3D volume). The maximum size of a Mesolens dataset is approximately 200x that for a 100x/1.4 N.A. lens. Calculated from the data presented here for the Mesolens, a complete image sampled at Nyquist resolution over the 6 mm x 6 mm x 3 mm volume generates a 639 GB digital image, which is large but the capacity and speed of current computers can readily handle data files of this size.
The ability to record such high-volume data makes it likely that many applications other than the imaging of mouse embryos will be found. Provided the problem of tissue transparency can be solved, there are obvious applications in neurobiology. Also, the Mesolens can reveal spatially rare events, and may have application in the measurement of the mitotic index in slowly-reproducing tis-sues. The 25x higher optical throughput could also facilitate imaging of weakly emitting specimens, for example specimens expressing fluorescent proteins at a low level or containing single cells bear-ing luciferase as a bioluminescent marker.
Recently, a lens of similar numerical aperture to the Mesolens (N.A.=0.6) with a field of 5 mm diameter and a collection depth of 1 mm has been described (Sofroniew et al., 2016). However, this lens is corrected only for a narrow wavelength band (900–1070 nm) and is restricted in use to
Video 2.The movie is a 3D rendering generated from a z-stack through the eye of a 12.5 day old mouse embryo (the same embryo as inFigure 5). This embryo was stained with an antibody against axonal beta tubulin coupled to the fluorescent dye Alexa 594, to highlight nerve cells, and with acridine orange, here used chiefly as a nuclear marker. All frames in the rendering are from full 6 mm x 6 mm frames and only software zoom is used. The blow-up of the eye region reveals individual cell nuclei. The lens was visible as a slightly absorbing structure with a sharply defined outline, surrounded in turn by cells within the aqueous humour and then the strongly-stained retina. All these structures were enclosed in the corneal stroma, lined on the inside with the corneal endothelium and on the outside with the epithelial precursor of the conjunctiva.
DOI: 10.7554/eLife.18659.015
Video 3.This movie is a highly compressed and lower quality version ofVideo 2.Video 3has a much smaller file size for quick downloading and viewing.
single-spot multi-photon imaging, whereas the Mesolens can serve as a multi-wavelength camera lens, a confocal objective, and potentially also as a multi-photon objective, both single-spot and wide-field (Amor et al., 2016).
This development represents the most radical change in microscope objective design for over a century, and we believe that despite the fact that the Mesolens cannot be fitted to a conventional microscope stand, it has the potential to transform optical microscopy through the acquisition of sub-cellular resolution 3D datasets from large tissue specimens.
Materials and methods
The Mesolens
The excitation and detection beam path for laser scanning confocal microscopy with the Mesolens is illustrated inFigure 1. The excitation light was provided by a fiber-coupled multi-line laser system (Laserbank, Cairn Research), comprising 405 nm, 488 nm, 514 nm, 532 nm, 561 nm and 637 nm wavelengths. The laser was expanded using an f= 25 mm lens (LC1054, Thorlabs) and an f= +125 mm lens (LA1986-A, Thorlabs), propagated through an f=+50 mm lens (LA1131-A) and directed towards the scanning system using a periscope. An 80/30 beamsplitter (PBSW-532, Thor-labs) formed the lower mirror of the 1 m periscope, and the top mirror (Thorlabs BB2-E02) steered the beam towards a large-aperture f=+1000 mm achromatic doublet lens (LA1779-A-ML, Thorlabs) to collimate the light before reaching the scan mirrors. The scanning mirrors directed the light through the scan lens and the Mesolens focused the light into the specimen.
The reflected light or fluorescence signal from the specimen was propagated back through the Mesolens, scan lens, scanning system and periscope, and was transmitted through the beamsplitter, chosen to transmit 80% of the (unpolarised) fluorescence emission and reflect 30% of the linearly polarized laser beam. The signal was collected using an f=+75 mm lens (LA1608-A, Thorlabs) and focused through the imaging iris using a non-infinity corrected 10x objective lens (10 OA 25, Comar Optics). The total magnification of the system was 1440, and the confocal iris was set to 1 Airy unit = 1.7 mm. A two-channel PMT system was built for two-colour imaging, with each PMT having its own imaging iris. The PMT used for the images inFigures 2band4b-c, andFigure 4—figure supple-ment 1, 2 and Figure 5—figure supplement 1 was a PMM02, (Thorlabs) and for Figure 5 and
Video 2 a Senstech P30-09 was used for the red channel and Senstech P30-01 was used for the green channel. The bandpass filters were chosen to match the emission wavelengths of the fluores-cent dyes in the specimen (and were removed for reflection imaging).
Images were digitized using a PCI-6110 (National Instruments) multifunction DAQ card with a 12 bit, 5 MHz, simultaneous sampling A/D converter and 16 bit, 4 MHz, D/A converter. For optimum scanning rate and stability, a sine wave scan waveform (max. 66 Hz), was used, with the first half of each cycle digitized and remapped to obtain a linear image field. The system was controlled using an in-house, laser scanning software package, ‘Mesoscan’, designed to handle 400 megapixel scanned images. Images were stored in the Open Microscopy Environment OME.TIFF format and analysed using ImageJ.
Resolution measurements
The camera used to capture the bright field image inFigure 2 was a Nikon Ds-Qi1Mc mounted on top of an image magnifier with a 10x objective lens serving as the magnifying lens. Note that this will not enhance the optical resolution of the image but is a way around the lack of a camera with sub-micron pixel size as required for Nyquist sampling of the image. The same method is used for measuring the PSF using fluorescent beads in epi-fluorescence mode. The upright microscope used for comparing the resolution of the Mesolens to that of a low N.A. 5X lens was a Leica DM6000, with an SP5 scanning unit (Leica Microsystems).
diameter beads (18860–1, Polysciences Inc.) for the remaining resolution measurements respectively. To immobilize the beads they were dried down on to cleaned coverslips and immersed in a Gelvatol medium (341584, Sigma-Aldrich) containing DABCO (diazo-bis-cyclo-octane, 290734, Sigma-Aldrich) as antifade. For the measurement in wide-field epi-fluorescence mode we used a 10x image magni-fier as described above and a cooled CCD camera with 6.45 mm pixel size (CoolSnap HQ2, Photometrix).
The flatness of field was measured in epi-fluorescence in oil immersion mode using 6mm fluores-cent beads (18862, Polysciences Inc.) dried down on the surface of a mirror serving as a flat sub-strate. A camera with a 35 mm sensor chip (C3900-024, Hamamatsu) was placed directly on top of the Mesolens via an F-mount, and images were captured using the manufacturer’s software (HCImage, Hamamatsu).
Explant culture of rat brain,
Figure 3,
Video 1
Explant cultures of embryonic rat brain were prepared and fixed with 2% paraformaldehyde and stained as follows: The nuclei were stained with DAPI, the neurons were stained with Alexa 488 con-jugated to an antibody against beta-III tubulin and astrocytes were stained with Alexa 546 conju-gated to anti-GFAP. For the fluorescence imaging with this specimen a mercury lamp was used for excitation, with custom filters designed for DAPI, Alexa 488 and Alexa 546 (Chroma). Two different cameras were used to image the same region (Figure 3,Video 1). A low-power image was made by recording the entire field of the Mesolens on a monochrome 35 mm CCD chip with 10 megapixels, each of 9 mm square (C3900-024, Hamamatsu). Three images, using UV, blue or green excitation from the mercury lamp were merged and coded blue, green and red respectively. A high-power image was made with a small format color camera Nikon DSL1 (used without a magnifier, in contrast to the resolution measurements described above), recording only a 2.2 mm x 1.6 mm portion of the Mesolens field with a square pixel size of 3.4mm. The theoretical resolution of the Mesolens (0.6mm) corresponds to 2.4mm in image space in the camera, so neither camera allowed Nyquist sampling. In theVideo 1, the wide-field epi-fluorescence image is first software-zoomed and then replaced by the image from the smaller format camera, which is further software zoomed and the view is soft-ware-panned around the region recorded in the small-format camera. This procedure was necessary to overcome the lack of a camera able to record hundreds of megapixels in a single image.
Protocols for staining embryos (Figures 4
and
5,
Figure 4—figure
supplement 1,
2
and
Figure 5—figure supplement 1,
Video 2
and
Video 3)
For the 10 day old embryos inFigures 4,Figure 4—figure supplement 1and2, embryos were dis-sected from mouse uteri, fixed in ethanol: acetic acid 3:1 by volume overnight at 4
˚
C and then trans-ferred into aqueous media via a series of ethanol/water mixtures with decreasing ethanol content. The embryos were then stained overnight with acridine orange (0.05% in phosphate-buffered saline), rinsed overnight in PBS, dehydrated with ethanol solutions, cleared in xylene and mounted in Histo-mount (Fisher Scientific).For the embryo presented inFigure 5 andFigure 5—figure supplement 1embryos were dis-sected from mouse uteri, fixed in Dent’s Fix for 24 hr at 4
˚
C, washed 3 times in PBS and then bleached in Dent’s Bleach (for 24 hr) at 4˚
C. Embryos were then rinsed 5 times in methanol, and fixed in Dent’s Fix (for 24 hr) at 4˚
C and stored at 4˚
C until staining. For antibody staining, embryos were rinsed 3 times in PBS, then washed 5 times in PBS for 1 hr per wash at room temperature. Mouse anti-Tubb3 (beta-III-tubulin) primary antibodies (Sigma-Aldrich T5076-200UL; 1:250 concen-tration) were applied in blocking solution (Bovine Serum Albumin (BSA)), overnight at room tempera-ture, after which the embryos were rinsed 3 times in PBS, then washed 5 times in PBS, for 1 hr per wash at room temperature. Subsequently, rabbit anti-mouse secondary antibodies (1:250) conju-gated to Alexa 594 (Invitrogen) were applied in blocking solution (BSA), overnight at room tempera-ture, after which the embryos were rinsed 3 times in PBS, then washed 5 times in PBS, for 1 hr per wash at room temperature.5 min. Finally, embryos were cleared in 100% BABB overnight at 4
˚
C and were stored in BABB at room temperature until re-staining with acridine orange. All the washing, staining and clearing steps were done with the sample on a rocker. The embryos were then stained with nuclear stain acridine Orange as follows. The embryos were transferred from BABB to PBS via a series of solvents. First, the embryo was transferred to xylene, and left to soak in several changes of xylene to remove the BABB over a period of days. It was then transferred from xylene to three changes of absolute etha-nol, then 90% ethaetha-nol, 10% water by volume, then 75% ethaetha-nol, 50% ethanol and finally into distilled water (with at least 10 min in each change). Acridine orange powder was dissolved in PBS to a pale yellow solution. The embryo was left in the staining solution overnight with gentle rolling on a slow turntable. The embryo was then washed in two changes of PBS over an hour and passed through the same series of alcohols up to xylene and then rolled in BABB overnight. These embryos were imaged in BABB.Imaging parameters for the embryos (Figures 4,
5,
Figure 4—figure
supplement 1,
2
and
Video 2)
The images inFigures 4b,c, Figure 4—figure supplement 1and 2 were acquired using 488 nm excitation with a power of ca 100mW at the sample plane and the signal was detected using a 525/ 39 nm band pass filter. ForFigure 4b/Figure 4—figure supplement 1we used a pixel size of 1mm x 1mm (XZ) a scan speed of 22 lines per second and no frame averaging. ForFigure 4c/Figure 4— figure supplement 2we used a pixel size of 0.5mm x 0.5mm (XY) a scan speed of 22 lines per sec-ond and a frame average of 4. The low line speed was necessitated by the low bandwidth of the PMT used for the images.
The z-stack inFigure 5/Video 2/Video 3was acquired using 488 nm excitation with a power of ca 50mW at the sample plane and the signal was detected using a 525/39 nm band pass filter for imaging the acridine orange. We used 561 nm excitation with a power of approximately 150mW at the sample plane and the signal was detected using a 600 nm long pass filter for imaging Alexa 594. We used a pixel size of 1mm x 1mm x 3.33mm (XYZ), a scan speed of 45 lines per second and a frame average of 4.
The image for Figure 5—figure supplement 1 was acquired using 488 nm excitation with a power of ca 50mW at the sample plane and the signal was detected using a 525/39 nm band pass filter for imaging the acridine orange. We used 561 nm excitation with a power of approximately 150mW at the sample plane and the signal was detected using a 600 nm long pass filter for imaging Alexa 594. We used a pixel size of 1mm x 10mm for XZ images and 1mm x 1mm for the XY images, a scan speed of 30 lines per second and a frame average of 2.
For the image inFigure 4a(acquired on a Leica DM6000 microscope with an SP5 scanning unit) we used a pixel size of 1.44mm x 1mm (XZ) and a scan speed of 400 lines per second, and a frame average of 12.
Acknowledgements
This work was supported by the Medical Research Council, grant number MR/K015583/1, to Gail McConnell and John Dempster. Brad Amos is supported by a Leverhulme Emeritus Fellowship. We thank Gillian Robb (SIPBS, University of Strathclyde) for assistance with using Volocity forVideo 2, Yvonne Vallis (MRC Laboratory of Molecular Biology) for the stained rat brain explant specimens and supply of mouse embryos and Shinya Inoue´ for the gift of the grating test specimen. We thank Richard Mort, Venkat Venkataraman and Shahida Sheraz (MRC Human Genetics Unit, University of Edinburgh) for providing mouse embryos. Brad Amos and Es Reid declare a competing interest from Mesolens Ltd. The dataset underlying this publication can be accessed via http://pure.strath.ac. uk.
Additional information
Competing interests
Funding
Funder Grant reference number Author
Medical Research Council MR/K015583/1 Gail McConnell John Dempster
Leverhulme Trust William Bradshaw Amos
The funders had no role in study design, data collection and interpretation, or the decision to submit the work for publication.
Author contributions
GM, Design and first build of confocal laser scanning system, acquisition of image data, writing the article; JT, Optimising performance of Mesolens in confocal laser scanning mode, preparation of specimens for imaging, acqusition of images, image reconstruction, data analysis, including tion measurement, writing the article; RA, Acquisition of images and data analysis including resolu-tion measurement, writing the article; JD, Design, testing and implementaresolu-tion of Mesoscan software and electronics to control laser scanning system and data acquisition, writing the article; ER, Designed the objective lens and scan lens, acquired simulated data on lens performance; WBA, Specified the lens design, design and first build of the laser scanning system, data acquisition and analysis, writing the article
Author ORCIDs
Gail McConnell, http://orcid.org/0000-0002-7213-0686
Ethics
Animal experimentation: All experimental procedures using animals were conducted in strict accor-dance with the United Kingdom Animals (Scientific Procedures) Act, 1986 and approved by the Home Office (UK).
References
Amor R, McDonald A, Tra¨ga˚rdh J, Robb G, Wilson L, Abdul Rahman NZ, Dempster J, Amos WB, Bushell TJ, McConnell G. 2016. Widefield two-photon excitation without scanning: Live cell microscopy with high time resolution and low photo-bleaching.PLOS ONE11:e0147115.doi: 10.1371/journal.pone.0147115
Beach JM, Duling BR. 1993. A light-emitting diode light standard for photo- and videomicroscopy.Journal of Microscopy172:41–48.doi: 10.1111/j.1365-2818.1993.tb03391.x
Chen F, Tillberg PW, Boyden ES. 2015. Expansion microscopy.Science347:543–548.doi: 10.1126/science. 1260088
Kaufman MH. 1992.The Atlas of Mouse Development. Academic Press.
Legesse FB, Chernavskaia O, Heuke S, Bocklitz T, Meyer T, Popp J, Heintzmann R. 2015. Seamless stitching of tile scan microscope images.Journal of Microscopy258:223–232.doi: 10.1111/jmi.12236
Matsuyama T, Ohmura Y, Williamson DM. 2006. The lithographic lens: its history and evolution. In: D. G.Flagello ed.Optical Microlithography XIX. 6154 SPIE
Oh SW, Harris JA, Ng L, Winslow B, Cain N, Mihalas S, Wang Q, Lau C, Kuan L, Henry AM, Mortrud MT, Ouellette B, Nguyen TN, Sorensen SA, Slaughterbeck CR, Wakeman W, Li Y, Feng D, Ho A, Nicholas E, et al. 2014. A mesoscale connectome of the mouse brain.Nature508:207–214.doi: 10.1038/nature13186 Oldenbourg R, Terada H, Tiberio R, Inoue´ S. 1993. Image sharpness and contrast transfer in coherent confocal
microscopy.Journal of Microscopy172:31–39.doi: 10.1111/j.1365-2818.1993.tb03390.x
Ou X, Zheng G, Yang C. 2016. Erratum: 0.5 gigapixel microscopy using a flatbed scanner: erratum.Biomedical Optics Express7:646–647.doi: 10.1364/BOE.7.000646
Pang S, Han C, Erath J, Rodriguez A, Yang C. 2013. Wide field-of-view Talbot grid-based microscopy for multicolor fluorescence imaging.Optics Express21:14555–14565.doi: 10.1364/OE.21.014555 Pawley JB. 2006.Handbook of Biological Confocal Microscopy. Springer.
Sofroniew NJ, Flickinger D, King J, Svoboda K. 2016. A large field of view two-photon mesoscope with subcellular resolution for in vivo imaging.eLife5:e14472.doi: 10.7554/eLife.14472
Tsai PS, Mateo C, Field JJ, Schaffer CB, Anderson ME, Kleinfeld D. 2015. Ultra-large field-of-view two-photon microscopy.Optics Express23:13833–13847.doi: 10.1364/OE.23.013833
White JG, Amos WB, Fordham M. 1987. An evaluation of confocal versus conventional imaging of biological structures by fluorescence light microscopy.The Journal of Cell Biology105:41–48.doi: 10.1083/jcb.105.1.41 Zheng G, Horstmeyer R, Yang C. 2013b. Wide-field, high-resolution Fourier ptychographic microscopy.Nature
Photonics7:739–745.doi: 10.1038/nphoton.2013.187