Variation in the Intensity of Selection on Codon Bias over Time
Causes Contrasting Patterns of Base Composition Evolution in
Drosophila
Benjamin C. Jackson
1, Jose´ L. Campos
2, Penelope R. Haddrill
3, Brian Charlesworth
2, and Kai Zeng
1,*
1Department of Animal and Plant Sciences, University of Sheffield, Sheffield, United Kingdom 2
Institute of Evolutionary Biology, School of Biological Sciences, University of Edinburgh, Edinburgh, United Kingdom 3
Centre for Forensic Science, Department of Pure and Applied Chemistry, University of Strathclyde, Glasgow, United Kingdom
*Corresponding author: E-mail: [email protected].
Accepted:December 7, 2016
Data deposition: This project has been deposited at the European Nucleotide Archive under the accession PRJEB7673.
Abstract
Four-fold degenerate coding sites form a major component of the genome, and are often used to make inferences about selection and demography, so that understanding their evolution is important. Despite previous efforts, many questions regarding the causes of base composition changes at these sites inDrosophilaremain unanswered. To shed further light on this issue, we obtained a new whole-genome polymorphism data set fromD. simulans. We analyzed samples from the putatively ancestral range ofD. simulans, as well as an existing polymorphism data set from an African population ofD. melanogaster. By usingD. yakubaas an outgroup, we found clear evidence for selection on 4-fold sites along both lineages over a substantial period, with the intensity of selection increasing with GC content. Based on an explicit model of base composition evolution, we suggest that the observed AT-biased substitution pattern in both lineages is probably due to an ancestral reduction in selection intensity, and is unlikely to be the result of an increase in mutational bias towards AT alone. By using two polymorphism-based methods for estimating selection coefficients over different timescales, we show that the selection intensity on codon usage has been rather stable inD. simulansin the recent past, but the long-term estimates inD. melanogasterare much higher than the short-term ones, indicating a continuing decline in selection intensity, to such an extent that the short-term estimates suggest that selection is only active in the most GC-rich parts of the genome. Finally, we provide evidence for complex evolutionary patterns in the putatively neutral short introns, which cannot be explained by the standard GC-biased gene conversion model. These results reveal a dynamic picture of base composition evolution.
Key words:codon usage bias, nonequilibrium behavior, selection, short introns,Drosophila.
Introduction
Here, we investigate the forces that affect evolution at 4-fold degenerate coding sites in Drosophila simulans
andD.melanogaster. These sites represent a substantial part of the genome and are often used as references against which selection at other sites, for example, nonsynonymous sites, is tested (McDonald and Kreitman 1991; Rand and Kann 1996; Parsch et al. 2010;Stoletzki and Eyre-Walker 2011). Quantifying the forces that affect their evolution is necessary both for a general understanding of genome evolution and for making robust inferences about the influences of
demographic factors and selection elsewhere in the genome (Matsumoto et al. 2016).
Codon usage bias (CUB) is a key feature of 4-fold sites, since it involves the disproportionate use of certain codons among the set of codons that code for a given amino acid. There is evidence for CUB in a wide range of organisms, in-cluding both prokaryotes and eukaryotes (Drummond and Wilke 2008; Hershberg and Petrov 2008). The most common explanation for CUB is that this maximizes transla-tional efficiency and/or accuracy (Hershberg and Petrov 2008). Avoidance of the toxicity of misfolded proteins generated by
GBE
ßThe Author(s) 2017. Published by Oxford University Press on behalf of the Society for Molecular Biology and Evolution.
translational errors has also been proposed as an explanation of CUB (Drummond and Wilke 2008). Recent work has also suggested the possibility that stabilizing, as opposed to direc-tional, selection maintains the frequencies of synonymous codons, because CUB has been found to be unrelated to re-combination rate inD. pseudoobscura, in line with theoretical predictions about the action of stabilizing selection (Charlesworth 2013;Fuller et al. 2014;Kliman 2014).
In most species ofDrosophilafor which data are available, includingD. melanogasterandD. simulans, all the preferred codons are GC-ending (Vicario et al. 2007; Zeng 2010). Selection for preferred codons thus acts to increase the GC content of third position sites in coding sequences (CDSs), and GC-ending and AT-ending codons have been often used as proxies for preferred and unpreferred codons, respectively. As in other species, evidence for selection for preferred codons in
D. melanogastercomes from the fact that the level of codon bias is related to expression level (e.g.,Duret and Mouchiroud 1999;Hey and Kliman 2002;Campos et al. 2013). There is also a negative relationship between the level of CUB and synonymous site divergence in theDrosophila melanogaster
subgroup, consistent with selection for preferred codons (Shields et al. 1988;Powell and Moriyama 1997;Dunn et al. 2001;Bierne and Eyre-Walker 2006).
However, analyses based on between-species sequence di-vergence have consistently revealed an excess of substitutions towards AT-ending codons in the D. melanogaster lineage (Akashi 1995, 1996; McVean and Vieira 2001; Poh et al. 2012). Two hypotheses have been proposed for this observa-tion. These are, firstly, thatD. melanogasterhas undergone a reduction in the population-scaled strength of selection for preferred codons, 4Nes, whereNeis the effective population size andsis the selection coefficient favoring preferred codons in heterozygotes for the preferred allele. This reduction in se-lection could be caused either by a reduction inNe (Akashi 1996), or a reduction ins, perhaps due to changed ecological conditions (Clemente and Vogl 2012a,2012b). The second explanation is thatD. melanogasterhas undergone a shift in mutational bias towards AT alleles (Takano-Shimizu 2001; Kern and Begun 2005; Zeng and Charlesworth 2010a; Clemente and Vogl 2012b). It has also been argued that both factors must be invoked to explain patterns of variation and evolution in theD. melanogasterlineage (Nielsen et al. 2007;Clemente and Vogl 2012a,2012b).
Several attempts to detect selection on codon bias in
D. melanogaster have come to conflicting conclusions. For instance, some polymorphism-based studies managed to detect evidence for selection favoring GC-ending codons (Zeng and Charlesworth 2009;Campos et al. 2013), although the intensity of selection may be weak relative to other
Drosophila species (Kliman 1999; Andolfatto et al. 2011). However, other studies did not find support for such ongoing selection (Clemente and Vogl 2012a; Vogl and Clemente 2012; Poh et al. 2012). Thus, there is a pressing need to
gain a better understanding of the dynamics of selection on codon bias and understand the sources of these conflicting results.
Much less is known aboutD. simulans. Early studies based on a small number of loci suggest that this species may be at base composition equilibrium, with the number of substitu-tions from AT-ending codons to GC-ending codons not sta-tistically different from that in the opposite direction (e.g., Akashi 1995, 1996; Kern and Begun 2005; Akashi et al. 2006; Haddrill and Charlesworth 2008). However, more recent analyses have revealed AT-biased substitution patterns (Begun et al. 2007;Poh et al. 2012), suggesting a possible reduction in selection intensity in this lineage, although the reduction may be less severe compared with that inD. mela-nogaster(McVean and Vieira 2001). In contrast to the situa-tion inD. melanogaster, the few polymorphism-based studies inD. simulans generally point to evidence for selection for preferred codons (Akashi 1997, 1999; Kliman 1999; Andolfatto et al. 2011). It is therefore unclear whether/how selection intensity has changed over time inD. simulans, and how the dynamics of base composition evolution differ from those inD. melanogaster.
Irrespective of the reason(s) for the AT-biased substitution pattern in these twoDrosophilalineages, these findings pre-sent a problem for ancestral state reconstruction, a process that is necessary for inferring substitution patterns along a lineage of interest and for polarising segregating sites into ancestral and derived variants to understand their more recent evolution. Use of maximum parsimony methods or maximum likelihood models that assume equilibrium base composition under such circumstances can lead to erroneous inferences although these two methods were used in many previous analyses of variousDrosophilaspecies (Akashi et al. 2007;Matsumoto et al. 2015). Departures from base compo-sition equilibrium may also lead to complex polymorphism patterns (Zeng and Charlesworth 2009). Both of these sources of difficulties may contribute to the mixed evidence for the nature of the forces acting on synonymous sites inDrosophila
(Zeng and Charlesworth 2010a;Clemente and Vogl 2012a). A factor that may confound the study of CUB is GC-biased gene conversion (gBGC), which is a recombination-associated process, and acts to increase GC content at sites where re-combination occurs (Duret and Galtier 2009). Most studies have found little or no evidence for gBGC inD. melanogaster
(Clemente and Vogl 2012b;Comeron et al. 2012;Campos et al. 2013; Robinson et al. 2014), although there is some evidence either for the action of selection for GC basepairs or gBGC on the evolution of non-coding sequences in D. simulans(Haddrill and Charlesworth 2008). In order to control for gBGC, we have analyzed data on the 8–30-bp region of short introns (SIs), which are widely considered to be evolving near-neutrally in Drosophila (Halligan and Keightley 2006; Parsch et al. 2010;Clemente and Vogl 2012b).
To address the questions raised above, we need to look at both divergence and polymorphism data from both species; the analyses should explicitly take into account departures from equilibrium, so that signals of selection can be detected without biases. To this end, we have obtained new whole-genome data from D. simulans and used an existing high-quality data set for D. melanogaster. Using the reference genome ofD. yakubaas an outgroup, we used state-of-the-art methods to reconstruct ancestral states. In addition, we employed methods that can infer selection intensity on differ-ent timescales, along theD. melanogasterand D. simulans
lineages, with the aim of shedding further light on the evolu-tionary dynamics of genome composition in these two species.
Materials and Methods
Sequence Data Preparation
We first describe the sequencing of 22 newD. simulans isofe-male lines, 11 of which were collected by William Ballard in 2002 from Madagascar (MD lines: MD03, MD146, MD197, MD201, MD224, MD225, MD235, MD238, MD243, MD255, and MD72); the other 11 were collected by Peter Andolfatto in 2006 from Kenya (NS lines: NS11, NS111, NS116, NS19, NS37, NS49, NS63, NS64, NS89, NS95, and NS96). We pro-duced homozygous lines by full-sib inbreeding in the Charlesworth lab for nine generations; however, six lines (NS11, NS63, NS116, MD224, MD243, and MD255) were lost early in the process of inbreeding. For these lines, we sequenced the initial stocks that we had received from the Andolfatto lab. Genomic DNA was prepared for each isofemale line by pooling 25 females, snap freezing them in liquid nitrogen, extracting DNA using a standard phenol-chloroform extraction protocol with ethanol, and ammonium acetate precipitation. These flies were sequenced by the Beijing Genomics Institute (BGI;http:// bgi-international.com/; last accessed December 28, 2016). A 500-bp short-insert library was constructed for each sample, and the final data provided consisted of 90-bp paired-end Illumina sequencing (pipeline version 1.5), with an average cov-erage of 64. We double-checked the quality of the filtered reads for each allele with FastQC (available at http://www.bio-informatics.babraham.ac.uk/projects/fastqc/; last accessed December 28, 2016), and no further trimming was necessary. The raw reads have been deposited in the European Nucleotide Archive, study accession number: PRJEB7673.
We obtained sequence data for 20 further D. simulans
isofemale lines fromRogers et al. (2014). These lines were from the same sampling localities in Kenya (10 lines: NS05, NS113, NS137, NS33, NS39, NS40, NS50, NS67, NS78, and NS79) and Madagascar (10 lines: MD06, MD105, MD106, MD15, MD199, MD221, MD233, MD251, MD63, and MD73) as above. Each line was sequenced on between 2 and 3 lanes of paired-end Illumina sequencing at the UCI
Genomics High-Throughput Facility (http://ghtf.biochem.uci. edu/; last accessed December 28, 2016) per line. Further in-formation about these lines and their sequencing is available in the study byRogers et al. (2014). After examining FastQC files for these 20 lines, we trimmed two lines with apparently lower quality scores (MD233 and MD15) using the trim-fastq.pl script from Popoolation 1.2.2 (Kofler et al. 2011) with the (minimum average per base quality score) quality-threshold flag set to 20.
Downstream of sequencing, we combined both data sets and used a BWA/SAMtools/GATK pipeline, previously de-scribed inCampos et al. (2014)andJackson et al. (2015), to generate genotype calls. Briefly, we aligned and mapped reads for eachD. simulansline to the second-generation assembly of theD. simulansreference sequence (Hu et al. 2013) using BWA 0.7.10 (Li and Durbin 2009). We used SAMtools 1.1 (Li et al. 2009) to filter alignments with a mapping quality<20, and to sort and index the resulting alignments. To combine reads from one sample across multiple lanes, we used Picard tools 1.119 (http://broadinstitute.github.io/picard/; last accessed December 28, 2016) to edit BAM file headers and SAMtools 1.1 to merge, resort and index BAM files per sample. We then used Picard tools 1.119 to fix mate information, sort the result-ing BAM files and mark duplicates. We performed local realign-ment using the RealignerTargetCreator and IndelRealigner tools of GATK 3.3 (https://www.broadinstitute.org/gatk/; last accessed December 28, 2016).
For single nucleotide polymorphism (SNP) calling, we used the UnifiedGenotyper for diploid genomes (parameter: sam-ple_ploidy 2) and generated a multisample VCF file (Danecek et al. 2011). Subsequently, we performed variant quality score recalibration (VQSR) to separate true variation from ma-chine artefacts (DePristo et al. 2011). We used biallelic and homozygous (for a given individual) SNPs detected at 4-fold sites at a frequency equal to or higher than seven sequenced individuals as the training set. Six SNP call annotations were considered by the VQSR model: QD, HaplotypeScore, MQRankSum, ReadPosRankSum, FS, and MQ, as suggested by GATK (see http://www.broadinstitute.org/gatk/; last accessed December 28, 2016; DePristo et al. 2011). The SNPs were allocated to tranches according to the recalibrated score, so that a given proportion of the true sites were recov-ered. We retained variants that passed a cutoff of 95%, the variant score limit that recovers 95% of the variants in the true data set. We refer to this data set as “filtered.” From the multisample recalibrated VCF file, we made a consensus se-quence FASTA file for each individual using a custom Perl script. The variant calls that did not pass the filter were called N (missing data) at the sites in question. We also gen-erated an unfiltered data set, where we did not implement any form of variant score recalibration. We refer to this data set as “unfiltered.” The VCF files and the scripts used to pro-duce them can be downloaded by following the hyperlink
provided in http://zeng-lab.group.shef.ac.uk; last accessed December 28, 2016.
Annotation of theD. simulansData Set
Using annotations from theD. simulansreference (Hu et al. 2013), we extracted CDSs for each gene and made FASTA alignments. We included theD. simulansreference sequence and the 1:1 FlyBase orthologous genes of D. melanogaster
(release version 5.33) andD. yakuba(release version 1.3). We then performed amino acid sequence alignments using MAFFT (Katoh et al. 2002). These amino acid sequence alignments were translated back to nucleotides using custom scripts in PERL to produce in-frame CDS alignments that included the 42 D. simulansalleles and the D. melanogaster and theD. yakubaoutgroups. We extracted 4-fold (and 0-fold) degener-ate sites from CDS alignments which were 4-fold (0-fold) de-generate in all lines, with the condition that there was at most one segregating site in the codon to which the 4-fold (0-fold) site belonged. We retained the 4-fold (0-fold) sites from an alignment only if there were at least ten 4-fold (0-fold) sites in that alignment in total. For the polymorphism and substitution analyses on 4-fold sites reported in the Results, we carried out the same procedure with the added condition that sites must also be 4-fold degenerate in the three reference sequences.
We also extracted the intron coordinates from the D. simulans reference genome sequence. Genomes were masked for any possible exons. For each D. simulans
intron, we obtained the corresponding orthologous intron ofD. melanogaster(Hu et al. 2013). ForD. yakuba, for each orthologous gene, we obtained all its annotated introns and blasted them against the D. melanogaster introns (of the same ortholog) with an e-value of<105and selected the reciprocal best hit (because introns are generally short, the threshold e-value was conservative; see Results). We used RepeatMasker (http://www.repeatmasker.org) to mask re-petitive elements in our intron data set, using the library of repeats for D. melanogaster and the default settings. We produced a final alignment of each intronic polymorphism data set ofD. simulanswith the correspondingD. melano-gasterandD. yakubaorthologs using MAFFT.
We extracted positions 8–30 bp of all introns<66-bp long, based on theD. melanogasterreference alignment for each intron, as we considered theD. melanogasterreference to be the best annotated of the three species. To do this, we scanned the D. melanogaster reference sequence for each intronic alignment. We retained the alignment if theD. melanogaster
reference sequence was<66-bp long (not including alignment gaps), and then further obtained the coordinates of the 8-bp position and the 30-bp position in theD. melanogaster refer-ence sequrefer-ence after discarding any gaps introduced by the alignment program. We then cut the whole alignment at these coordinates. These SI sites are thought to be close to neutrally evolving in Drosophila, based on their patterns of
polymorphism and substitution (Halligan and Keightley 2006; Parsch et al. 2010;Clemente and Vogl 2012b).
TheD. melanogasterData Set
Similar analyses were performed using a D. melanogaster
polymorphism data set, described in Jackson et al. (2015), which consists of 17 Rwandan D. melanogaster samples (RG18N, RG19, RG2, RG22, RG24, RG25, RG28, RG3, RG32N, RG33, RG34, RG36, RG38N, RG4N, RG5, RG7, and RG9) made available by theDrosophilaPopulation Genomics Project 2 (Pool et al. 2012).
Quality Control ofD. simulansGenotypes
The lines that were inbred successfully for nine generations to produce homozygous samples still retained low levels of resid-ual heterozygosity, which may have been due to a failure to purge our lines of natural variation (Stone 2012), or to SNP calling errors (the latter should be less likely given the high coverage [64] and our stringent SNP calling regime). We quantified the amount of residual heterozygosity per sample for each of the unfiltered and filtered data sets (supplementary fig. S1,Supplementary Materialonline). As expected, the fil-tered data set exhibited lower levels of residual heterozygosity (ND samples: mean value = 0.0616%, all values<0.5%; MD samples: mean value = 0.0168%, all values<0.15%). The six lines that were not subject to the inbreeding procedure (see above) did not have substantially higher levels of residual het-erozygosity than the remaining samples, presumably because they were already considerably inbred after being kept as lab-oratory stocks for several years. For downstream analyses we treated heterozygous sites as follows: at each heterozygous site within a sample, one allele was chosen as the haploid genotype call at that site with a probability proportional to its coverage in the sample. The alternative allele was discarded. Because our samples are from partially inbred lines that originated from a mating between at least one wild male and only one wild female, heterozygosity at a site implies that the site is segregat-ing in the wild population. By samplsegregat-ing one allele at random, we attempted to replicate the inbreeding process, which aimed to remove heterozygosity from within the lines.
PairwiseSvalues (synonymous site diversity) for all 42D.
simulanslines showed three pairs of samples which deviated substantially from the distribution of pairwise S between samples (mean S for all samples = 0.030, SD = 0.0018). These pairs were MD201–NS116 (S= 7.28 105); NS137–NS37 (S= 0.0034) and NS49–NS96 (S= 0.0097). A principal component analysis (PCA) of binary genotypes placed NS116 within the cluster of MD samples, and NS116 exhibited a more MD-like genetic distance to theD. simulans
reference sequence. These results were based on the filtered data set, but the unfiltered data set returned qualitatively iden-tical patterns (data not shown). We therefore excluded NS116 from all downstream analyses based on the likelihood of its
representing labeling error. We also excluded NS37 and NS96 as these individuals had the highest levels of residual hetero-zygosity out of the remaining two pairs of closely related sam-ples (supplementary fig. S1,Supplementary Materialonline).
To further assess the quality of our data sets, we compared polymorphism and divergence statistics to data previously pub-lished in the literature onD. simulans(see Results). In particular, we calculated a range of summary statistics per gene:FST be-tween NS and MD samples;, Tajima’sD,D, andWwithin the NS sample, within the MD sample, and for both samples com-bined.Dfor a given gene (Langley et al. 2014) is defined as
p¼ ^
k S
1 Pn1
i¼1 ð1=iÞ
ð1Þ
wherekrepresents the mean number of pairwise differences among thenalleles in the sample, andSis the number of seg-regating sites (Langley et al. 2014). We calculated this statistic using a modified version of the tajima.test() function from the pegas package (Paradis 2010) in R.Dis similar to Tajima’sD (Tajima 1989), but is normalized by the total amount of diversity. Its advantage over Tajima’sDis that it is less dependent on the total diversity for the sample (Langley et al. 2014). We also com-paredKAandKSbetween the three reference sequences (D.
melanogaster, D. simulansandD. yakuba) in all CDS alignments using the kaks() function from the seqinr package in R, andKSI between the reference sequences in all our SI alignments using the dist.dna() function from the pegas package in R, based on the K80 method (Kimura 1980). These analyses are presented in the first section of the Results.
Divergence-Based Analyses
We used three methods to determine the ancestral state at themelanogaster-simulans(ms) node, all of which used only the three reference sequences. First, we used parsimony, im-plemented in custom scripts in R. Second, we used the nonho-mogeneous general time-reversible (GTR-NHb) substitution model, implemented in the baseml package of PAML v4.8 (Yang 2007), after checking that GTR-NHb fitted the data better than the stationary GTR model using chi-squared tests (see Results). The use of this method to reconstruct an-cestral sites when nucleotide composition is nonstationary is described in the study byMatsumoto et al. (2015)and has been shown to produce highly accurate results in the presence of nonequilibrium base composition, whereas the parsimony method is likely to be biased. Under the GTR-NHbmethod, we implemented two ways of determining the ancestral state at themsnode, by either using the single best reconstruction (SBR) of the ancestral sequence at the ms node, or by weighting the four possible nucleotides at the ms node by the posterior probability of each. Instead of ignoring suboptimal reconstructions, as the parsimony and SBR methods do, the last option weights all the possible an-cestral states by their respective posterior probabilities.
Following Matsumoto et al. (2015), we refer to these two GTR-NHb-based methods as “SBR” and “AWP,” re-spectively. The AWP method should be more reliable than either parsimony or SBR when base composition is not at equilibrium (Matsumoto et al. 2015).
Since some of the models we used are very parameter-rich (e.g., the GTR-NHbmodel has 39 parameters for three species, and the M1* model described more fully below has 25 pa-rameters forD. simulansand 21 parameters forD. melanoga-ster, given the sample sizes), we had to group genes into bins to avoid overfitting. To investigate the relationship between selection and GC content at 4-fold sites (a proxy for the extent of CUB), we binned 4-fold sites by the GC content in the
D. melanogaster reference sequence, which we used as a proxy for the historic strength of selection favoring GC alleles. GC content evolves very slowly over time (Marais et al. 2004), and is highly correlated betweenD. simulansandD. melano-gasterCDS (Pearson’s correlation coefficientr= 0.97,P<2.2
1016
), so this strategy should accurately represent GC content at themsnode. We binned 4-fold degenerate sites into 20 autosomal and four X-linked bins. Bins were chosen to maintain approximately the same number of genes per bin. The autosomal and X-linked SI sites were always treated as two separate bins. We also followed this binning convention for other analyses. When carrying out correlation analyses between GC content bins and other variables (e.g., substitu-tion rate and estimates of the selecsubstitu-tion coefficient), we in-cluded only the 4-fold degenerate site GC bins, but not the SI bin. We also restricted the correlation analysis to the auto-somal bins only. Given the small number of bins on the X chromosome, this type of analysis is underpowered; in fact, the smallestP value that Kendall’s can achieve with four data points is 0.08.
To determine whether or notD. melanogasterandD. simu-lansare in base composition equilibrium, for each bin we counted the numbers of S!W (NS!W), W!S (NW!S), and putatively neutral (Nneu) substitutions (i.e., S!S and
W!W), whereS represents G or C, the strong (potentially preferred) allele, andW represents A or T, the weak (poten-tially unpreferred) allele. We did this along each of the
D. melanogasterandD. simulanslineages by (probabilistically) comparing the reconstructed ancestral states at themsnode with the reference genomes. This is reasonable because the branch length is much higher than the level of within-species polymorphism (see Results). For the AWP method, we rounded our results to the nearest integer. Where possible, we compared our results to those published in the literature, and to equivalent results kindly provided by Juraj Bergman and Claus Vogl (pers. comm.; supplementary table S2,
Supplementary Materialonline). To obtain theW!S substi-tution rate (rW!S) per bin, we divided NW!S by the total number of AT sites (LW) at the ms node in that bin. Similarly,rS!W ¼NS!W=LS.
Polymorphism-Based Analyses
For each bin, we estimated the derived allele frequency (DAF) at segregating sites, using the three methods described above to infer ancestral states at themsnode, which should be a reasonable approximation given the rarity of shared polymor-phism for the two species (Clemente and Vogl 2012b). We classified these sites into segregating sites at which the ances-tral allele was AT and the derived allele was GC (DAFW!S), and segregating sites at which the ancestral allele was GC and the derived allele was AT (DAFS!W), as well as segregating sites which had mutated from A to T, orvice versa, and from G to C orvice versa (DAFneu). We also calculatedD (Langley et al. 2014) for each bin. We mostly display results obtained from the AWP method in the Results section, because it is probably the most reliable of the three. Qualitatively, the results are generally insensitive to the choice of method for reconstructing ancestral sites. Thus, we present a set of figures in the supplement (supplementary figs. S6–S11,
Supplementary Material online) that are parallel to those shown in the main text, but were obtained using either par-simony or SBR, respectively.
We used two polymorphism-based methods for estimating the population-scaled strength of the force favoring GC al-leles,¼4Nes, whereNeis the effective population size ands is the selection coefficient against heterozygous carriers of the AT allele. The first is the method ofGle´min et al. (2015), which uses three different classes of polarized unfolded site fre-quency spectra (SFS) for sites that are segregating in the pre-sent day:S!W,W!S, and putatively neutral (see above). This method is capable of taking into account polarization errors, which, if untreated, may lead to upwardly biases esti-mates of (Hernandez et al. 2007), by incorporating them into the model and estimating them jointly with the parame-ters of interest. It is also capable of correcting for demographic effects, by introducing nuisance parameters to correct for dis-tortions in the SFS due to demography (afterEyre-Walker et al. 2006). Because it only considers the SFS of derived alleles, we expect this method to recover signatures of selection on a relatively recent time scale (~4Negenerations if we conserva-tively assume neutrality). We generated unfolded SFSs for this model using the AWP method to infer the ancestral state at themsnode and estimated the strength of using R code provided in the supplementary material of Gle´min et al. (2015). We refer to the models using this method with the same notation asGle´min et al. (2015). These are model M0, where¼0 and polarization errors are not taken into ac-count; M1, where6¼0 and polarization errors are not taken into account; and M0* and M1*, which are the equivalent models after correcting for polarization errors. Note that the method for controlling for demography drastically increases the number of model parameters. For instance, for M1, in addition to and the three mutational parameters for each of the three SFSs (¼4Ne), it requires an additionaln– 2
nuisance parameters, wheren is the number of frequency classes (in our case, this is the same as the sample size). Given the dearth of SNPs relative to substitutions, and in par-ticular the lower diversity level in D. melanogaster, we re-peated some of these analyses by pooling SNP data across several nearby GC content bins (see Results).
Second, we used the method ofZeng and Charlesworth (2009), modified as described byEvans et al. (2014), which uses the unpolarized SFS (including fixed sites) to infer param-eters of a two-allele model with reversible mutation between
WandSalleles, selection and/or gBGC, and changes in pop-ulation size (seeZeng (2012)for a discussion of the differences between the reversible mutation model and the infinite-sites model on which the method ofGle´min et al. (2015)is based). Because this method uses the unpolarized SFS, no outgroup is required. This method can recover signals of selection (and other population genetic parameters) over a longer time scale than the methods ofGle´min et al. (2015) because it uses information on the base composition of the species to estimate the parameters (seeZeng and Charlesworth 2009;
supplementary fig. S8–S11). As above, we defined W (AT) andS (GC) as our two alleles. We define uas the rate at whichSalleles mutate to W alleles, andv as the mutation rate in the opposite direction, and¼u=v as the mutation bias parameter. To incorporate a change in population size, we assume that the population in the past is at equilibrium with population sizeN1, which then changes instantaneously toN0(this can be either an increase or a reduction in size) and remains in this state fortgenerations until a sample is taken from the population in the present day (Zeng and Charlesworth 2009;Haddrill et al. 2011;Evans et al. 2014). As with M1* and M1, we also tested the equivalent models where¼0. For each model, in order to ensure that the true MLE was found, we ran the search algorithm multiple times (typically 500), each initialized from a random starting point. All the results reported above were found by multiple searches with different starting conditions. Chi-squared tests were used to evaluate statistical support for different models. We refer to these models as ZC0 (¼0) and ZC1 (6¼0) below. A soft-ware package implementing this approach is available at
http://zeng-lab.group.shef.ac.uk. For all methods (Zeng and Charlesworth 2009;Gle´min et al. 2015), we fitted indepen-dent models for each SI and 4-fold bin (Zeng and Charlesworth 2010b;Messer and Petrov 2013).
Results
Patterns of Polymorphism and Divergence in the
D. simulansandD. melanogasterData Sets
ForD. simulans, after extracting 4-fold degenerate sites and SI (positions 8–30 bp of introns<66-bp long), we retained 7,551 autosomal CDS alignments and 1,226 X-linked CDS alignments, as well as 5,578 autosomal SI alignments and
516 X-linked SI alignments. The final data set contained the reference sequences of D. simulans, D. melanogaster, and
D. yakuba, as well as polymorphism data from 39D. simulans
lines, including 21 Madagascan (MD) lines and 18 Kenyan (NS) lines, with 22 of the 39 lines being described for the first time in this article (see Materials and Methods). ForD. melanoga-ster, we retained 5,550 autosomal CDS alignments and 888 X-linked CDS alignments, as well as 7397 autosomal SI align-ments and 738 X-linked SI alignalign-ments, containing polymor-phism data from 17 Rwandan (RG) lines, as well as the three reference sequences.
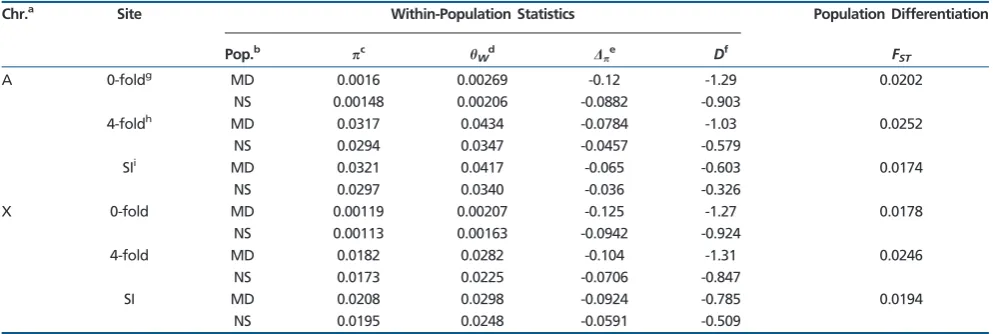
Summary statistics calculated using aD. simulansdata set that was filtered to separate true genetic variation from vari-ant-calling artefacts are presented intable 1(see supplemen-tary table S1,Supplementary Materialonline for the unfiltered data). Consider first the MD lines (n= 21) collected from the putatively ancestral range of the species in Madagascar (Dean and Ballard 2004). Autosomalat 4-fold sites (referred to as
4) was 0.0329 and 0.0317 for the unfiltered and filtered data sets, respectively, similar to the value of 0.035 reported by Begun et al. (2007). On the X,4was 0.0191 and 0.0182 for the two data sets; theBegun et al. (2007)value was 0.02. Tajima’sDandp at 4-fold sites are both negative, implying
that there may have been a substantial recent population size expansion. Again, values obtained from the filtered and unfil-tered data are very similar (cf.table 1andsupplementary table S1, Supplementary Material online). Overall, diversity was slightly reduced for our filtered data set, which may have been a result of more conservative variant filtering criteria, but the differences are minimal. In what follows, we only present results obtained from the filtered data set. SI sites, which we only obtained from our filtered data set, are more diverse than 0-fold and 4-fold sites in the MD population, for both the autosomes (A) (SI= 0.0321) and the X (SI= 0.0208) (table 1).
The samples collected from Kenya (the NS lines; n= 18) have consistently lower diversity levels at 0-fold, 4-fold, and SI sites, and less negative Tajima’sDandp, probably caused
by bottlenecks associated with the colonization process (Dean and Ballard 2004). Nonetheless,FSTbetween the two popu-lations at 4-fold sites is rather low: ~2.5% between NS and MD (table 1), suggesting that there is relatively little genetic differentiation between the ancestral and derived populations. There is also little difference inFSTat 4-fold sites between the X and A. Similar to the MD population, SI sites are the most diverse class of site as measured by(table 1).
The patterns reported above contrast with those observed inD. melanogaster(seetable 1ofJackson et al. 2015). We focus first on samples from the putatively ancestral ranges of both species (i.e., the RG lines forD. melanogaster, and the MD lines forD. simulans). Autosomal4is ~2.06 times higher inD. simulans, suggestive of higher Ne, which may lead to more effective selection (see Discussion). Tajima’sDis also less negative in D. melanogaster, with the differences at 4-fold
sites being the most noticeable (0.11 vs.1.03 for A, and
0.47 vs.1.31 for the X), suggesting a more stable recent population size inD. melanogaster, which is supported by the fits of the Zeng and Charlesworth (ZC) method to the data (see below). The X:A ratio of4inD. melanogasterwas 1.08, much higher than the expected value of 0.75 under the stan-dard neutral model, whereas it was 0.57 in D. simulans. Furthermore,FST at 4-fold sites between RG and a sample from France (Jackson et al. 2015) inD. melanogasteris ~10 times higher than that between the MD and NS populations in
D. simulans.Interestingly, the difference inFSTbetween the X and A is much more marked inD. melanogaster(0.29 vs. 0.17 for the X and A, respectively) than inD. simulans(0.025 for both X and A). Various theories have been proposed to explain differences in diversity levels between X and A, which include sex-specific variance in reproductive success (Charlesworth 2001), demographic effects (Pool and Nielsen 2007; Singh et al. 2007;Pool and Nielsen 2008;Yukilevich et al. 2010), positive and negative selection (Singh et al. 2007; Charlesworth 2012), and differences in recombination rate (Charlesworth 2012). Detailed analyses of the factors under-lying X-autosomal differences are outside the scope of this study; below we present results from X and the autosomes separately.
We also assayed divergence between the reference se-quences in our alignments. Between D. melanogaster and
D. simulans, KA,KS andKSI were 0.014, 0.109 and 0.130, respectively. These values are similar to those inTable 1 of Parsch et al. (2010)(KA= 0.019,KS= 0.106 andKSI= 0.123), and inZhang et al. (2013; supplementary table S2 therein) (KA= 0.015 and KS= 0.12). In our data KA,KS and KSI, be-tweenD. melanogaster and D. yakuba were 0.036, 0.266 and 0.294, respectively; between D. simulans and D. yakuba, they were 0.036, 0.250 and 0.302, respectively. Note that divergence is always highest at the SI class of site, which is in agreement with these sites being relatively uncon-strained (Halligan and Keightley 2006; Parsch et al. 2010; Clemente and Vogl 2012b). Overall, these patterns suggest that our alignments are of high quality.
In the following sections of this article, we first focus on analysing the forces that act on 4-fold sites. To investigate the relationship between selection and GC content at 4-fold sites (a proxy for the extent of CUB), we binned 4-fold sites by their GC content in theD. melanogasterreference sequence, which we used as a proxy for the historic strength of selection favor-ing GC alleles. In this part of the analysis, the putatively neu-trally evolving SI sites are analyzed as a whole and presented alongside results from 4-fold sites for comparison. Later, to gain further insights into the evolution of the SI sites them-selves, we binned them according their GC content, and ana-lyzed the bins in the same manner as the 4-fold sites. Only data from the putatively ancestral populations (i.e., MD in
D. simulansand RG in D. melanogaster) are considered, in order to avoid complications introduced by population
structure. For ease of notation, we use GC andS(the strong, potentially preferred allele) interchangeably below; the same applies to AT andW(the weak, potentially unpreferred allele).
Excess ofS!W substitutions at 4-Fold sites on both the
D. simulansand theD. melanogasterLineages
For all the 4-fold site bins and the SI bin (on both A and X), a nonhomogeneous (GTR-NHb) substitution model imple-mented in PAML always fitted the data significantly better than a stationary (GTR) substitution model in both species (min2= 166.86, df = 28,P= 1.051021
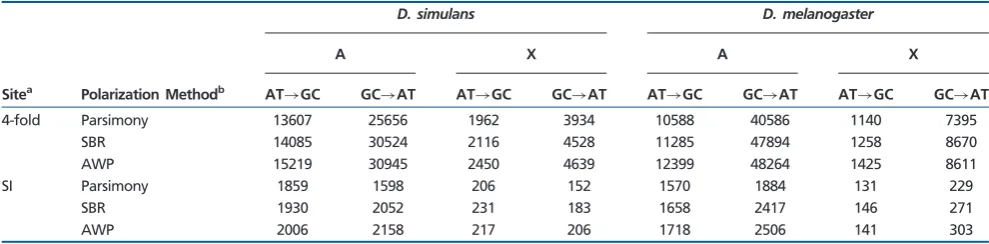
), which is indica-tive of a nonequilibrium base composition. Considering the genome as a whole, both theD. melanogasterandD. simu-lanslineages showed an excess ofS!W changes at autoso-mal and X-linked 4-fold degenerate sites, regardless of which method was employed to infer ancestral states at the mela-nogaster-simulans(ms) node (table 2;supplementary table S2,
Supplementary Materialonline; see Materials and Methods). It is evident that the excess is greater inD. melanogasterthan
D. simulans. For instance, based on autosomal data obtained by the AWP method, which we expect to be the most accu-rate method of the three (Matsumoto et al. 2015), the ratio
NW!S=NS!W, whereNW!S andNS!W are the numbers of substitutions between theSandW alleles along the lineage of interest, is 0.49 inD. simulans, but is only 0.26 inD. mel-anogaster (2= 2145.8, df = 1,P<0.001). Interestingly, the
S!W bias is much more pronounced on the X of
D. melanogasterwith anNW!S=NS!W ratio of 0.17, signifi-cantly different from the A value of 0.26 (2= 212.8, df = 1,
P<0.001), whereas inD. simulansthe ratios are much closer to one another, 0.53 and 0.49, respectively, although this difference is still significant (2= 6.97, df = 1, P= 0.008). These results are in line with previous findings of an excess of AT (or unpreferred codon) substitutions at silent sites inD. melanogaster (Akashi 1995, 1996; Takano-Shimizu 2001; Akashi et al. 2006). ForD. simulans, our data are in agreement with a data set curated entirely independently by Juraj Bergman and Claus Vogl (personal communication; supple-mentary table S2,Supplementary Materialonline), and sug-gest that there is a much more pronouncedS!W bias than was found in some previous studies (Akashi et al. 2006;Begun et al. 2007;Poh et al. 2012).
The ratioNW!S=NS!W is much closer to unity for SI sites than for 4-fold sites (table 2), which is also in agreement with the previous finding that SI are generally closer to equilibrium than 4-fold sites in both species (Kern and Begun 2005;Singh et al. 2009;Haddrill and Charlesworth 2008;Robinson et al. 2014). The three methods for inferring ancestral states in the
[image:8.595.51.548.111.278.2]msancestor consistently suggest an AT substitution bias at SI sites in theD. melanogasterlineage (table 2). The situation is somewhat more complex inD. simulans.For the X, all three methods suggest a mild GC bias, but the ratio based on AWP, which should be the most reliable method of the three (Matsumoto et al. 2015), is not significantly different from 1 (2= 0.286, df = 1,P= 0.59). For the autosomes, parsimony
Table 1
Summary statistics for the filteredD. simulansdata set
Chr.a Site Within-Population Statistics Population Differentiation
Pop.b
pc hWd Dp
e Df F
ST
A 0-foldg MD 0.0016 0.00269 -0.12 -1.29 0.0202
NS 0.00148 0.00206 -0.0882 -0.903
4-foldh MD 0.0317 0.0434 -0.0784 -1.03 0.0252 NS 0.0294 0.0347 -0.0457 -0.579
SIi MD 0.0321 0.0417 -0.065 -0.603 0.0174
NS 0.0297 0.0340 -0.036 -0.326
X 0-fold MD 0.00119 0.00207 -0.125 -1.27 0.0178
NS 0.00113 0.00163 -0.0942 -0.924
4-fold MD 0.0182 0.0282 -0.104 -1.31 0.0246
NS 0.0173 0.0225 -0.0706 -0.847
SI MD 0.0208 0.0298 -0.0924 -0.785 0.0194
NS 0.0195 0.0248 -0.0591 -0.509
NOTE.—All statistics were calculated per gene, and the means are presented here. aChromosome.
bPopulation sample: MD – Madagascar; NS – Kenya.
cAverage number of pairwise differences per site between lines.
dWatterson’s estimator of, the scaled mutation rate. eSeeeq. (1).
fTajima’sD.
g0-fold degenerate sites.
h4-fold degenerate sites.
iSites 8–30 bp of introns<66 bp in length.
suggests a GC bias (2= 19.7, df = 1,P= 0.01), but both SBR and AWP provide some support for a slight AT bias (SBR: 2= 3.73, df = 1, P= 0.05; AWP: 2= 5.55, df = 1,
P= 0.019) (table 2). This may reflect the tendency for parsi-mony to overestimate changes from common to rare base-pairs (Collins et al. 1994;Eyre-Walker 1998;Akashi et al. 2007;Matsumoto et al. 2015).
Variation in 4-Fold Site Substitution Patterns across Regions with Different GC Content
Under strict neutrality, the substitution rate per site is equal to the mutation rate per site (Kimura 1983). Thus, if 4-fold de-generate sites have never been affected by selection on CUB and/or gBGC, the two substitution rates per site,rW!S and
rS!W, should be uniform across the GC bins, unless there are systematic differences in mutation rates across bins. However, as can be seen fromfigure 1, in both species, on both the autosomes and the X chromosome,rW!S is positively corre-lated with GC content (D. simulans, autosomes: Kendall’s
= 0.45, P= 0.006; D. melanogaster, autosomes: = 0.53,
P= 0.001). Here and in what follows, we refrain from con-ducting formal correlation tests of the X-linked data due to the dearth of data points; in addition, data from the SI bins are not included in correlations. In contrast, rS!W shows a clearly negative relationship with GC content (Kendall’s=0.95,
P<0.001 and =0.96, P<0.001 for D. simulans and
D. melanogaster autosomes, respectively). These patterns are expected if GC alleles (i.e., preferred codons) were favored over AT alleles (i.e., unpreferred codons) for a substantial amount of time along these two lineages, and the intensity of the GC-favoring force increases with GC content (see the Discussion for an explicit model). Also of note is the marked increase inrS!W relative torW!S with GC content in theD.
melanogasterlineage, which is suggestive of mutations be-coming more AT-biased. However, the arguments set out in
the Discussion suggest that a change in mutational bias alone is unlikely to explain the data reported here.
As stated before, theNW!S=NS!W ratio at SI sites, parti-cularly inD. simulans, is close to unity, the value expected under equilibrium base composition. An investigation across the 4-fold site GC content bins suggests that all of the bins considered here are experiencing some level of AT fixation bias ðNW!S=NS!W<1Þ, and that genomic regions with higher GC contents are evolving towards AT faster than re-gions with lower GC contents. This is clear from the negative correlations between GC content and the level of substitution biasðNW!S=NS!WÞcalculated per 4-fold site bin in both spe-cies (Kendall’s=0.96,P<0.001 and=0.91,P<0.001 forD. simulansandD. melanogasterautosomes, respectively) (fig. 2). As explained in the Discussion, this negative correla-tion can readily be explained by a genome-wide reduccorrela-tion in the intensity of the GC-favoring force.
DAF at 4-Fold Sites Provide Clear Evidence of Ongoing Selection for Preferred Codons
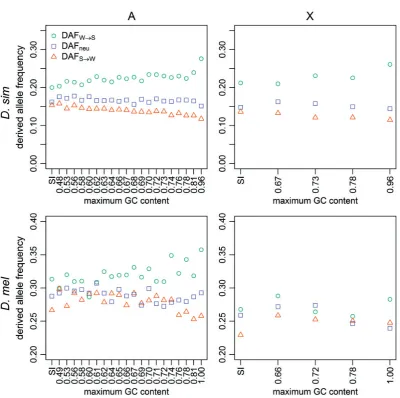
If selection/gBGC favors GC alleles over AT alleles, then the frequencies of derived GC alleles at AT/GC polymorphic sites (DAFW!S) should on average be higher than the frequencies of derived AT alleles at AT/GC polymorphic sites (DAFS!W). Furthermore,DAFW!S should increase as the GC-favoring force becomes stronger (i.e., as 4-fold site GC content in-creases), whereasDAFS!W should decrease with increasing GC content. In addition, we expectDAFneu, the DAF for pu-tatively neutral changes (i.e., segregating sites that had mu-tated from A to T, or vice versa, and from G to C or vice versa), to lie in a position intermediate between DAFS!W and
[image:9.595.51.546.111.233.2]DAFW!S (i.e., DAFW!S>DAFneu>DAFS!W). In contrast, in a neutral model with a recent increase in mutational bias towards AT, the higher number of derived AT mutations en-tering the population, which tend to be young and segregate at low frequencies, will depress DAFS!W, leading to
Table 2
Counts of Substitutions along theDrosophila melanogasterandD. simulansLineages at 4-Fold Degenerate and SI Sites
D. simulans D. melanogaster
A X A X
Sitea Polarization Methodb AT
!GC GC!AT AT!GC GC!AT AT!GC GC!AT AT!GC GC!AT
4-fold Parsimony 13607 25656 1962 3934 10588 40586 1140 7395
SBR 14085 30524 2116 4528 11285 47894 1258 8670
AWP 15219 30945 2450 4639 12399 48264 1425 8611
SI Parsimony 1859 1598 206 152 1570 1884 131 229
SBR 1930 2052 231 183 1658 2417 146 271
AWP 2006 2158 217 206 1718 2506 141 303
a4-fold – 4-fold degenerate sites; SI – Sites 8–30 bp of introns<66 bp in length.
bThe ancestral state at themelanogaster-simulansnode was determined using three methods: parsimony, the SBR under the GTR-NH
bmodel implemented in PAML, and the average weighted by posterior probability (AWP) under the GTR-NHbmodel implemented in PAML.
DAFW!S>DAFS!W, but DAFneu should be comparable to
DAFW!S. Moreover, GC content and DAFW!S should be unrelated under this model.
D. simulans fits the expectations of the first model:
DAFW!S is greater than DAFS!W in all autosomal and X-linked 4-fold bins, andDAFneuis always intermediate between
DAFW!SandDAFS!W(fig. 3). Autosomal 4-fold siteDAFW!S correlates positively with GC content (Kendall’s = 0.6,
P<0.001;fig. 3), and autosomal 4-fold siteDAFS!W corre-lates negatively with GC content (Kendall’s =0.85,
P<0.001; fig. 3); data from the X display similar trends. These patterns suggest the action of forces favoring GC over AT alleles in the recent past in this species (a time period of the order of 4Negenerations), with higher GC con-tent bins experiencing a higher strength of recent selection favoring GC.
InD. melanogaster, the equivalent results are less clear. AutosomalDAFW!S is higher than autosomal DAFS!W for 19/20 4-fold bins (fig. 3). As inD. simulans, autosomal 4-fold
DAFW!S correlates positively with GC content (Kendall’s
= 0.41,P= 0.01;fig. 3), and autosomal 4-foldDAFS!W cor-relates negatively with GC content (Kendall’s =0.47,
P= 0.004; fig. 3). DAFneu falls between DAFW!S and
DAFS!W in 14/20 autosomal 4-fold site bins, but only 1/4 X-linked 4-fold bins (fig. 3). Additionally, the difference be-tweenDAFW!SandDAFS!W seems less pronounced than in
D. simulans, especially on the X chromosome, although on the autosomes the gap between DAFW!S and DAFS!W does tend to increase with GC content and is the largest and most comparable in magnitude to those seen inD. simulans
in the bins with the highest GC content. Overall, these data provide some evidence of recent selection for GC at 4-fold
FIG. 1.—Substitution rates. The results are shown for positions 8–30 bp of introns<66-bp long (SI sites; leftmost points), and 4-fold degenerate sites (remaining points), binned according to the GC content of the extantD. melanogasterreference sequence. Rates were calculated for theD. simulanslineage (top row) and theD. melanogasterlineage (bottom row), for autosomes (left-hand column) and X-linked sites (right-hand column). Teal circles: AT!GC substitutions; orange triangles: GC!AT substitutions.
sites inD. melanogaster, but its extent seems to be smaller than inD. simulans, and may be restricted to autosomal re-gions with high GC contents.
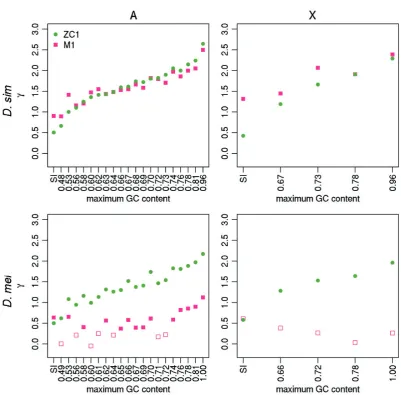
Estimating and Other Parameters Using 4-Fold Site Polymorphism Data
To shed further light on the evolutionary dynamics of selection on CUB, we used two different methods for inferring the scaled strength of selection for GC alleles (¼4Nes) from polymorphism data. First, we applied the method ofGle´min et al. (2015), which detects recent selection (timescale ~4Ne generations). We refer to the different variants of this method using the same notation asGle´min et al. (2015). These are model M0, where¼0 and polarization errors (with respect to inferring ancestral vs. derived alleles) are not taken into
account; M1, where 6¼0 and polarization errors are not taken into account; and M0* and M1*, which are the equiv-alent models after correcting for polarization errors. Second, we used the method ofZeng and Charlesworth (2009), mod-ified as described byEvans et al. (2014), which provides esti-mates over a longer period. We used two variants of this method, which are referred to as ZC0 (¼0) and ZC1 (6¼0).
For everyD. simulansbin on both the A and X, both ZC1 and M1 fit the data significantly better than the corresponding models with¼0 (i.e., ZC0 and M0; min2= 17.84, df = 1,
P<0.001); the only exception is the X-linked SI bin where M1 does not fit the data better than M0 (2= 0.071, df = 1,
P= 0.79) (fig. 4). Estimates obtained by ZC1 and M1 agree closely for the D. simulans data (fig. 4; Wilcoxon paired
FIG. 2.—The ratios of substitution counts. The results are shown for positions 8–30 bp of introns<66-bp long (SI sites; leftmost point), and 4-fold degenerate sites (remaining points), binned as described infigure 1. A substitution count ratio ofNW!S=NS!W¼1 implies equilibrium base composition. Ratios were calculated for theD. simulanslineage (top row) and theD. melanogasterlineage (bottom row), for autosomes (left-hand column) and X (right-hand column).
signed-rank test,P= 0.25). The agreement between the re-sults from the two methods, which are expected to be sensi-tive to forces favoring GC on different timescales (see Material and Methods), suggests consistent selection over time favor-ing GC alleles at 4-fold degenerate sites in D. simulans. In addition, GC content correlates positively with on both the autosomes (Kendall’s = 0.98, P<0.001; = 0.88,
P<0.001 for ZC1 and M1, respectively) and the X chromo-some. Thus, in agreement with the results obtained from the divergence- and DAF-based analyses, selection for GC is indeed stronger in regions with higher GC content. The patterns obtained from comparing M0* and M1* are quali-tatively identical (supplementary fig. S2, Supplementary Material online). In addition, when using the Akaike Information Criterion (AIC) to rank the four Gle´min models
(this is necessary because, e.g., M0* and M1 are not nested and cannot be compared using the likelihood ratio test), M1 and M1* are always the two best fitting models for all bins across both chromosome sets, except for the SI bin on the X (supplementary table S3,Supplementary Materialonline).
Similarly to the analysis based on DAFs, the patterns are less clear-cut inD. melanogaster. When M1 and M0 are compared, 13/20 autosomal 4-fold site bins are found to be non-neutrally evolving, including the four highest au-tosomal GC bins, and none on the X (fig. 4). In contrast, according to the comparison between M1* and M0*, only 3 autosomal bins show evidence of nonzero in
D. melanogaster (2/20 autosomal 4-fold site bins and the autosomal SI bin), and none of the X-linked bins do so (supplementary fig. S2, Supplementary Material FIG. 3.—DAF. Mean DAFs are shown for positions 8–30 bp of introns<66-bp long (SI sites; leftmost points), and 4-fold degenerate sites (remaining points), binned as described infigure 1. Mean DAFs were calculated using the MD sample ofD. simulans(top row) and the RG sample ofD. melanogaster
(bottom row), for autosomes (left-hand column) and X-linked sites (right-hand column). Teal circles: AT!GC mutations; orange triangles: GC!AT mutations; lilac squares: AT!AT mutations or GC!GC mutations.
[image:12.595.100.501.77.475.2]online). In particular, the fact that none of the high GC bins have a significant test is out of keeping with the ob-servation that these bins have large differences between
DAFW!S and DAFS!W. A close inspection suggests that statistical power may be an issue: there are on average four times fewer SNPs in the 4-fold site bins inD. melano-gaster, and in the highest 4-fold site bin, there were only 69 W!S SNPs. As described in the Materials and Methods, the Gle´min models are parameter rich, espe-cially M0* and M1*. In fact, M1* often came out (e.g., in 10/20 autosomal 4-fold site bins) as the worse fitting one among the four models according to the AIC.
To deal with this issue, we redid the comparison by reduc-ing the number of autosomal 4-fold bins to 10. M1 fits better than M0 in 9/10 bins, while M1* fits better than M0* in 4/10 bins, including two out of the top four GC bins ( supplemen-tary fig. S3,Supplementary Materialonline). According to the AIC, the frequency of M1 being the best fitting model in-creases to 9/10 bins, whereas the frequency of M1* being the worse fitting model decreases to 2/10 bins (supplementary table S3, Supplementary Material online). The observation that M1* sometimes ranked lower than M1 according to the AIC in both species may also be due to the fact that our method for correcting for nonequilibrium when
FIG. 4.—The estimated strength of selection favoring GC alleles. The estimates of the strength of selection in favor of GC alleles (¼4Nes) are shown for positions 8–30 bp of introns<66-bp long (SI sites; leftmost points), and 4-fold degenerate sites (remaining points), binned as described infigure 1.was estimated using the MD sample ofD. simulans(top row) and the RG sample ofD. melanogaster(bottom row), for autosomes (left-hand column) and X-linked sites (right-hand column). Two methods were used: the method ofZeng and Charlesworth (2009)with a one-step size in population size (ZC in the main text) – green circles; and the method ofGle´min et al. (2015), not incorporating polarization errors (M1 in the main text)—pink squares. Filled points: bins where a model with6¼0 fitted best; open points: bins where a model with¼0 fitted best.
[image:13.595.98.500.78.473.2]reconstructing ancestral states has reduced the need to cor-rect for polarization errors.
As is apparent fromfigure 4, M1 also estimates consistently lower absolute values of than ZC1 in D. melanogaster
(Wilcoxon paired signed-rank test, P= 1.9 106 ). Given that the ZC method returns long-term average estimates of
, these differences clearly indicate a recent decline in the strength of selection on CUB in this species. As withD. simu-lans, however, autosomal GC content correlates positively with under both models (Kendall’s = 0.87, P<0.001;
= 0.48, P= 0.003 for ZC and M1, respectively; fig. 4), which is suggestive of some, if weak, ongoing selection for GC at autosomal 4-fold sites, particularly in GC-rich regions of the genome. The fact that the SFS is more negatively skewed at 4-fold sites in regions of higher GC content in both species, as measured by (supplementary fig. S4,Supplementary
Materialonline), is also consistent with selection on these sites. In addition to, the two methods also produced estimates of other parameters of interest. For instance, both methods can estimate, the mutational bias parameter, defined asu/v
whereuis the mutation rate fromStoWper site per gener-ation, andv is that in the opposite direction. As shown in
supplementary fig. S12, Supplementary Material online, in
D. simulans,is close to 2 across the 4-fold site bins, similar to previous estimates obtained by different methods (Singh et al. 2005;Keightley et al. 2009;Zeng 2010;Schrider et al. 2013). The fact thatis estimated to be similar across the bins suggests that the difference in 4-fold sites’ GC content can be attributed to stronger selection, not to differences in muta-tional bias. InD. melanogaster, the difference in the estimates between the two methods is much more pronounced, with
from the Gle´min method (short timescale) being consistently higher than those estimated by the ZC method (long time-scale), probably reflecting a recent increase in the mutation rate towards A/T nucleotides (see Discussion).
Consistent with the apparently negative Tajima’sDvalues calculated using 4-fold sites inD. simulans(table 1), the ZC method detected clear evidence for recent population expan-sion in all bins (P<1016
for all bins;supplementary table S4,
Supplementary Materialonline), whereas forD. melanogaster, no clear evidence for recent population expansion was found, which is consistent with the observed data (e.g., Tajima’sDis only 0.11 for A in D. melanogaster, but is 1.03 in D. simulans) and our previous analysis based on a different data set (Zeng and Charlesworth 2009). In supplementary text S2,Supplementary Materialonline (see also supplemen-tary tables S5 and S6, Supplementary Material online), we present a more detailed description of estimation of the de-mographic parameters inD. melanogaster, and the statistical and computational issues we encountered. We also provide evidence that our conclusion of a continuing decline in selec-tion intensity inD. melanogasteris robust to these potential issues (supplementary fig. S13, Supplementary Material
online).
A More Detailed Analysis of the SI
The SI data shown infigures 3 and 4suggest that GC may be favored over AT in SI. Given the apparent lack of selective constraints on SI sites (Halligan and Keightley 2006; Parsch et al. 2010), this is suggestive of the action of gBGC. In con-trast to selection on CUB at 4-fold sites, all alleles have equal fitness under the gBGC model, and the selection-like pattern is created by the preferential transmission of theSallele inSW
heterozygotes to the next generation (Duret and Galtier 2009). The S!S and W!W mutations are “neutral” in the sense that they should be unaffected by gBGC. To gain further insights, we carried out additional analyses by binning the SI data according to their GC content, and asked whether gBGC could be responsible for the observed patterns. Constrained by the limited amount of data and the parame-ter-richness of some of the models, we only carried out these analyses using the autosomal SI data, divided into five bins. These data were then examined in the same way as the 4-fold sites. However, with such a small number of bins, the corre-lation-based analysis is likely to be prone to statistical noise; the results should thus be treated with caution.
As shown infigure 5AandE,rS!W decreases as GC con-tent increases in both species (Kendall’s =1, P= 0.03), which may reflect an ancestral reduction in the strength of the force favoring G/C nucleotides (see Discussion). However,
rW!Sis not significantly correlated with GC content in either species (Kendall’s=0.8,P= 0.09, inD. simulans; Kendall’s
= 0.8,P= 0.09, inD. melanogaster). ComparingNW!Sand
NS!W across bins using a 25 contingency table test sug-gests that the substitution pattern is heterogeneous across the bins in both species (P<2.2 1016
in D. simulans and
P= 2.04108inD. melanogaster). TheN
W!S/NS!W ratio decreases with increasing GC content inD. simulans(Kendall’s
=1,P= 0.03;fig. 5B), qualitatively similar to what we re-ported above for the 4-fold sites in this species (fig. 2). However, this ratio shows no significant correlation with GC content inD. melanogaster (Kendall’s= 0.8, P= 0.09; fig. 5F). These results highlight the difficulty in conducting detailed analyses in the SI regions, due to insufficient data. Nevertheless, they provide evidence for variation between dif-ferent SI regions.
We did not detect any statistically significant correlation between the three types of DAFs and GC content inD. simu-lans(fig. 5C, minimumP= 0.22 for the three tests), although the relationship DAFS!W<DAFneu<DAFW!S holds in all bins. The lack of strong support for a relationship with GC content was also reflected when the Kruskal–Wallis test was used to test for heterogeneity in median DAFs across bins; the
p-values forS!W, neutral, andW!Sare 0.38, 0.20 and 0.04, respectively. InD. melanogaster(fig. 5G),DAFS!W is significantly negatively correlated with GC content (Kendall’s
=1,P= 0.03), but no relationship was found for the other two DAFs (minimumP= 0.22). In the three bins with higher
GC content, we haveDAFS!W<DAFneu<DAFW!S. But the order is completely reversed in the lowest GC content bin, although the differences between the DAFs are nonsignificant based on the Gle´min model (see below). Consistent with this, the Kruskal–Wallis test detected significant heterogeneity in median DAF across bins in the DAFS!W case (P= 1.40 108
), but not in the other two cases (P>0.08).
Finally, we used polymorphism data to estimate the strength of the force favoring GC, as measured by. In line with the DAF-based analysis, in neitherD. simulans(Kendall’s
= 0,P= 1; fig. 5D) norD. melanogaster (Kendall’s= 0.8,
P= 0.09; fig. 5H) did we find a significant relationship be-tween GC content and as estimated by the M1 model of Gle´min et al. (2015). InD. simulans, M1 fits the data signifi-cantly better than M0 in all five bins, whereas inD. melano-gaster, the neutral model M0 is sufficient to explain the data for the first two bins, with the M1 model being more ade-quate for data collected from the more GC-rich bins. Estimates of produced by the ZC1 method are positively correlated with GC content in both species (Kendall’s= 1,
P= 0.03;fig. 5DandH). Interestingly, ZC1 fits the data signif-icantly better than ZC0 in all cases, even in bins where is
fairly close to zero. A close inspection suggests that this is not due to poor convergence in the search algorithm. Furthermore, simulations have shown that the ZC model is very robust to linkage between sites and demographic changes (Zeng and Charlesworth 2010b), suggesting that these results are unlikely to be methodological artefacts, and may reflect long-term dynamics in these regions. Finally, in
D. melanogaster, there is no clear evidence that the estimates of long-term derived from ZC1 are higher than estimates of short-termderived from M1 (fig. 5H).
Discussion
Evidence for Past Selection on CUB in Both
DrosophilaSpecies
The correlations between the substitution rates and GC content at 4-fold sites presented infigure 1and supple-mentary fig. S5, Supplementary Material online can be explored using the following modelling framework (Li 1987; Bulmer 1991; McVean and Charlesworth 1999), which assumes a fixed Ne and thus a fixed value of
FIG. 5.—Results for autosomal SI sites binned by GC content. Top row: data from the MD sample ofD. simulans; bottom row: data from the RG sample
ofD. melanogaster.AandE: substitution rates for AT!GC substitutions (teal circles) and GC!AT substitutions (orange triangles).BandF: the ratio of substitution counts along each lineage.CandG: DAF for AT!GC mutations (teal circles); GC!AT mutations (orange triangles); AT!AT mutations or GC!GC mutations (lilac squares). AT!AT and GC!GC mutations were labelled as neutral to signify that they should be unaffected by gBGC.DandH: estimated values of the magnitude of selection in favor of GC alleles (¼4Nes). Two methods were used: the method ofZeng and Charlesworth (2009)
with a one-step size in population size (ZC in the main text)—green circles; and the method ofGle´min et al. (2015), not incorporating polarization errors (M1 in the main text)—pink squares. Filled points: bins where a model with6¼0 fitted best; open points: bins where a model with¼0 fitted best. All analyses that required reconstruction of the ancestral state at themsnode used the AWP method, as described in the main text.
for each GC bin. If there are temporal changes along a lineage, we can regard these parameters as long-term averages. Let u be the mutation rate from S!W per site per generation; and v be that in the opposite direc-tion. Define as u=v. The two substitution rates, rS!W and rW!S, are proportional to u=½expð Þ 1 and
v=½1expðÞ, respectively (e.g., Eq. B6.4.2b of Charlesworth and Charlesworth (2010); Eq. 11 of Sawyer and Hartl (1992); Akashi et al. 2007). We can then define
R¼rS!W rW!S
¼1e
e1 ¼e
ð2Þ
Assuming that uand v are constant across the GC bins and over time (is thus also constant),Ris a function of
. Taking the derivative with respect to, we have
dR d¼ e
ð3Þ
In other words, R¼ when ¼0 (neutrality), and de-creases as becomes positive (i.e., when W is selected against). Thus, the decreasing values ofRshown infigure 1 and supplementary fig. S5, Supplementary Material
online suggest thatS is more strongly favoured in high GC bins. For instance, the R values for the lowest and highest autosomal 4-fold site bins inD. simulansare 1.51 and 0.56, respectively. If the SI sites are neutral (see below), can be estimated by the R value from the SI bin, which is 1.93, very close to the value of 2 reported previously (Singh et al. 2005;Keightley et al. 2009;Zeng 2010; Schrider et al. 2013), solving eq. (2) for gives values of 0.25 and 1.24 for the lowest and highest bins, respectively. These rough, long-term estimates are about 2-fold lower than those obtained from the poly-morphism data (fig. 4). It is possible thatD. simulanshas a larger recent Ne (reflected in the polymorphism-based analysis) than the average Ne along the entire lineage, which is consistent with the evidence for population expansion from the negative Tajima’sD values (table 1). Finally, as detailed in the supplementary text S1,
Supplementary Material online, this model can also ex-plain why the slope forrS!W is apparently steeper than that forrW!S (fig. 1).
The above model can also explain why, at 4-fold sites,
RN¼NW!S=NS!W<1 and there is a negative relationship betweenRNand GC content (fig. 2), whereNW!SandNS!W are the numbers of substitutions between theSandWalleles along the lineage of interest. Note first thatNS!WandNW!S are, respectively, proportional to Qu=½expð Þ 1 and
1Q
ð Þv=½1expðÞ, where Q is the GC content at themsnode (sinceQ changes very slowly, this should be a reasonable first approximation). At equilibrium, Q¼1=
1þexpðÞ
½ (Li 1987; Bulmer 1991) and hence
NW!S=NS!W ¼1. Consider a model where the ancestral
species was at equilibrium, but is reduced to p
0p<1
ð Þalong a lineage that leads to an extant species, so thatNS!Wand NW!S become proportional to Qup=
expðpÞ 1
½ and ð1QÞvp=½1expðpÞ, respec-tively. Then,RN for the GC content bin in question can be written as
RN¼
NW!S
NS!W
¼ð1QÞðe
p1Þ
Qð1epÞ ¼e
ð1pÞ ð4Þ
Assuming that p is constant across bins (i.e., there has been a genome-wide proportional reduction in), then
RNdecreases asincreases. This, together with the argu-ments presented above that the long-term average is higher in high GC bins,eq. (4)implies that the negative relationship betweenRNand GC content is consistent with a genome-wide reduction in the intensity of selection in both species (see alsoAkashi et al. 2007).
In contrast, if we assume that¼0 andis constant across the bins (i.e., there has been no selection along both theD. melanogasterandD. simulans lineages), the fact thatR¼means that a genome-wide increase in
(i.e., a more AT-biased mutation pattern) would not cause a negative relationship betweenRand GC content. If the relationship betweenRand GC content were entirely mu-tational in origin, then u must decrease as GC content increases, whereas v changes in the opposite direction (fig. 1). Such a model is incompatible with the evidence for selection from the two polymorphism-based methods (fig. 4), and cannot easily explain the well-known positive correlation between GC content of CDSs (or the extent of CUB) and gene expression levels (e.g., Campos et al. 2013), especially when considering the lack of support for transcription-coupled mutational repair inDrosophila
(Singh et al. 2005;Keightley et al. 2009).
As shown in supplementary fig. S12, Supplementary Material online, the Gle´min method (short timescale) and the ZC method (long timescale) returned estimates that are more comparable inD. simulansthan inD. melanogaster; the ZC method produced consistently lower estimates inD. simulansand consistently higher estimates inD. melanogaster
(two-sided binomial test, P= 1.91 106
in both cases). Taken at face value, these results suggest that there probably has been relatively little change in the extent of mutational bias in theD. simulanslineage, whereas mutation may have become more AT-biased inD. melanogaster. These results suggest that the patterns shown infigure 2 are probably a result of an ancestral reduction in the efficiency of selection in
D. simulans. ForD. melanogaster, it is possible that a more AT-biased mutational pattern has also contributed to the evolu-tion of base composievolu-tion in its genome, as suggested by pre-vious studies (Takano-Shimizu 2001;Kern and Begun 2005; Nielsen et al. 2007;Zeng and Charlesworth 2010a;Clemente and Vogl 2012b).