1
Efficiency measurement for management
Alec Morton, Strathclyde Business School, University of Strathclyde1 Laura Schang, Munich School of Management, Ludwig-Maximilians-Universität2 1. Introduction
The previous chapter has discussed the use of efficiency analysis tools to guide policy development and formulation. While few readers will doubt that clear, consistent policy direction is necessary for the delivery of productivity improvements, it is not sufficient. To lead to action on the ground, policy interventions have to influence the behaviour of the staff who see and treat patients, and deliver public health and social care programmes. In this chapter, we discuss the challenges facing management as it seeks to use the analytic tools discussed elsewhere in this volume to secure efficiency improvements.
It should be emphasised the environment of the working manager is very different from the environment of the policy maker, and even more so that of the academic researcher (Mintzberg, 1976). Unlike academic researchers (at least those unburdened with management responsibilities), managers in general and in the health service in particular, typically describe a significant part of their time as being occupied with responding to sporadic, unanticipated and urgent problems, and filtering information, either through attending mostly irrelevant meetings or scrolling through a seemingly endless flow of emails so as to head off incipient crises. Unlike policy makers, managers have relatively limited and weak levers for driving and securing change (e.g. they have to operate within the existing financial settlement, with institutions and staff facing incentives designed into their existing mandates and terms of employment). Moreover, the elevated social status of medical professionals means that healthcare managers have more circumscribed authority than managers in most other industries.
In short, with very limited time and capacity, managers have to make decisions about what evidence (if any) they look at and believe, what expertise they draw on, and how they search for solutions and present them in a persuasive way. Efficiency analysis tools can have a role in this process if they are able to provide a plausible framework for interpretation, and can form an element in articulating the case for change. For example, several authors have noted that frontier based methods (DEA and SFA) despite their popularity in academic circles, have received much less attention in the practitioner world, where the most popular efficiency analysis tools are episode and population costing systems (Hollingsworth and Street, 2006; Hussey et al, 2009). It is plausible that what academics see as a strength of DEA, that it aggregates multiple inputs and outputs in a single efficiency measure, is, from a managerial point of view, a weakness, as it distracts attention from the question of where the problems actually lie, and where one should search for ideas for improvement.
1
2
In the first part of the chapter we present two frameworks which can help us understand how managers might think about evidence and solutions to efficiency problems in different settings. Our first framework, Cynefin, is borrowed from knowledge management, and provides a perspective on the role of evidence in efficiency analysis; the second, grid-group theory, is drawn from the sociology of risk, and provides a perspective on the role of culture and ideology in the search for solutions. In the second part of the chapter we will discuss how efficiency analysis can support three key tasks for managing the system. We structure our discussion roughly using the classical Simonian tripartite classification of the stages of decision (Simon, 1977): intelligence, the stage in which one establishes that one has a problem; design, the stage in which one develops alternative solutions; and choice, the stage at which on decides what solution to implement. We review managerial tools which are available to support each of these activities and reflect on what the Cynefin and grid-group frameworks can tell us about how they are to be used.
2. Who are managers ?
In the general management literature, there have been several attempts to define “management”, from Henri Fayol’s description of management as involving planning, organising, commanding, coordinating and controlling, through Mintzberg’s analysis of the interpersonal, information, and decisional components of the manager’s job, to Stewart’s framework which involves looking at the managerial role in terms of its demands, its constraints and the choices which it affords (Wren,2005). From a healthcare point of view, these definitions highlight that managers are typically not involved in primary production, ie treating and caring for the sick. For this reason, managers can be controversial figures in healthcare systems: in the UK, governments regularly launch rhetorical attacks on “bureaucrats”, while lauding “frontline professionals”, even as they create new regulatory responsibilities and structures.
Even though healthcare managers do not enjoy the same generally positive public image as others in the medical workforce, they are present in all systems and recent evidence suggests that the quality of management is an important driver of system performance (Dorgan et al., 2010). Managers operate in different contexts and institutions, including purchasing organisations (e.g. regional healthcare authorities, sickness funds) or provider organisations (e.g. hospitals, physician networks). While the specific tasks will differ between contexts, we take the view that management is essentially about making decisions within the scope and remit which the manager enjoys through his position in the system hierarchy (Simon, 1977). Decision-making is, clearly, a process that is not exclusive to management. However, it is fundamental to any managerial role and independent of the context in which managers operate and so provides a useful frame which is independent of the specifics of any given managerial role (e.g. whether the manager is working in a hospital or in a purchasing organisation). In this chapter, we follow Herbert Simon’s (1977) famous model which distinguishes between three roles in the managerial decision-making process: intelligence, design, and choice.
3
straightforward, compared to the case of simpler production facilities (Morton and Cornwell, 2009). This observation will be a theme of this chapter (of course we do not mean to suggest that it is not worthwhile improving the quality and availability of data, merely to observe that no database will ever be sufficiently comprehensive to settle all possible management-related questions decisively). It is important to realise that managers have a different, and specifically a narrower, view of efficiency than policy makers. For both managers and policy makers, efficiency involves balancing inputs and outputs, but managers operate in a much more constrained environment. The manager of a hospital or insurer has virtually no ability to control demand (typically the service is free at the point delivery, or user fees are heavily regulated), certainly in the short term; the technologies and services to be offered may be mandated by a centralised health technology assessment agency; the staffing levels may determined by an external professional body; payrates may be determined nationally through collective bargaining; a unionised and professional production staff may be extremely effective in resisting efforts to change work practices. In a system where there is an institutional separation between purchasers and providers, managers on the purchasing side may seek to extract efficiencies by “shopping around” but this is only possible where there is real variety in the provider market. Considering all these constraints, it is remarkable that managers are able to find sufficient space for action to positively influence the delivery of services.
3. Frameworks for analysis
In this section, we present two frameworks which we will use in our subsequent discussion: the Cynefin framework from the area of knowledge management, and grid-group theory from the sociology of risk.
3.1 Cynefin
The Cynefin framework of Kurtz and Snowden (2003) - Cynefin (from a Welsh word roughly meaning “habitat”) - is framework for sensemaking rooted in the field of knowledge management and can help to illustrate the challenges managers face in translating information into action. The Cynefin framework seeks to classify particular domains of action in terms of the possibilities for knowledge which that domain affords: as such it is particularly useful for clarifying what sort of guidance evidence can and cannot provide, and hence, how and when one might want to engage with experts. Central to Cynefin as a framework are four domains:
The known domain in which cause and effect are understood, solid and unquestioned evidence exists and predictive modelling is possible;
The knowable domain in which cause and effect relationships exist but are not known, or not known widely. Knowledge could in principle be acquired in this domain but it would be costly and difficult to do so;
The complex domain in which events are one-off and causes and effects can be discerned retrospectively;
The chaotic domain in which causal mechanisms are unclear, even after the event
4
communication with providers who provide follow-up care are optimised. As one moves out of the known region, professional judgement becomes more important. In the knowable domain what constitutes good practice is more contested, and so more room has to be made for local knowledge: identifying the causes of elevated readmission rates may require investigating practices in the community outset the formal healthcare system), arguing that this makes more sense for particular patients. In the complex domain, attempts to manage by compliance with standards are often experienced by those on the ground not only as constraining professional practice, but as part of a preemptive blame-shifting exercise in anticipation of things going wrong, which, inevitably, happens quite often – hence Munro’s (2011) call for a child protection system “which values professional expertise” (p7). Lastly, in the chaotic domain, even the experts do not know what is going on. Prescribing generic antibiotics on a precautionary basis in an environment where access to testing facilities is limited and costly may seem to make sense on cost-effectiveness grounds – but it is precisely such actions which create drug resistant pathogens which in turn generate massive new illness and cost (Laxminarayan et al, 2013). Where there is the possibility of chaotic behaviour, managers have to recognise that the problem is beyond their responsibility and outside help (fundamental scientific expertise, policy intervention) needs to be called on. Ultimately such problems have to be tackled at a higher system level, but where the higher levels of this system fail to take appropriate action, it will be left to managers on the ground to pick up the pieces.
3.2 Grid-group theory
Grid-group theory, a model of culture popular in the sociology of risk (Thompson et al, 1990), can be applied to health services to gain further insights as to how manager’s individual views of the way in which the health system works and their place within it. It is useful because it provides a frame for explaining the sort of ideology which people use when conceptualising solutions to efficiency problems. Grid-group theory is based on a 2x2 classification system: the two dimensions are the extent to which an individual identifies with a larger social unit (“group”) and the extent to which individual choice is experienced as being constrained by external forces (“grid”).
Individuals inhabiting each of the four cells of the matrix are referred to as:
Individualists (low grid, low group). People in this cell view do not identify strongly with larger groups and reject external constraints. They see relationships as expedient and subject to negotiation. Their natural form of social organisation is the market.
Egalitarians (low grid, high group). People in this cell identify strongly with others but reject external constraints. They view relationships as intrinsically important but reject status distinctions. Their natural form of social organisation is the commune.
Hierarchists (high grid, high group). People in this cell identify strongly with others and accept external constraints. They view both relationships and social roles as important. Their natural form of social organisation is the bureaucracy.
Fatalists (high grid, low group). People in this cell experience social constraints but do not identify with larger groups. For them, the world is arbitrary and relationships are problematic and frustrating. Their natural form of social organisation is the prison.
5
What sort of solutions might first come to mind to the responsible manager? The individualist’s preferred solution is to actively use performance incentive payments to increase surgical throughput: if that doesn’t work he will outsource diagnostics. Such solutions require the ability to benchmark externally – to know whether incentive payments will increase output or whether outsourcing will improve results, it would be helpful to know what the performance of other comparable institutions is. The egalitarian wonders why so many patients show up in such poor shape and have such weak support networks that they often have to be readmitted shortly after discharge. She advocates an asset-based approach to build individual and community capacity, and thus to manage demand. This line of reasoning leads one to require broader information about the patient journey between different care providers, and thus the ability to link data across multiple care encounters. The hierarchist just wants to make sure that everyone is doing their job and following best practice. He carefully studies the guidelines and launches a new round of clinical audit. This presupposes that good quality clinical guidance has been produced at the centre (and costed to ensure that it is actually deliverable). The fatalist responds by fiddling the figures, reasoning that this is what everyone else does anyway.
4. Managerial Roles for efficiency analysis in intelligence, design and choice
The following section considers the different roles managers need to adopt in order to ensure efficiency improvements, while also considering the tools available to assist them in these roles as well as the challenges they may face in implementing them. In the view of this chapter, management consists, essentially, of making decisions – depending on the context, these may be decisions about the structure of service delivery or about the allocation of healthcare staff, for instance. Following Herbert Simon (1977), managerial decision-making in a context of health system efficiency involves three fundamental roles: (1) the diagnosis of an efficiency problem; (2) the design of a solution; and (3) the choice of the appropriate response.
4.1. Intelligence: diagnosing the efficiency problem
Before thinking about solutions to efficiency problems, the logical first step is to diagnose where the problems lie – this is the intelligence phase. An ‘efficiency problem’ in managing health services could take two forms: perceived excessive costs for the observed level of output (or, conversely, perceived underproduction for a given level of spending); and a ‘wrong’ mix of outputs produced (reflecting problems of technical and allocative efficiency, respectively, see Chapter 1.2). From a managerial perspective, the promise of efficiency measurement lies in its potential to point towards areas of concern and thus enable further targeted analysis and action.
6
internal monitoring, the more able it will be to predict and respond to efficiency problems which are forced on it by external parties or events.
In this section we discuss what efficiency measures, such as variations in clinical practice and outcomes can support managers in identifying that they ‘have a problem’. In a systematic review of efficiency measures, Hussey et al. (2009) find that most measures that are actually used by health service managers consist of ratios, based on single metrics for inputs and outputs. An example of a ratio-based measure is severity-adjusted average length of hospital stay (the ratio of total days of hospital care to discharges, adjusted for patient severity). A popular approach to use such measures is to assemble them in dashboards. These business tools colour-code trends for instance in red (reflecting poor or worsening efficiency which requires priority attention), amber (reflecting poor or worsening efficiency which requires close monitoring) and green (reflecting adequate levels of efficiency). However, key challenges lie in the subjective choice about the level of efficiency that is interpreted as requiring immediate attention, as opposed to continued monitoring only.
Econometric or mathematical programming methodologies such as SFA and DEA, respectively, which have generated much academic research (Hollingsworth and Street, 2006) are hardly used by practising managers (Hussey et al., 2009). While these approaches allow for the analysis of multiple metrics of inputs, outputs, and explanatory variables, which are aggregated into a single number of system or organisational efficiency, they tend to require controversial methodological choices in particular about the sets of weights used to combine multiple metrics into a single composite measure (Goddard and Jacobs, 2009) As such composite metrics treat the health system as a “black box” and do not pinpoint the precise areas where targeted intervention is needed, they tend to have limited relevance for managers who must design and choose between specific actions to be taken. An emerging alternative to this, however, is the use of ratio-based efficiency analysis (REA; Salo and Punkka, 2009). Rather than forcedly assigning a single efficiency rank to each entity studied, this method enables the generation of ranking intervals and dominance relations. REA thus provides managers with a transparent indication of uncertainty about their organisation’s relative position and about the degree to which action is warranted (Schang et al., 2015).
In some health systems, applying external pressure for action to improve efficiency has been pursued in the form of public reporting of measures of efficiency. A pertinent example at the system level is the the analysis of geographic variations in health system performance, promoted especially by John Wennberg and colleagues in the U.S. and increasingly also by governments and academic institutions in several European countries including the UK, the Netherlands, Germany, Italy and Spain, as well as other OECD countries such as Australia, Canada and New Zealand.3 This research has shown persistent variations in health outcomes, activity and expenditure across geographic regions and healthcare providers {for a systematic review see \Corallo, 2014 #13514}. Many of the indicators used can be interpreted as partial measures of efficiency, as they focus, for instance, on rates of avoidable hospital admissions. The underlying rationale, from a health system efficiency perspective, is that resources are misallocated as patients consume expensive hospital care although high-quality primary care might have prevented the admission in the first place. When multiple measures of variation in cost and outcomes are put together, the analysis of variations can be
3
7
understood as a form of benchmarking {for an extended discussion of benchmarking in healthcare`, see \Neely, 2013 #13078}: if comparable regions seem to have better outcomes (lower costs) for a given level of spending (output), then there may be scope in the other regions to release resources to be invested in areas of higher-value care.
8
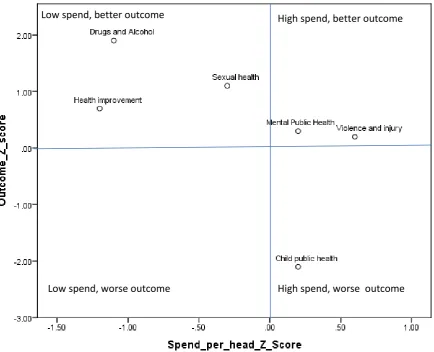
Figure 1. SPOT display for a fictional public health programme
In practice, however, many hurdles need to be overcome before such tools can be used by health service managers. Our evaluation of the NHS Atlas of Variation in England {Schang, 2014 #4436} highlighted the following practical challenges: (i) many managers were simply not aware of this information, despite it being distributed as a paper copy to all Chief Executives and Directors of Public Health; (ii) information was sometimes not accepted as valid due to known measurement and coding issues; (iii) there were doubts over perceived applicability of the data in providing a rounded picture of performance; (iv) some organisations were not able to use the information due to capacity constraints or because the next year’s priorities had already been agreed and contracts had already been signed when the data were published.
In terms of Cynefin, when thinking about the efficiency metrics available to managers, some information will fall into the known domain, such as cost-effectiveness evidence, where ‘good’ and ‘bad’ performance can be identified. However, most efficiency metrics fall within the knowable or complex domains. In these domains, performance indicators are likely to represent what Carter and al {, 1995 #213} termed ‘tin openers’ – in themselves inaccurate pictures of performance, but useful triggers for further investigation to clarify causes and consequences – rather than ‘dials’ – good measures that can be judged against normative standards. For instance, when comparing rates of hip replacement across regions, much more detailed analysis at provider and patient levels of
Low spend, worse outcome
Low spend, better outcome High spend, better outcome
9
analysis is required to examine to what extent higher rates of surgery reflect comparative inefficiency rather than valued activities justifiable by, say, higher levels of medical need or patient preferences. Diagnosing problems simply in terms of the empirical distribution of performance thus can be problematic – it ignores that ‘best’ performance is not always known or knowable, and that even organisations leading the top-end of the distribution may have substantial scope for improvement.
The grid-group framework can also provide a perspective on how different healthcare systems assign a different locus of ownership to managerial tools for problem diagnosis. For example, the English Atlas of Variation is clearly targeted at managers and clinicians within established organisations in charge of allocating resources for healthcare across sectors, thus reflecting a more hierarchist view of diagnosing problems and searching for solutions. In contrast, in Germany, in the absence of an institution with cross-sectorial responsibility for health system planning {Ettelt, 2012 #8119}, attempts to disseminate information on variations have taken a more individualist perspective by targeting patients and consumers of health services {Nolting, 2011 #652} with a view to empowering them to question advice given to them by medical professionals. However, for moving beyond problem diagnosis towards leading change, a stronger “group” element that involves coordinated action between different stakeholders may be helpful (see Box 1). {Nuti, 2014 #15367} Box 1. Managing system efficiency in Italian regions (Nuti and Seghieri. 2014).)
Years of experience in performance management at a regional level in Italy suggest that the strong focus on regular discussion between managers from different regions and academic researchers, combined with tangible incentives such as linking parts of Chief Executives’ remuneration to performance outcomes, were key elements in sustaining commitment to change. Starting in 2004, the Tuscany regional health authority entrusted the Laboratorio Management e Sanità of Scuola Superiore Sant’Anna (MeS Lab) to design a multi-dimensional performance evaluation system which includes indicators of both elements of the efficiency equation (outputs and financial sustainability). Indicators are selected through an interaction process between the MeS Lab research team and the regional representatives. To provide decision support for each healthcare provider, results are discussed in systematic and consensus-based meetings between top management and regional administrators every three months. Starting in 2006, performance results are also linked to the remuneration of chief executives. Combined with a the striking visual reporting system (the “target” diagram) which highlights multi-dimensional aspects of performance and the public disclosure of the performance results, the Tuscan system has been demonstrated to successfully improve overall regional performance and has been adapted to other Italian regions.
4.2. Design: Process improvement methodologies
10
Quality Management and the like are often promoted as providing guidance on how to reconfigure services to improve patient flow, and thus simultaneously reduce cost and drive up quality (Vissers and Beech, 2005; Ronen and Pliskin, 2006; Hopp and Lovejoy, 2013). A critical idea behind these improvement philosophies is to concentrate on optimising processes and flows of patients along these processes rather than optimising single isolated steps. For example, one operations management principle is to focus on the bottleneck activities in the process, as it is these which constrain throughput and driving waiting times – this is Change Number 8 of the Modernisation Agency’s (2004) “10 High Impact Changes”.
Several stories of the transformative power of these concepts exist – for example Bolton’s lean transformation of its trauma service (Fillingham, 2007) or the Glasgow Royal Infirmary’s reengineered fracture clinic (Vardy et al, 2013) – see Box 2 below for a description of the latter. The message which comes across clearly from these accounts, as well as the broader academic literature (Waring and Bishop, 2010, Radnor et al, 2012), is that these concepts, while potentially powerful, are not “plug and play” – to realise benefits requires deep engagement with the concepts, significant expertise about the idiosyncrasies of the local process and the strategic vision and communication skills to build a case for change and sell it to an often sceptical audience.
Box 2. Fracture clinic redesign at Glasgow Royal Infirmary (Vardy et al, 2013; Jenkins et al, forthcoming)
In 2010, Glasgow Royal Infirmary introduced a new set of procedures for the management of undisplaced factures, referred to as a “Virtual” Fracture Clinic. The overall concept was to standardise patient care for orthopaedic trauma outpatients. This involved the development of protocols for potentially dischargeable injuries and agreement about which patients could self-care. Before the implementation of the new process, patients arriving at the Emergency Department would have their fractures immobilised with a plaster slab and would have to return for an outpatient appointment to have the slab removed. Subsequent to the implementation of the new procedure, some patients would receive a removable splint in the Emergency Department together with a leaflet giving instructions on self-care. Those with potentially dischargeable injuries would be directly discharged from ED. All other patient records would be reviewed at a virtual clinic (without patients in attendance) on a daily basis with a consultant and nurse. All patients are then called by the nurse and either given an appointment to be seen or given further advice on self-care. Around 30% of the initial cohort of patients at ED need to be seen at an outpatient appointment. All orthopaedic trauma patients have access to a hotline number which they can call for further advice. Patient satisfaction with the new process is reported as good, with no additional burden on Emergency Departments. The implementation of the new process has helped the orthopaedic Department of the Glasgow Royal Infirmary contain cost growth at a time of increasing financial stress on the healthcare system.
11
for osteoarthritis, hip replacement surgery is but one of many other medical, pharmaceutical and physiotherapeutic options and shared decision making would seek to communicate the range of options and help patients clarify their personal preferences such that the best strategy can be agreed on. Among the benefits which are claimed to flow from the implementation of shared decision making are improvements in allocative efficiency, that is to say, before producing outputs, one verifies that these outputs are actually valued by the intended beneficiary. In the case of Benign Prostatic Hyperplasia (BPH), for example, experiences show that many patients who are fully informed of the likely consequences, good and bad, of different treatment modes, elect not to have surgery (Wennberg, 2010).
Implementation of shared decision making has tended to follow two routes: reforming education and training systems for health professionals, and empowering patients to become more reflective of their personal preferences. To streamline the process, patient decision aids (PDAs) have been developed for use before or during clinical consultations in order to guide patients through a structured package of information about options, questions about personal values and trade-offs.4 According to a recent Cochrane review, PDAs consistently improve patient knowledge of options and outcomes, and enable more accurate perceptions of outcome probabilities when compared to usual care (Stacey et al, 2011). In practice, however, perceived time constraints remain the most commonly reported barrier among health professionals to their widespread implementation (Légaré et al, 2008). This is particularly challenging since PDAs appear to have a variable effect on the time required for consultations – when patients prepare using a decision aid, this can shorten but also lengthen subsequent consultations (Stacey et al, 2011). Although strides have been made towards shared decision making in cultural and organisational contexts as diverse as the US, the UK, Canada, Germany, Norway and China (Légaré et al, 2008), available studies show that professionals frequently question the applicability of PDAs to meet the needs of their populations and that progress hinges on the willingness of both patients and professionals to engage in the process (Stacey et al, 2011).
4.3 Choice: Priority setting and resource allocation
The terms “priority setting” and “resource allocation” (PSRA) often used in healthcare to describe the activity of deciding what to do – what treatments should be funded, what service reconfigurations to be undertaken and so on. (The somewhat more dramatic word “rationing” is sometimes also used). PSRA represents a natural follow-up activity to performance measurement and the design of service reconfigurations: if performance measurement represents the “intelligence” phase of the decision making process, and lean and shared decision making have an important role in generating ideas about how services might be reconfigured, then PSRA represents the “choice” phases, where decisions about what service improvements to implement are actually made. For example, in the “intelligence” phase, you might realise that you have efficiency problems in your diabetes and childhood mental health services; in the design phase, you might work out and cost strategies for addressing these problems through service reconfiguration; and then in the choice phase, you might decide which of these two clinical areas to target.
4 A range of PDAs for chronic and non-urgent conditions can be accessed for example via the website of the
12
PSRA has become increasingly well-established in many jurisdictions at the policy level in many European countries, through health technology assessment agencies like NICE in England, the Scottish Medicines Consortium in Scotland, the Haute Autorité de Santé in France, IQWiG in Germany and so on. Such agencies typically draw more or less explicitly on the ideas of economic evaluation presented in Drummond et al (2005) and Gold (1996), based around trading off health gain, captured in QALYs, against cost. A variant of the economic evaluation approach, Generalised Cost Effectiveness Analysis (GCEA), has been promoted by the WHO and has received some attention in developing countries (Tan-Torres Edejer et al, 2003).
Even in jurisdictions like England where is a strong central health technology assessment agency, there is still considerable scope for decision making at the local management level. This may be because there is as yet no published policy on guidance on some particular technologies which the local provider wishes to use or because some of the options which are being considered are not the sort of things which are susceptible to health technology assessment (eg closure of a small, inefficient and unsafe but popular A&E). Alternatively it could be because local circumstances mean that because the assumptions about cost or population health underpinning published policy level technology assessments do not apply locally (e.g. the ethnic mix means that the local population has a high prevalence of sickle cell anemia, making it cost-effective to invest in specialised services; providing a small island-based population with timely access to CT scan may not be cost-effective, making it problematic to offer thrombolysis as a treatment for ischaemic stroke).
The closest thing to a process template for PRSA at the local level is “Programme Budgeting and Marginal Analysis” or PBMA (Mitton and Donaldson, 2004; Peacock et al, 2010). Accounts of PBMA emphasise that PRSA involves providing both a modelling framework for eliciting and organising judgements about the reasons for doing different treatments, and process ground rules. For example, Multicriteria Decision Analysis (MCDA), in which stakeholders are invited to score the performance of packages of activity against various objectives, is often presented as a practical and accessible modelling framework, which is simpler and more flexible than full-scale health economic modelling (see e.g. Peacock, et al, 2007 or Wilson et al, 2006 for examples). In a similar way, the Accountability for Reasonableness framework (a collection of principles relating to transparency, relevance of argumentation and openness to appeals) is often presented as a process model (Daniels and Sabin, 2008).
13
Box 3. STAR for healthcare purchasers and clinical experts (Airoldi, 2013; Airoldi et al, 2014; IMPRESS, 2012)
STAR (Socio-Technical Allocation of Resources) refers to an approach to healthcare prioritisation based on a concept of decision making as having both a social and a technical dimension in the spirit of Phillips and Bana e Costa (2007). At the core of the STAR approach are “decision conferences”, facilitated participative modelling workshops, where participants representing diverse viewpoints and interests in the system – managers, hospital doctors, general practitioners, nurses and allied health professionals, finance and public health specialists, and patient representatives – are guided through a set of structured assessment of population level costs and benefits associated with particular courses of action. The philosophy of STAR is that while clinical is evidence is critical to making decisions, decisions never drop out of analysis – decisions must ultimately be taken on the basis expert judgements of facts and values. Thus, while STAR workshops rely on preparatory data gathering, which is tabled at the workshop, the process stresses visual interactive tools to help all workshop participants understand both the scale of costs and benefits associated with particular options on the table, and the efficiency or “bang for the buck” of these options. STAR has been deployed in several Primary Care Trusts in England (as the commissioning organisations were called at the time) with documented stories of impact in Isle of Wight and Sheffield. STAR was also used the clinical expert group IMPRESS to arrive at commissioning guidelines for COPD – these guidelines were glowingly reviewed in the BMJ by Gray and El-Turabi (2012) who state that “ The tool used by IMPRESS… should be adopted and adapted by all clinical communities of practice to estimate and visualise the marginal benefits of all aspects of care for the benefit of patients.”
Since as we have noted above, different healthcare activities are located in different domains of the Cynefin spectrum, one might expect that the differing nature of the evidence base between eg public health interventions (more knowable) than surgical interventions (more known) would present a challenge to would be priority setters. In our experience this is indeed a salient feature of the management of PRSA. A common concern heard from Directors of Public Health is that they believe that rebalancing their portfolio towards the preventive and away from the acute side is the right thing to do for their local population – but the evidence is all for the acute interventions. Indeed, one of the strengths of the STAR approach, which recognises the validity of expert judgement as an input, is that it enables a discussion of the relative merits of acute versus preventive interventions within a common framework.
Grid-group theory also offers an interesting perspective on priority setting. Most PSRA methods, as noted above, have a strong “group” element: they are intended as participatory frameworks. How far that participation extends, however, varies from application to application. For example, the main workshop event in the application reported in Airoldi et al (2014) involved twenty five stakeholders: the eight executive directors of the health authority, nine commissioning managers, three patient and public representatives, four clinical experts and one representative of social services. In another application, the group members were all members of a clinical expert group (IMPRESS) who wished to issue commissioning guidance on COPD (IMPRESS, 2012). Grid-group theory highlights that how intense participation is and what constituencies are included will be culturally driven and culturally dependent.
14
In this section we give some examples of tasks which might face managers tasked with achieving efficiency improvements, and reflect on how the frameworks which we have presented above might give insight into how to go about these tasks.
5. 1 Task 1. Designing a set of efficiency indicators
Efficiency indicators should be designed with a view in mind of the extent to which the aspects of efficiency measured are under the control of the organisation being assessed. As the Cynefin framework suggests, if a performance measurement framework contains a small number of efficiency measures where the causal links between action and performance are clear, this may stimulate the evaluated organisation to identify efficiency improvements through redesigning processes; however if many indicators are not of this type, then the risk is that managers in the organisation will be overwhelmed by the resulting ambiguity. This may result in unintended and unproductive effects such as cynicism and gaming.
Following from this, a key insight offered by grid/ group theory is that if efficiency indicators are to be used to drive performance improvements, this should be done in a way which is appropriate with the prevailing culture. To enable low-grid managers, that is managers who feel constrained by external factors – for example because they feel that a poor efficiency metric is capturing a factor outside their control (such as poor hospital outcomes reflecting patient lifestyles) - processes should be put in place for managers to communicate these concerns to other stakeholders and to policy makers. This in turn should feedback to an improvement in the measurement and monitoring frameworks in place at both organizational and system levels.
Grid-group theory can also provide us with some insights regarding the best types of incentives likely to work in organizations, or to incentivize the management of organizations. In low group settings, that is when managers do not identify as part of the larger health system, performance management systems which rely heavily on extrinsic motivators such as targets or financial rewards may be appropriate. On the other hand, in high group settings, where managers view themselves as part of a wider system the danger is that such motivators may undermine intrinsic motivation and engender cynicism and game playing, and so a more developmental approach may be appropriate. Of course, the use of extrinsic versus intrinsic motivators may be implemented in a deliberate attempt to change culture, but managers who do so should be mindful that both high and low group cultures are viable and can support high performance in the right circumstances.
5.2 Task 2. Using analytic methods to identify process improvements
15
The Cynefin framework recognizes this complexity – some causal connections between action and outcome are obvious and it requires only minimal action to decide what to do, whereas in other settings the linkage is less clear and significant investigative work may be required. Moreover, Cynefin reminds us that there are limits to what can be achieved by analysis. For example, in an environment without good diagnostic coding or data linking, it may be simply impossible to know whether introducing a management programme in primary care for adults with respiratory problems such as COPD or asthma does actually reduce emergency admissions. The existence of these limits of analysis highlights that management operates in an environment which is significantly constrained by policy choices, and sometimes the most appropriate action – indeed the only possible response with any chance of effectively addressing the problem – may be to escalate the problem to a higher system level.
Equally, grid group theory highlights the importance of cultural fit when analytic methods are used as a tool of communication and persuasion. Analytic methods by their nature are somewhat opaque: accepting conclusions which flow from such methods requires taking on trust that the method has been implements competently and in good faith. High grid cultures, where managers feel they are constrained by external factors will deal with this by having standards and checklists for analysis (such as the checklists for economic evaluation which currently seem popular). In high group cultures on the other hand, the focus will be on the personal standing of the analyst. In cultures which are neither high grid or high group, if analytic methods can be used as a tool of persuasion, the modelling methods chosen will have to be very accessible (e.g. painstaking documentation, visual interactive displays to communicate the model structure and workings) and people whose behaviour is to be changed will have to be given the time and opportunity to study and convince themselves, if change efforts are to have any chance of being successful. So the appropriate choice of analytic method depends on careful attention to what is considered as persuasive by the stakeholders who bear responsibility for implementing any resultant action. 5.3. Task 3. Engaging stakeholders in decision making
Cynefin highlights the importance of thinking through why one wants to involve stakeholders in decision making. In some environments, where causes are known and straightforward, involvement of stakeholders might be essentially a communication campaign: in this case involvement could be relatively light touch. In other environments, where causes are unknown or knowable, involving stakeholders could be a good way to get a better understanding of causal relationships – particularly where relationships are not captured in data. In the rare case where the environment is genuinely chaotic, all that one can reasonably hope for from the involvement of stakeholders may be that this kickstarts the process of sensemaking, as problems involving chaotic systems cannot, in the memorable quote of Einstein, “be solved at the same level of thinking as created them”.
16
expertise and formal leadership roles have been consulted, whereas egalitarians will want to see evidence that the process includes those who are most likely to be affected by the decision on the ground, including grassroots staff and patients.
5.4 Task 4. Communicating recommendations through guidelines and protocols
An important idea in Cynefin is that not all knowledge claims are equal: it is now a commonly accepted principle in guideline development that guidelines should include some indication of the strength of the evidence underpinning a particular recommendation, so that those charged with implementing guidance can make a properly sensitive and contextualised judgement about whether to follow a particular piece of recommendation. Initiatives like GRADE (Guyatt et al., 2008) are important precisely because the development of a standard system for communicating the strength of evidence behind a guideline are vital is busy clinicians (and managers) are to be able to quickly form an impression of how unconditional and binding (or how tentative and provisional) they should take a particular recommendation to be.
Similarly Grid/ group theory highlights that in cultural terms, guidelines rely on implicit culture which is, at least to some extent hierarchist: for guidelines to be accepted, readers must accept that the guideline writers are offering legitimate and well-founded advice. To some extent, this hierarchism is inculcated into the medical profession through the process of professional education. However, there is also a significant individualist strand within medicine as well, and in different places and different specialties the balance will be struck differently. Grid/ group theory thus highlights the importance to being sensitive to such cultural differences, and not to assume that guidelines will be everywhere enthusiastically accepted.
6. Conclusion
A theme of this chapter has been that the use of efficiency analysis in the management setting has to be understood, as the Cynefin framework suggests, in terms of the affordances of the underpinning evidence – in some domains of healthcare cause-effect relationships are clear, but in others this is less the case. Often there is good compelling evidence for efficiency improvement which speaks for itself but it is in the (common) situations where this is not the case that management judgement has to be brought to bear. It should be stressed that while science can wait until the evidence is in before coming to a conclusion, and while policy makers can commission evidence reviews and hire experts, neither of these options are available to a manager who will face her Board on Friday and is expected to present recommendations for action.
17
Insofar as neither the evidence base not the prevailing culture can be changed, our argument leads to the conclusion that to be usable and used, efficiency analysis tools have to fit with both that evidence base and cultural context: that is, they have to suggest or evoke arguments which are plausible in the light of the evidence, for solutions which are culturally acceptable. Although some tools explicitly and sometimes successfully seek to transform existing culture – e.g. by building on ideas from other industries – it is likely that managers will need some prior common ground to anchor these ideas. Moreover, our argument suggests that it is not enough to have a technical modelling tool (Stochastic Frontier Analysis, Multicriteria Decision Analysis), but one also has to have a process account of how such a tool can be used – how should supporting evidence be generated and whom should be involved in the interpretation of results and search for solutions.
The need to improve efficiency in healthcare – i.e. to get more benefit for patients and populations with less resources – is going to sorely test health services in coming years. The tools and concepts of efficiency analysis have a part to play but managers have to engage with them in a way where they are realistic and sensitive to what these tools can and cannot offer, and whether they are able to do this will have a huge influence on the shape which our health services take over the next few years and decades. In our view this calls for a significant amount of dissemination activity by the research community via multiple channels (e.g. discussions at key practitioner events and conferences, easily accessible web-based tools in addition to hard copies, and a continued stream of publications on efficiency and performance in healthcare) and co-production of knowledge through work with local stakeholders to help inform the case for change. We hope that volumes such as the present one can play a useful role in facilitating such discussions.
Acknowledgements
18
References
AIROLDI, M. 2013. Disinvestments in Practice: Overcoming Resistance to Change through a Sociotechnical Approach with Local Stakeholders. Journal of Health Politics Policy and Law, 38, 1149-1171.
AIROLDI, M. & MORTON, A. 2011. Portfolio Decision Analysis for Population Health. In: SALO, A., KEISLER, J. & MORTON, A. (eds.) Portfolio Decision Analysis: methods for improved resource allocation. New York: Springer.
AIROLDI, M., MORTON, A., SMITH, J. & BEVAN, R. G. 2014. STAR−−People-Powered Prioritization: A 21st-Century Solution to Allocation Headaches. Medical Decision Making, 34, 965-975.
ARNSTEIN, S. R. 1969. Ladder of Citizen Participation. Journal of the American Institute of Planners, 35, 216-224. CARTER, N., KLEIN, R. & DAY, P. 1995. How Organizations Measure Success: The Use of Performance Indicators in
Government, London, Routledge.
CORALLO, A. N., CROXFORD, R., GOODMAN, D. C., BRYAN, E. L., SRIVASTAVA, D. & STUKEL, T. A. 2014. A systematic review of medical practice variation in OECD countries. Health Policy, 114, 5-14. CRAWFORD, D. H. 2013. Virus hunt: the search for the origin of HIV/ AIDS, Oxford, OUP.
DANIELS, N. & SABIN, J. E. 2008. Setting Limits Fairly: Learning to Share Resources for Health, Oxford, OUP. DORGAN, S., LAYTON, D., BLOOM, N., HOMKES, R., SADUN, R. & VAN REENEN, J. 2010. Management in
Healthcare: Why good practice really matters, London, McKinsey and Company. Centre for Economic Performance, LSE.
DRUMMOND, M. F., SCULPHER, M. J., TORRANCE, G. W., O' BRIEN, B. J. & STODDART, G. L. 2005. Methods for the Economic Evaluation of Health Care Programmes, Oxford, OUP.
ETTELT, S., FAZEKAS, M., MAYS, N. & NOLTE, E. 2012. Assessing health care planning – A framework-led comparison of Germany and New Zealand. Health Policy, 106, 50-59.
FILLINGHAM, D. 2007. Can lean save lives? Leadership in health services, 20, 231-241.
FOLLAND, S. & STANO, M. 1990. Small area variations: a critical review of propositions, methods, and evidence. Med Care Rev, 47, 419-65.
GODDARD, M. & JACOBS, R. 2009. Using composite indicators to measure performance in health care. In: SMITH, P., MOSSIALOS, E., PAPANICOLAS, I. & LEATHERMAN, S. (eds.) Performance measurement for health system improvement: experiences, challenges and prospects. Cambridge: Cambridge University Press, pp. 339-368.
GOLD, M. R., SIEGEL, J. E., RUSSELL, L. B. & WEINSTEIN, M. C. (eds.) 1996. Cost-effectiveness in health and medicine, Oxford: OUP.
GRAY, M. & EL TURABI, A. 2012. Optimising the value of interventions for populations. British Medical Journal, 345.
GUYATT, G. H., OXMAN, A. D., VIST G.E.,, KUNZ, R.,, FALCK-YTTER, Y., ALONSO-COELLO, P,, SCHUNEMANN, H.J,, and GRADE Working Group. 2008. GRADE: an emerging consensus on rating quality of evidence and strength of recommendations. Brit Med J, 336, 924-926.
HOLLINGSWORTH, B. & STREET, A. 2006. The market for efficiency analysis of health care organisations. Health Economics, 15, 1055-1059.
HOPP, W. J. & LOVEJOY, W. S. 2013. Hospital operations: the principles of high efficiency healthcare, Upper Saddle River, NJ, FT Press.
HUSSEY, P. S., DE VRIES, H., ROMLEY, J., WANG, M. C., CHEN, S. S., SHEKELLE, P. G. & MCGLYNN, E. A. 2009. A Systematic Review of Health Care Efficiency Measures. Health Services Research, 44, 784-805. IMPRESS 2012. IMPRESS Guide to the relative value of COPD interventions.
http://www.impressresp.com/index.php?option=com_docman&Itemid=82#sthash.yjsqf2mF.dpuf. Accessed 24/4/14,London, IMPRESS.
JAYARAM, P. R., BHATTACHARYYA, R., JENKINS, P. J., ANTHONY, I. & RYMASZEWSKI, L. A. 2014. A new ‘‘virtual’’ patient pathway for the management of radial head and neck fractures. Journal of Shoulder and Elbow Surgery, 23, 297-301.
JENKINS, P. J., MORTON, A., ANDERSON, G., VAN DER MEER, R. & RYMASZEWSKI, L. A. forthcoming. Fracture clinic redesign was associated with a reduced cost of outpatient orthopaedic provision. Bone and Joint Research.
KURTZ, C. F. & SNOWDEN, D. J. 2003. The New Dynamics of Strategy: Sense-making in a Complex-Complicated World. IBM Systems Journal, 42, 462-483.
19
BERGSTROM, R., WRIGHT, G. D., BROWN, E. D. & CARS, O. 2013. Antibiotic resistance-the need for global solutions. Lancet Infectious Diseases, 13, 1057-1098.
LÉGARÉ, F., RATTÉ, S., GRAVEL, K., GRAHAM, ID. 2008. Barriers and facilitators to implementing shared decision-making in clinical practice: Update of a systematic review of health professionals’ perceptions. Patient Education and Counseling 73, 526–535
LEVINSON, W., KAO, A., KUBY, A. & THISTED, R. A. 2005. Not all patients want to participate in decision making. A national study of public preferences. J Gen Intern Med, 20, 531-5.
MITTON, C. & DONALDSON, C. 2004. Health care priority setting: principles, practice and challenges. Cost effectiveness and resource allocation, 2.
MINTZBERG, H. 1973. The Nature of Managerial Work, New York, Harper Collins.
MORTON, A. & CORNWELL, J. 2009. What's the difference between a hospital and a bottling factory? British Medical Journal, 339, 428-430.
MUNRO, E. 2011. The Munro Review of Child Protection: Final Report. Cm 8062, London, The Stationery Office. NEELY, A. 2013. Benchmarking. In: PAPANICOLAS, I. & SMITH, P. (eds.) Health system performance comparison:
an agenda for policy, information and research. Maidenhead: Open University Press, pp. 113-126. NOLTING, H., ZICH, K., DECKENBACH B, GOTTBERG A, LOTTMANN K, KLEMPERER D, GROTE WESTRICK M &
SCHWENK U 2011. Faktencheck Gesundheit. Regionale Unterschiede in der Gesundheitsversorgung, Gütersloh, Bertelsmann Stiftung.
NUTI, S. & SEGHIERI, C. 2014. Is variation management included in regional healthcare governance systems? Some proposals from Italy. Health Policy, 114, 71-8.
O'CONNOR A, LLEWELLYN-THOMAS HA & FLOOD AB 2004. Modifying Unwarranted Variations In Health Care: Shared Decision Making Using Patient Decision Aids. Health Affairs Web exclusive, VAR63-VAR72. PEACOCK, S. J. R., J.R.J. CARTER, R. EDWARDS, D. 2007. Priority setting in health care using multi-attribute utility
theory and programme budgeting and marginal analysis (PBMA). Social Science and Medicine, 64, 897-910.
PEACOCK, S. J., MITTON, C., RUTA, D., DONALDSON, C., BATE, A. & HEDDEN, L. 2010. Priority setting in healthcare: towards guidelines for the program budgeting and marginal analysis framework. Expert Review of Pharmacoeconomics & Outcomes Research, 10, 539-552.
PHILLIPS, L. D. & BANA E COSTA, C. 2007. Transparent prioritisation, budgeting and resource allocation with multi-criteria decision analysis and decision conferencing. Annals of Operations Research, 154, 51-68.
RADNOR, Z. J., HOLWEG, M. & WARING, J. 2012. Lean in healthcare: The unfilled promise? Social Science & Medicine, 74, 364-371.
RONEN, B. & PLISKIN, J. S. 2006. Focused Operations Management for Health Services Organizations: Linking Efficiency and Productivity Jossey Bass Wiley.
ROTH, A. & FONAGY, P. 2005. What works for whome? A critical review of psychotherapy research. 2nd edition, New York, Guildford.
SALO, A. & PUNKKA, A. 2011. Ranking intervals and dominance relations for ratio-based efficiency analysis. Management Science, 57, 200-214.
SCHANG, L., MORTON, A., DASILVA, P. & BEVAN, G. 2014. From data to decisions? Exploring how healthcare payers respond to the NHS Atlas of Variation in Healthcare in England. Health Policy, 114, 79-87. SCHANG, L., HYNNINEN, Y., MORTON, A., SALO, A. 2015. Developing robust composite measures of healthcare
quality - Ranking intervals and dominance relations for Scottish Health Boards. Working paper. STACEY D, BENNETT CL, BARRY MJ, COL NF, EDEN KB, HOLMES-ROVNER M, LLEWELLYN-THOMAS H, LYDDIATT
A, LÉGARÉ F,THOMSON R. 2011. Decision aids for people facing health treatment or screening decisions. Cochrane Database of Systematic Reviews, 10. Art. No.: CD001431. DOI:
10.1002/14651858.CD001431.pub3.
SIMON, H. A. 1977. The New Science of Management Decision, New York, Harper and Row.
TAN-TORRES EDEJER, T., BALTUSSEN, R., ADAM, T., HUTUBESSY, R., ACHARYA, A., EVANS, D. B. & MURRAY, C. J. L. (eds.) 2003. WHO guide to cost-effectiveness analysis, Geneva: World Health Organisation.
THOMPSON, M., ELLIS, R. & WILDAVSKY, A. 1990. Cultural theory, Boulder, CO, Westpress.
VARDY, J., RYMASZEWSKI, L., BEGBIE, K., ANTHONY, I., CHEKROUD, M., CLARK, K. & IRELAND, A. J. 2013. Fracture pathway redesign improves emergency department efficiency. Emergency medicine journal : EMJ, 30,
876.
VISSERS, J. & BEECH, R. (eds.) 2005. Health Operations Management Routledge.
WARING, J. J. & BISHOP, S. 2010. Lean healthcare: Rhetoric, ritual and resistance. Social Science & Medicine, 71,
1332-1340.
20
WILSON, E. C. F., REES, J. & FORDHAM, R. J. 2006. Developing a prioritisation framework in an English Primary Care Trust. Cost effectiveness and resource allocation, 4.