Abstract: Cancer is a second leading cause of mortality in a world. Approximately 9. 6 million deaths are occurred due to cancer till 2018. As per the World Health Organisation, breast cancer is the major reason of mortality among women. Many lives can be saved by reliable detection and diagnosis of breast cancer in primitive stage. It is difficult to classify normal and abnormal mammograms accurately because of noise, dense breast tissues, unwanted parts such as labels and pectoral muscle. The methods based on Computer Aided Detection (CAD) can address these problems. These methods provide diagnosis assistance to radiologists and doctors for detection of cancer. Human errors can be reduced with the help of Computer Aided Detection algorithms. In this work mammogram images are preprocessed using longest line detection algorithm to remove pectoral muscle. Then texture and statistical features are extracted from preprocessed mammograms. Finally decision tree classifier is used to classify mammograms as normal and abnormal categories. The proposed methodology is applied to 322 mammograms. The performance analysis resulted into improved accuracy of 98.14%, sensitivity of 99.1% and specificity of 97.63%.
I. INTRODUCTION
Breast cancer is main reason of death in world. According to World Health Organisation out of 9.6 million cases of cancer, 2.09 cases are of breast cancer till 2018. Gender, family-history, gene mutations in BRCA1 and BRCA2, age, overweight (specifically after menopause), and consumption of alcohol are the few causes of breast cancer [1]. There are many imaging techniques for breast cancer screening such as mammography, ultrasound, Magnetic Resonance Imaging (MRI), thermography and elastography. Mammography is famous and commonly used screening technique for detection and clinical evaluation of breast cancer [2]. Masses,
architectural distortion, calcifications and bilateral asymmetry are the indications of breast cancer. Masses are irregular in shape with rough boundary. Masses appear as dense tissues on mammogram, therefore distinction between masses and tissues with our eyes is a challenging task.
Revised Manuscript Received on May 16, 2019.
A.M. Solanke, Electrical & Electronics engineering, Jain (Deemed-to-be- University), Bangalore, India.
Dr. Manjunath, Electrical & Electronics engineering, Jain (Deemed-to-be-University), Bangalore, India.
Dr. D.V.Jadhav, Joint Director, Technical Education Amaravati, India
Specially women with dense breasts may suffer from false diagnosis. Normal breast structure gets distorted and seen as speculated lines from one source point in architectural distortion. Calcifications may appear as single spots or in clusters. Calcifications may appear as single spots or in clusters. Asymmetry of fibro-glandular tissue density between right and left breast is bilateral asymmetry [3][4]. Different CAD techniques are proposed for spotting abnormality on mammogram. Major steps of CAD system are preprocessing of mammograms, extraction of significant features and classification. These steps are implemented to focus on region of interest by removal of unnecessary information and extracting features [5]. Preprocessing is implemented by using series of morphological operations, median filter, thresholding, histogram equalization techniques, different edge detection techniques [6][7]. Region of interest is enhanced by contrast image enhancement techniques such as histogram equalization, convolutional mask, fixed neighbourhood, statistical enhancement, region based enhancement [8]-[10]. Separation of mammogram is carried out by features extraction of enhanced images. Specifically for mammogram, features extracted are related to texture properties, statistical properties, wavelet transform, Gray Level Co-occurrence Matrix (GLCM) and intensity properties. Further classifiers like Support Vector-machine (SVM), Bayesian, Artificial Neural Network (ANN), K Nearest Neighbour (KNN), Convolutional Neural Network (CNN) and Decision Tree (DT) are preferred for classification of mammograms [11]. CAD techniques are proposed to detect breast cancer accurately. Mammograms have fatty or dense background. Elshinawy proposed a technique to separate dense and fatty mammograms using Local Binary Pattern and SVM classifier [12]. Naveed proposed bagging ensemble method for mammogram classification by combining ANN, KNN, SVM and Bayesian classifiers and improved the accuracy as compared to individual classifiers using DWT features [13]. Nithya developed algorithm for classification of non cancerous and cancerous mammograms of DDSM database. Overall accuracy of 96% is obtained by using GLCM feature extraction and Neural network classifier [14].Ohmshankar formed two sets of mammogram images. One set includes normal images and another set contains images with mass and calcification as abnormal images. These sets separated using texture features and KNN
classifier as normal and abnormal mammograms with 92% accuracy [15].
A Novel Approach for Classification of
Mammograms using Longest Line Detection
Algorithm and Decision Tree Classifier
Ranjit developed a system by extracting ROI of each abnormal image and calculated GLCM texture features of ROI. Separation of mammograms is carried out by SVM, ANN and KNN classifiers. KNN classifier achieved 95% accuracy that proved to be better than other two classifiers [16]. Anwar offered new algorithm for feature extraction and feature selection from mammograms. Discrete Cosine Transform (DCT) features are extracted and feature selection is carried out by new Weighted Sparse PCA (WSPCA) method. Classifiers such as Bayesian, DT and SVM are tried for classification of cancerous and non cancerous mammograms of MIAS database. DT classifier performed with 97. 8 % accuracy better than the other two [17]. Proposed method classify mammograms with improved accuracy than current methods. Accurate diagnosis will detect breast cancer in early stage and reduce deaths. Our proposed system achieved 98.14% accuracy, sensitivity of 99.1% and specificity of 97.63% by using new longest line detection algorithm and decision tree classifier.
II. DATABASE
The Mammographic Image Analysis Society (MIAS) database is made available for researchers by an organisation of United Kingdom research groups. Total 322 mammogram images are available with left and right breasts of total one sixty one women. Even numbered file name mammogram is of left breast and odd numbered file name is of right breast of the same person. All mammogram are of size1024 x 1024 pixels. Database consists of normal mammograms and abnormal mammograms with masses, calcifications, architectural distortion and bilateral asymmetry.
III. PROPOSED WORK
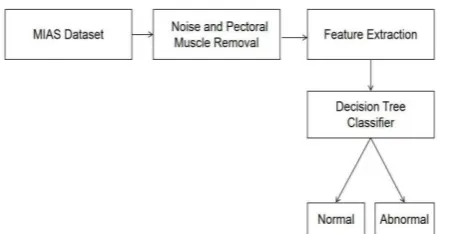
The proposed CAD system is a novel approach to analyse and separate mammograms. Total 16 features are extracted and classified which is resulted into high accuracy, sensitivity and specificity. Fig. 1 shows flow of implemented method.
Fig. 1 Flow of proposed CAD method for classification of mammograms
A. Pre-processing Technique:
Mammograms are pre-processed to get rid of labels, markers, noise and unwanted part such as pectoral muscle. Series of morphological operations are applied to filter out the unnecessary data. Pectoral muscle is removed by various techniques such as sobel filter with hough transform [18], geometrical based segmentation technique [19], operations such as thresholding, gamma correction followed by morphological operations [20]. In our proposed work pectoral muscle is masked out by longest line detection algorithm as
shown in Fig.1(d). Long line detection is carried out by canny edge detector and hough transform. There are many edge detection filters like prewitt, sobel, roberts and laplacian. These filters are sensitive to noise as compared to canny edge detector. Canny edge detector uses maximal suppression method and hysteresis thresholding [21]. Algorithm for preprocessing is explained in detail as follows.
1. Mammogram images are in RGB colour format. These
images are converted from RGB to grayscale as shown in equation 1.
(1) Bc 0.1140 + Gc 0.5870 + Rc 0.2989 =
A
2. Gray scale mammograms are converted to binary
image by using level of 0.04. Pixels in gray scale image with luminance greater than 0.04 are replaced by white and all other pixels with black .
3. Morphological operation is performed on image A with 5×5 disc structuring element B, as given by equation (2).
otherwise
if B fits
g(x,y)
0
A
1
(2)
4. Eight connected components having pixels less than 20000 are removed.
5. Dilation is performed on new binary image A and structuring element B , which is given by equation (3).
otherwise
if B hits
y
x
g
0
A
1
)
,
(
(3)
B
z
|
(
B
)
z
A
A
6.Height wise image division:To concentrate on desired part, image is divided vertically in two parts.
A= A /2 (4)
7.Identification of left or right breast:
Mean is calculated for divided parts and decision of right or left breast mammogram is based on mean.
if AvgLeft > AvgRight side = 'left';
Else
side = 'right';
8.Morphological opening with line structuring element with positive angle for mammogram of left breast and negative angle for right breast mammogram.
A
B
=
(A
B)
B
(5)9.Edge detection with Canny edge (C.E.) :
} {z|(B) A B
[image:2.595.57.282.503.620.2]C.E. is optimal type of edge detector. This detector gives magnitude as well direction.
Perfect detection, localization and only single response for each edge point are the criterion for C.E. edge detection. Steps for C.E. detection are as follows:
Step1:Smoothing of image A by Gaussian filter is given by equation (6)
S
A
*
g
(
x
,
y
)
(6) g(x, y) is given by equation (7)
2 2 2
2
2
1
x
σ
y
e
πσ
g(x,y)
(7) Standard deviation value σ is 1. 41.
Step2:Derivative of filtered image is presented in equation (8).
A
*
g
A
*
g
A
*
g
g
s
A
*
g)
(
)
A
(g*
s
y x
y x
(8) Step 3:Computation of magnitude M and direction D gradient
x y
y x
S
S
S
S
M
1
tan
D
)
(
2 2
(9) Where (Sx , Sy) are gradient vectors
Step 4:Non Maximal Suppression:
Examining orientation of each edge point leads to intensive computations. To overcome these computations non Maximal Suppression is applied. Direction of gradient is perpendicular to edge. Compare point M(x, y) on edge
to neighbouring pixels M(x1, y1) and M2(x2, y2)that fall on
the same gradient direction.
M(x, y) is retained if it is greater than two neighbouring points otherwise suppressed as described in equation(10).
)
,
(
M
s
x
y
if)
,
(
)
,
(
)
,
(
)
,
(
x
y
>
s
x
1y
1&
s
x
y
>
s
x
2y
2s
(10)
0 Otherwise Step4:Hysteresis thresholding
Two threshold values are considered as low and high in hysteresis thresholding. If gradient magnitude is greater than high threshold then it is edge pixel and if lower than low threshold then non edge pixel. Values between high and low threshold are checked with eight point connected neighbours. Fig. 2 (b) shows detected edges of input mammogram.
Step 5:Pectoral muscle detection by identifying longest line among detected edges by Hough transform (H.T.): H.T. is used for edge linking to detect pectoral muscle. Hough transform maps x-y plane into c-m plane. Points in
x-y plane become lines in c-m plane. Line is represented by equation (11).
c
mx
y
(11)Where m is a slope and c is y intercept. Rearranging the equation (11) in c-m plane we get equation (12).
y
x)m
(
c
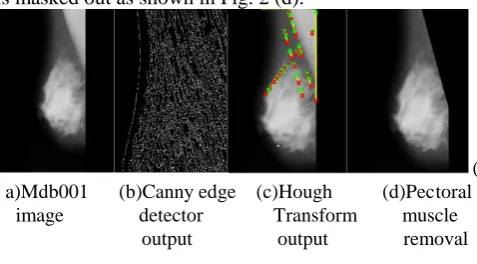
(12) Edge points in x-y will have common intersection point in c-m plane. Line is drawn by finding local maxima in c-m plane. Line end points are determined as shown in Fig. 2 (c) and longest line is detected. Part above pectoral muscle is masked out as shown in Fig. 2 (d).
[image:3.595.307.546.215.347.2]( a)Mdb001 (b)Canny edge (c)Hough (d)Pectoral image detector Transform muscle output output removal
Fig. 2 Preprocessing of mammogram image
IV. EXTRACTION OF FEATURES AND CLASSIFICATION
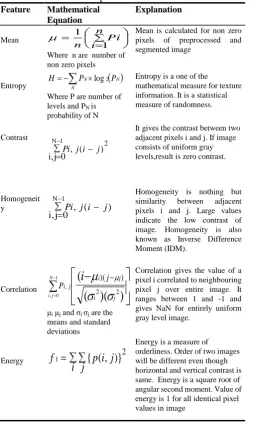
Table 1. Mathematical representation of extracted features
Feature Mathematical
Equation
Explanation
Mean n
i Pi
n 1
1
Where n are number of non zero pixels
Mean is calculated for non zero pixels of preprocessed and segmented image
Entropy
N
NN P
P
H log2
Where P are number of levels and PN is probability of N
Entropy is a one of the
mathematical measure for texture information. It is a statistical measure of randomness.
Contrast 2 ) ( , 0 j i, 1 N j i j i P
It gives the contrast between two adjacent pixels i and j. If image consists of uniform gray levels,result is zero contrast.
Homogeneit
y , ( )
0 j i, 1 N j i j i P
Homogeneity is nothing but similarity between adjacent
pixels i and j. Large values indicate the low contrast of image. Homogeneity is also known as Inverse Difference Moment (IDM).
Correlation
(
)(
)
(
2 2 , ) )( 1 0, i j
j i j i j P
i
N ji
μi μj and σi σj are the means and standard deviations
Correlation gives the value of a pixel i correlated to neighbouring pixel j over entire image. It ranges between 1 and -1 and gives NaN for entirely uniform gray level image.
Energy 2
}
)
,
(
{
1
i j
p
i
j
f
Energy is a measure of orderliness. Order of two images will be different even though horizontal and vertical contrast is same. Energy is a square root of angular second moment. Value of energy is1 for all identical pixel values in image
[image:4.595.311.543.62.409.2]DT classifier classifies mammogram images. Data is divided into training and testing. 97 false positive cases occurred for 60% training. For 70% training data false positive (FP) cases are 16. When training data is 80% resulted in 11 FP cases. Finally for 90% training data, false positive cases are reduced up to 6 only and outcome is improved accuracy [27]. Table 2 gives results of methodologies proposed by various researchers for classification of mammograms. Proposed method gives improved classification accuracy of 98.14%, specificity of 97.63% and sensitivity of 99.1% than other methods. Experimental results are presented in Table 3. Graphs of sensitivity, accuracy and specificity are shown in Fig.4.
Fig. 4 Graphs of sensitivity, accuracy and specificity
Table 2. Comparison of methodologies and proposed work
Author Database Methodology Results
J.Dheeba et al (2014) [28] Clinical database, 216 images Laws texture features, Swarm Optimized Wavelet Neural Network (PSOWNN) classifier Specificity:92.105% Sensitivity:94.167% AZ: 0.96853 K. Ganesan et.al (2014) [29] SATA Comm Health, Singapore. 282,image s Discrete wavelet Transform, Spherical Wavelet Transform Features and SVM classifier
Accuracy:88.80% Specificity:87.91% Sensitivity: 89.69%
M.Pratiwi et al (2015) [30] MIAS database GLCM features, Radial Basis Function Neural Network (RBFNN) classifier Accuracy: 94.29% Specificity: 89.47% Sensitivity: 100%
W.Peng et al (2016) [31]
MIAS database
Texture features and ANN classifier
Accuracy:96% Specificity: Not mentioned Sensitivity: Not mentioned N.Amrane
et al (2018) [32] Wisconsin Breast Cancer dataset K Nearest Neighbor (KNN) classifier Accuracy: 97.51% Specificity: Not mentioned Sensitivity: Not mentioned Proposed Method MIAS database GLCM, DWT, statistical features,DT classifier Accuracy: 98.14% Specificity: 97.63% Sensitivity: 99.1%
Table 3. Experimental results
Training Percentage F.P. Sensitivity Accuracy Specificity
60 97 56.52 69.88 79.89
70 16 93.04 95.03 96.14
80 11 95.61 96.08 97.12
90 06 99.1 98.14 97.63
V. CONCLUSION
This work presents a novel CAD method to classify mammograms into normal and abnormal categories. In this method, mammograms are preprocessed by removing noise and unnecessary part. Noise is removed by applying series of morphological operations. Further, area above pectoral muscle is removed by using longest line detection algorithm. This algorithm is a combination of canny edge detector and hough transform. The canny edge detector outperformed all other edge detectors. The features such as GLCM, DWT and statistical features are extracted from preprocessed mammograms. Finally decision tree classifier is used to classify mammograms as normal and abnormal categories. This method resulted into improved classification accuracy, specificity and sensitivity of 98.14%, 97.63% and 99.1% respectively.
ACKNOWLEDGMENT
[image:4.595.50.287.622.757.2]Athor-1 Photo
Author-2 Photo
Author-3 Photo REFERENCES
1. Michiel K., Kersten, Mads. N, Andrew Y. Ng, Pengfei D., Christian I., Celine M. Vachon, Katharina H., R. R. Winkel, Nico K., and Martin L., “Unsupervised Deep Learning Applied to Breast Density Segmentation and Mammographic Risk Scoring,” IEEE Trans. on med. img., 2016, Volume 35, Page No. 1322-1331.
2. Zhili C., Harry S., Arnau O., Erika R. E. D., C. Boggis, and Reyer. Z., “Topological Modelling and Classification of Mammographic Microcalcification Clusters,” IEEE trans. on Biomedical Engg., 2015, Volume 62, Iss. 4, Page No. 1203-1214.
3. Jasjit S. Suri, Rangraj M. R., “Recent Advances in Breast Imaging, Mammography, and Computer-Aided Diagnosis of Breast Cancer,” SPIE Press, 2006.
4. Paola C., Arianna M., Marcello S., Rangraj R., “Analysis of Structural Similarity in Mammograms for Detection of Bilateral Asymmetry,” IEEE Trans. on Med. Imag., 2015,Volume 34, No. 2, Page No.662-671.
5. Rinku R., Jayasree C., Abhishek M., “Analysis of 2D singularities for mammographic mass classification,” IET journal of Comp. Vision, 2017, Volume 11, Iss. 1, Page No. 22-32
6. A. Makandar, B. Halalli, “Classification of Mass Type Based on Segmentation Techniques with Support Vector Machine Model for Diagnosis of Breast cancer, ” ICDMAI, 2017, Page No.81-86. 7. Abu A., Partibh M., K. Chidella, K. Saeed, Kim C., Moniruzzaman M.,
“A Novel Technique to Analyze Mammography Images for Breast Cancer Treatment,” IEEE Proceedings of ICAEE, 2017, Page No. 105-110
8. W. M. Morrow, R. B. Paranjape, Rangaraj M. R., J. E. L. Desautels, “Region-Based Contrast Enhancement of Mammograms,” IEEE Trans. Med. Imag., 1992, Volume 11, Iss. 3, Page No. 392-406. 9. Shen. C. T. , Zih S. C., Wei T. T., C.P. Lin, L. Cheng, “A Mass
Detection System in Mammograms Using Grey Level Co-occurrence Matrix and Optical Density Features,” Proceedings of ICS, Springer, 2012, Page No. 369–376.
10. Karen P., Yicong Z., Sos A., Hongwei J., “Nonlinear Unsharp Masking for Mammogram Enhancement”IEEE Trans. on Info. Tech. in Biomed. 2011, Volume 15, Iss. 6, Page No. 918-927.
11. Rangayyan R. M., Fabio A.J., J.E.Lio D., “A review of computer-aided diagnosis of breast cancer: Toward the detection of subtle signs,” Elsevier,Journal of Franklin Institute, 2007, Volume 344, Page No. 312-348.
12. Mona. Y. E., Abdul-Hameed. A. B., Wael W. A., Mohamed F. C., “Pre-CAD system for normal mammogram detection using local binary pattern features,” IEEE Int. Symposium on CBMS,2010, Page No. 352–357.
13. Nawazish N., T. S. Choi M., A. Jaffar, “Malignancy and abnormality detection of mammograms using DWT features and ensembling of classifiers,” Int. Journal of the Physical Sci., 2011, Volume 6, Iss. 8, Page No. 2107-2116.
14. N.,Rajendran, B. Santhi, “Classification of Normal and Abnormal Patterns in Digital Mammograms for Diagnosis of Breast Cancer,” Inter. Journal of Comp. Appli., 2011, Volume 28, Iss. 6, Page No. 21-25.
15. S. Ohmshankar, C. K. C. Pauls, “Haralick Fetaure Based Mammogram Classification System,” IEEE ICCTET proceedings, 2014, Page No. 409-413.
16. Ranjit B., Abhijit N., Sudipta R., “Mammogram Classification using Gray-Level Co occurrence Matrix for Diagnosis of Breast Cancer,” ICMTE,IEEE Int. Conf., 2016, Page No. 161-166
17. A., Ebrahim, “Detection Of Breast Cancer In Mammograms Through A New Features And Decision Tree Based, Classification Framework,” Journal of Theo. and Appl. Info. Techno., 2017,Volume 95, Iss. 22, Page No. 6256-6267.
18. Arianna M., Giulia R., Marcello S., Roberto L., “Assessment of a Breast Mass Identification Procedure Using an Iris Detector,” IEEE Trans. on Instru. and Meas., Volume 59, Iss. 10, 2010, Page No. 2505-2512.
19. Saeid A. T., L. Yonghuai, M. Brandon, H. Ghassan, “Geometry-Based Pectoral Muscle Segmentation From MLO Mammogram Views,” IEEE Trans. on Biomed. Engg., 2017, Volume 64, Iss. 11, Page No. 2662-2671.
20. Shen. C. T., Zih S. C., Wei T. T., “An Automatic Mass Detection System in Mammograms based on Complex Texture Features,” IEEE Journal of Biomedical Health Informatics, 2014, Volume 18, Iss. 2, Page No. 618-627.
21. Li J., Ding S. “A Research on Improved Canny Edge Detection Algorithm,” ICAIC proceedings, Springer, 2011, Vol 228, Page No. 102-108.
22. Hengda.C., Xiangjun S., Rui M, Liming Hu, X. Cai, H. Du, “Approaches for automated detection and classification of masses in mammograms,” Journal of Patt. Recog., Elsevier science, Inc., 2006, Volume 39, Iss. 4, Page No. 646 – 668.
23. Xiaoming Liu, J. Tang, “Mass Classification in Mammograms Using Selected Geometry and Texture Features, and a New SVM-Based Feature Selection Method,” IEEE Syst. Journal, 2014,Volume 8, Iss. 3, Page No. 910-920.
24. Robert M. H., K.Sam S., Itshk D., “Textural features for image classification,” IEEE Trans. Syst. Man Cybern, 1973, Volume 6, Page No. 610-621.
25. Gwenole Quellec, Mathieu Lamard, Michel C., G. Coatrieux, Guy C., “Multiple-Instance Learning for Anomaly Detection in Digital Mammography,” IEEE Trans. on Med. Imag., 2016, Volume 35, Iss. 7, Page No. 1604-1614.
26. M. Talha, “Classification of mammograms for breast cancer detection using fusion of discrete cosine transform and discrete wavelet transform features”, Int.journal of Med.Sci.,Biomed. Research, 2016,Volume 27, Iss. 2, Page No. 322-327.
27. Autsuo H., “Diagnosis of Breast Cancer using Decision Tree and Artificial Neural Network Algorithms,” International Journal of Comp. Appli. Techno. and Research, Volume 7, Iss. 01, Page No. 23-27.
28. Jaya T.D., Navraj A. S., T. S. Sankai, “Computer-aided detection of breast cancer on mammograms: swarm intelligence optimized wavelet neural network approach,” Journal of Biomedical Informatics, 2014, Page No. 1-8.
29. K. Ganesan, U. R. Acharya, C. Kuang Chua, L. C. Min, T. K. Abraham, “Automated Diagnosis of Mammogram Images of Breast Cancer Using Discrete Wavelet Transform and Spherical Wavelet Transform Features: A Comparative Study,” Journal of TCRT, Volume 13, Iss. 6, 2014, Page No. 605-615.
30. M. Pratiwi, Alexander, J. Harefa, S. Nanda, “Mammograms Classification using Gray-level Co-occurrence Matrix and Radial Basis Function Neural Network,” ICCSCI conference, Science Direct, 2015, Page No. 83 -91.
31. W. Peng, Rene V. M., E. M. A. Hussein, “An Automated Confirmatory System for Analysis of Mammograms,” Elsevier, journal of CMPB, 2015, Page No. 1-22.
32. M. Amrane, S. Oukid, I. Gagaoua, T. Ensar, “Breast Cancer Classification Using Machine Learning,” EBBT meeting, 2018, Page No. 1-4.
AUTHORS PROFILE
A.M.Solanke received the M.E. degree from Government College of Engineering, Pune, India. She is presently a research scholar in Electrical & Electronics engineering, Jain (Deemed-to-be-University), Bangalore, India. She is assistant professor in MMCOE, Pune, India.
The areas of her research interest are biomedical image processing, deep learning and communication engineering.
Dr. Manjunath R. has a blend of academic and industry experience over two decades. He has filed about 60 patents, authored 180 research papers in international conferences and journals and a book. He was a member of embedded systems special interest group at NASSCOM and advisor for Consumer lifestyle and Healthcare subcommittees. He represented the industry in international standardization bodies such as Wi-Fi Alliance, served as the editor for the regional profiles standard in Digital Living Network Alliance (DLNA) and as the industry liaison officer for the CE-Linux Forum. He figures in Marquis Who’s Who 2008 & “2000 outstanding intellectuals of the 21st century”, International Biographical Center, UK.
Dr. D.V.Jadhav received the Ph.D. degree from SGGS Institute of Engineering and Technology, Nanded, India. He authored many research papers in international conferences and journals and a book. He is Joint