International Journal of Innovative Technology and Exploring Engineering (IJITEE) ISSN: 2278-3075, Volume-8 Issue-12, October 2019
Enhanced Object Detection using Generalized
Hough Transform and RANSAC
Rammah Yousef, Pranaw Kumar, Nabhan Yousef
Abstract: In this paper object detection process has been implemented using the combination of some robust algorithms. The algorithms used are SIFT, GHT and RANSAC. Two models have been proposed which using two of the above mentioned algorithms. In model one features extraction by SIFT has been processed using Generalized Hough Transform (GHT) , where in other model improved RANSAC has been used to eliminate the mismatches in order to achieve better recognition resolution. Overall GHT is found to be superior technique to achieve object detection efficiently.
Keywords : Object detection, SIFT, General hough transform, RANSAC.
I. INTRODUCTION
B
eing a local feature detecting and descriptive technique , Scale Invariant Feature Transform (SIFT) has been one of the most popular among existing computer vision algorithms .Features that are extracted using SIFT algorithm are invariant to rotation and image scaling. It is also partially robust to the changing view point and the changes in illumination .It is a four stage approach to extract local features from an image. The initial two stages are focused on extracting information of feature location, it also insure repeatable and reliable feature location. However the later two stages have focused on creating feature description. Initially an orientation is assigned to an image which makes the features invariant to rotation and after that the descriptor is created. For calculation of feature descriptor that results a feature vector of 128 elements long, a set of 16 histogram with 8 orientation bins has been used. The extracted features using this algorithm due to its invariance and robustness nature become an excellent candidate for object recognition. SIFT proves to be the most reliable technique to extract invariant features from an image. Adopting this algorithm, a number of object recognition systems have been reported so far,[1-3]. Further some improvement in SIFT have also been proposed in most of the research, especially enhancing its effectiveness [4-6].Obtained local features using SIFT may not always be useful .For characterizing the object for detection purpose. Hence ,it is needed to identify and eliminate features which can negatively affect the performance of the detection task.Generalized Hough Transform (GHT) proposed by Ballard can be considered as an evidence gathering process. A proper match between a linear pattern and the model description results successful object detection.
Revised Manuscript Received on October 05, 2019.
Pranaw Kumar is an Assistant Professor in School of Electronics Engineering, Kalinga Institute of Industrial Technology University, Bhubaneswar, Odisha, India.
Rammah Yousef, Studying M.Tech in Communication Engineering in KIIT University, Bhubaneswar, India.
Nabhan Yousef, Studying M.Tech in Information Communication Technology in Marwadi University, Rajkot, Gujarat, India.
The Hough transformation shows attractive properties for shape detection ,properties like immunity to noise ,occlusion and the capacity to handle multiple occurrence of shapes on being detected makes HT vital. For parametric shapes used way of representation is very concise. Generalized Hough Transform which is a derivative of Hough transform is widely applicable in such cases [7]. Illing et al .gives a full and comprehensive survey on HT method [8]. Duda et al exhibits an effective way on using HT for detecting straight lines. Merlin and Farther proves that detection of an arbitrary shapes with the given orientation and scale can be achieved by generalizing this HT. It uses the edge operator to determine the gradient direction of each boundary pixel. Further the GHT uncouples the detection of an image into three different stages data orientation ,scale and displacement competition . Hence GHT can accommodate for the situations like the presence of noise, occlusion, etc.. It can be achieved by simply increasing the number of parameters used for describing the model to be detected [7,9,10]. A number of extensions of the existing GHT has been done to reduce the coast [11-13].
A Robust regression algorithm basically works on the outliers without loss of accuracy in the parameters. The complexity of computer vision algorithm results frequent outliers. A simple system aiming to solve even negligible user interface faces the problems of outliers. Outliers are the dataset which doesn’t satisfy any functional relationship with the given model .The most commonly used in this regard. Random Sampling Consensus (RANSAC) has been the most commonly used robust algorithm in computer vision [14]. However this technique also have some limitation which make RANSAC unsuitable for real time applications. Several researches has been reported to overcome this limitations [15-19]. RANSAC has been applied for overcoming many difficulties raised due to camera pose estimation and structure from the motion [20].
II. MATHEMATICALANALYSISOFTHE
ALGORITHMSUSED
Scale Invariant Feature Transform (SIFT)
Scale Invariant Feature Transform is the most used algorithm for features extraction from an image among many proposed algorithms which has been developed by Davis G. Low in 2004[].Basically SIFT algorithm depends on the following steps:
Extrema detection:
(DoG) image is referred as equation (3).L(x,y,σ) represent the blurred version of the original image at the coordinates (u,v)on image with scale σand this image can be expressed as
:
(1)
(2) (3) Where I(u,v) is the original image (x,y) are the distances from the point (u,v). By changing k-step in equation (3) we get multiple DoG images with various scales. After that maxima and minima of DoG images are detected by comparing the target pixel with its 26 neighbouring pixels among (3x3) scale , this extrema nand minima points are regarded as keypoints.
Keypoints localization :
Some of the detected keypoints which are sensitive to noise because of poor contrast should be rejected by selecting a suitable threshold value to limit the number of unwanted keypoints.
Orientation assigning:
For each keypoint the direction of image gradient is determined with its magnitude and orientation that are calculated using equations (16)and (17).
Descriptors computing :
A descriptor is made of generating an array from the local neighbouring of each keypoint, then gathering descriptors in one array is made with region of (3x3) pixels consisting of 9 pins ,So the result is a vector of 128 elements length. These descriptors contains all th information such as : magnitudes and scales and gradient direction.
Some additional procedures should follow the features extracting process for completing the object detection task in good way.
General Hough Transform(GHT)
In order to detect the features of shape lines, circles, arbitrary shapes in a digital image, Hough transform is highly preferred which is regarded as a robust technique to detect muti-dimensional features and also to estimate parameters of the digital image. The motive of this technique is to detect imperfect instances of object within a particular class of shapes. It is achieved by a voting procedure ,this voting procedure is furnished out in a parameter space where object candidates are taken as local maxima in accumulator space. It is explicitly constructed by algorithms based on Hough transform. A transformation between Cartesian space and parameter space has been done using Hough transform which results with defining a straight line .Let us consider the case that having straight line in an image, Every point (xi,yi) in that image is noted first .All the straight lines that passes through that point should satisfy equation (4) by varying both intercept (m, c)and lines slope.
(4)
In case the variables get reversed and the values (m, c)is seen as a function of image point co-ordinates (xi,yi),the equation (3) can be modified as:
(5)
Again equation (4) represents a straight line on graph of ( c) verses(m) .As per the discussion made above, an algorithm for detecting lines in images can be explained as follows: Step-1: All the line points in the image has been formed using a valid line detection scheme.
Step-2: The space(m, c)has been quantized in two dimensional matrix H with proper quantization level. Step-3:The matrix H has been initialized to zero.
Step-4:Each element of the matrix H ,H(mi, ci) found corresponding to line point gets incremented by 1 .It results a histogram or vote matrix that shows the frequency of line points with respect to particular (m, c) values.
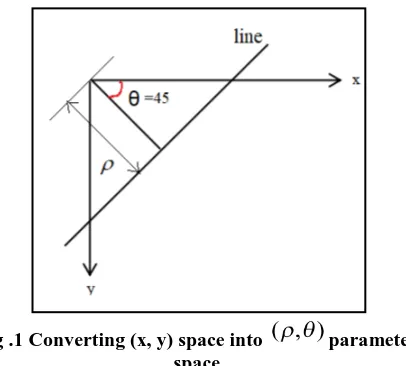
Step-5: A threshold histogram h is defined such that elements with large values are taken. Generalized Hough Transform that works on the principle of template matching is basically the modified version of Hough Transform .This enables the technique to easily detect any arbitrary object residing in its model along with the detection of the object mentioned in analytic equations .Finding the model positions somehow solve the problem of object finding in an image. GHT transforms the problem of finding model position into a problem of finding the transformation parameter which can map the model into respective image. After having the value of the transformation parameter ,the model positioning in an image can be easily determined. GHT implementation uses line information to show mapping from line point orientation to the reference point of the shape. In GHT, (x, y) space is transformed into (r,θ) space .Hence ,a line can generally be represented as:
(6)
[image:2.595.328.531.433.616.2]Where r is the perpendicular distance from the origin to the line shown in(Fig. 1).
Fig .1 Converting (x, y) space into parameter space
Using figure (1) and performing some trigonometric function ,it can be shown that the slope of the line segment AB in (x, y) space is given by :
(7) Similarly the intercept y from the right angle of triangle
OPQ is given by :
(8)
Again using equation(7) and equation (8) in general equation of straight line ,we can write:
International Journal of Innovative Technology and Exploring Engineering (IJITEE) ISSN: 2278-3075, Volume-8 Issue-12, October 2019
(9) Which further can be reduced to equation (6)
In equation(6) x and y are the constant image co-ordinates ,where r and θ are considered as variables.
Random Samples Consensus
RANSAC is a method of robust estimation which calculates the parameters of a model on the basis of random voting principles. It can perform even in the conditions when the data space containing most of the outliers. It can also deal with multiple structure data effectively .However RANSAC algorithm represents a technique for separating subset of correct matches from initial matching and help in estimation of parameter of the transformation model. RANSAC algorithm can be explained in the following four steps: Step-1: A suitable model is selected basing on the transformation model due to the difference found in between the reference image with respect to the sensed image . In order to calculate the various transformation parameter ,the required number of the matched points is calculated using equation (10):
(10)
Here,q represent the number of matched points needed to calculate the transformation parameter. And p shows the number of parameters in each transformation model. Step-2: In order to select the based model in specific iteration ,in each iteration randomly three matching points are selected to calculate transformation parameters for each iteration based on the obtained transformation parameters ,the transformation model is calculated as per equation(11):
(11)
Where a, b, c, d, e, f are the transformation parameters . x1,y1 are the coordinates of matching points in a reference image . x`,y` are the coordinates of the transformation model in the sensed image .This transformation model can again be written as: HPe ,such that H: represents transformation parameters and the matching point in the reference image is represented as (Pe).
Step-3: On being the transformation parameters are calculated for all the matching points in the reference image ,in the sensed image the distance between (Pe, HPe) is calculated .If distance is below the threshold value ,matching point is accurately merged ,otherwise ,the matched point both in reference image and sensed image gets deleted . Also here empirically the tolerance error is determined .
Step-4: In each iteration , the number of points that accurately matched is calculated .If this number of accurately matched points exceeds the desired value ,or
equal to the predetermined maximum number of iterations the algorithm stops. Lastly, based on the transformation model and the matching points having largest number of accurate matching are re-calculated.
III. PROPOSEDMODEL
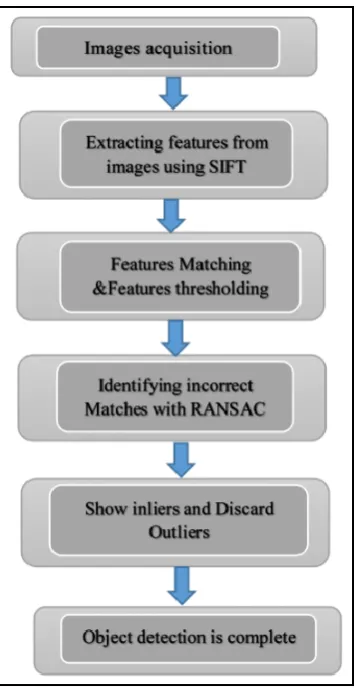
We proposed two methods for the detection goal . each one of these methods has shown effective results with good accuracy. First we proposed a method depends on both algorithms SIFT and GHT, the flow diagram of this method is shown in (Fig.2).
Fig.2. Flow diagram of object detection method 1
The proposed method follow the steps :
In this work two images has been captured with a mobile camera having specifications of (1megapixel) and resolution of (1280x720) , this two input images have been referred as the subject for the testing. Out of the two considered pictures ,one has been considered as test image and the other one as template image. After both images have been acquired properly ,the candidate images are transformed to greyscale images from their RGB nature as pre-processing step. SIFT algorithm has been applied as mentioned earlier ,for extracting features goal, and such features became scale and rotation invariant as an advantage of SIFT. As mentioned earlier from both test image and template image faces feature detection and extraction a perfect display of the matched features has been done to be worked on in GHT algorithm for applying line fitting and shape detection. After applying Hough transformation GHT is used to determine the edges of the objects as
GHT algorithms a method for bounding the detected object with bounded box is used to show the accurate box which contains the object.
The second work is we worked on the same two images , following the same first two steps in the previous work , and next after the extraction features by SIFT algorithm , it is necessary to match the keypoints from the images (test and template) it is also required to calculate the distance between two matched points and also to consider the keypoints only after thresholding which in turn plays a good role in reducing the calculation complexity. After that a robust regression algorithm RANSAC is applied to estimate the geometric transformation depending on its M-estimator procedure within intention to identify the outliers , it keeps only the inliers that is obtained through estimation process. On successful applying of RANSAC algorithm and the accurate choosing of threshold that separate inliers from outliers and also the determination of iterations number the outliers gets discarded for the best match goal , Further the image show only the inliers.
[image:4.595.80.259.327.677.2]The other used method that depends on SIFT algorithm and RANSAC algorithm, the flow diagram of this method is shown in (Fig. 3).
Fig.3. Flow diagram of object detection method 2
First proposed Method :
Generalized Hough Transform (GHT) for Object Recognition :
The general idea behind the Hough Transform is that objects are found through a voting process in a configuration or Hough space. If an evidence for a specific object configuration is found in the image, a vote is added for this configuration. In our case such evidence is a matched
feature vector from the template image to the test image. The location, orientation and scale of the feature with respect to the object's coordinate system is known from the training image, so if the feature is also found somewhere in the image, it is possible to calculate the likely location, orientation and scale of the whole object and add a "vote" for that configuration (Fig.4a). After all matched feature vectors have voted, maxima in the configuration space correspond to possible object instances (Fig.4b).In our case, the configuration (or voting) space for the object is 4-dimensional, the dimensions are x, y, and the scale and the orientation. The configuration space has to be discretized into bins to be able to accumulate votes,. If a configuration should get a vote, the vote is added to the single corresponding bin. The width of the bins (or the "grid resolution") can be chosen independently for each dimension and is crucial for the quality of the final result. If the grid is too fine, votes might spread across too many neighboring bins without a clear maximum. If on the other hand the grid is too coarse, the accuracy of the detection will be bad. For the spatial dimensions, it makes sense to set the bin size with respect to the object's dimensions, for the orientation, a coarse binning of 15-20° is a good starting point. To find a useful grid size for the scale dimension, you can check the object's dimensions in the object and the test images. Since we want to detect multiple instances of the same object, we cannot simply consider only the maximum value in the voting space! Instead.After the configurations of the objects have been found, they should be indicated by bounding boxes. The extra step is to draw a rectangle in the correct position in the image for better noted result. To display the rectangles at the correct position in the image, the coordinates first have to be transformed to the image coordinate system, according to the detected translation, scale and rotation of the object.
[image:4.595.325.526.455.638.2]International Journal of Innovative Technology and Exploring Engineering (IJITEE) ISSN: 2278-3075, Volume-8 Issue-12, October 2019
Fig. 4 (b) Hough voting space Second proposed method:
A combination of SIFT algorithm and RANSAC algorithm for extracting and accurately matched points .Firstly, feature points are extracted using SIFT that includes four main steps.
Step-1: Extreme detection of scale space where the algorithm choose extreme points of signal space as candidate feature points. The image I(x, y)scale space can be defined as mentioned in equation (1), again ,the extreme in the result of difference of Gaussian is detected and image convolution is performed as
(12) Where the symbol * represent the 2-D convolution operation Step-2: Key point localization is done by Taylor expansion in signal space of difference of Gaussian function construction:
(13) By solving this formula we get:
(14)
(15)
Step-3: Assignment of orientation :for each feature point a main direction is assigned which contains gradient magnitude m(x,y) and gradient direction θ(x,y) Where :
(16)
(17) Step-4: Finding the key points descriptors : The image region surrounding the critical point is divided into blocks ,and the gradient histogram in each block is calculated .in the end a unique 128 dimensional vector is generated. after that the main role for RANSAC algorithm is needed to remove the mismatches knowing that RANSAC algorithm follow the steps:
Step-1: The proportion of correct points that have true matches has been increased.
Step-2: A transformation function has been determined according to the projection transformation between the two images.
Step-3: Finalizing the final model regarding the RANSAC steps that mentioned earlier.
IV. RESULTANDDISCUSSION
MATLAB version R2017a has been used as software tool. One laptop with core i5 processor (2.7 GHz) and (8GB) memory RAM and Intel (R) HD graphics (4160MB total memory). the images are captured using mobile camera (1 Megapixel) and resolution of (1280x720).
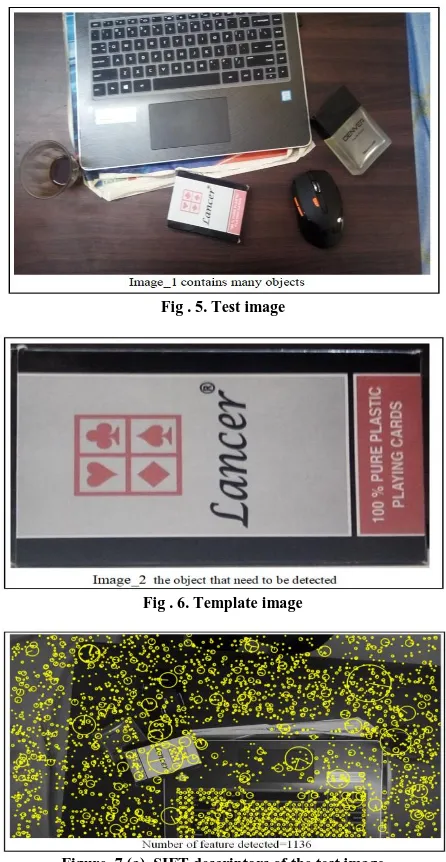
Fig.5 and Fig.6 are the candidate images that our work is done on and we referred to them as test image and template image respectively. Fig.7.a and Fig.7.b are the results of applying SIFT algorithm on both of the images which give all keypoints regarding to this algorithm.
[image:5.595.64.275.48.246.2]Fig . 5. Test image
Fig . 6. Template image
[image:5.595.315.538.262.693.2] [image:5.595.48.273.453.565.2]Fig. 7. (b) SIFT descriptors for the Template image
Fig.8. Correspondences between images
[image:6.595.308.544.212.340.2]Fig . 9. Detected object with bounding box around the object
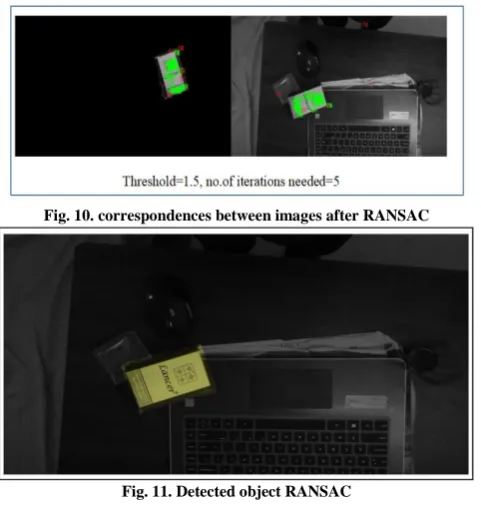
Fig. 10. correspondences between images after RANSAC
Fig. 11. Detected object RANSAC
Fig.5 and Fig.6 are the candidate images that our work is done on and we referred to them as test image and template image respectively .
Fig.7.a and Fig.7.b are the results of applying SIFT algorithm on both of the images which give all keypoints regarding to this algorithm.
It is realized that from Fig.10 that RANSAC algorithm can’t dismiss all the mismatches and few outliers remains ,but in fact this algorithm is voting procedure dependent and its result depend only on the number of inliers detected ,the final projection homography result is shown in Fig.11. When the edge threshold value is big we get more number of matches and less residual squared distance error(RMS). Table 1 show experimental results of RANSAC.
TABLE 1.RANSAC parameters with different value of thresholding
Threshold 0.5 1.5 1.9 Number of features in test
image
1136 1136 1136
Number of features in template image
111 111 111
Number of matched keypoints
111 110 74
Best number of inliers 72 70 67
Number of iterations needed
25 5 5
RMS error 1.8482 1.8482 1.0684
Correct matching rate 0.64 0.63 0.90
The peak threshold and the edge threshold values from SIFT algorithm has been chosen to limit the number of features detected to make the calculation complexity less and was taken as : peak_threshold=2, edge_threshold=15. From this table it is realized that when we increase the matched keypoints threshold we get less number of iterations and more correct inliers regarding to the total number of matches. It is clear also that correct matching ratio is also better where we got 90% ratio when we increased the threshold to the value 1.9.
One important term to show the quality of performance of RANSAC algorithm is known as standard root mean-squared error (RMS) which is calculated from this formula:
(18)
Where N represents number of inliers , the numerator represent the residual squared distance errors for all the points.
The obtained homography matrix is:
[image:6.595.50.291.464.718.2]International Journal of Innovative Technology and Exploring Engineering (IJITEE) ISSN: 2278-3075, Volume-8 Issue-12, October 2019
V. CONCLUSION
Thus an object detection has been done accurately using the two proposed models. In first proposed model ,object detection technique SIFT is followed by GHT algorithm and in the second model the GHT is replaced by RANSAC algorithm. RANSAC parameters with different values of thresholding has been obtained. Among the two proposed models, model one supposed to be superior technique for detecting objects purpose.
REFERENCES
1. Suga, K. Fukuda, T. Takiguchi, and Y. Ariki, “Object recognition and segmentation using sift and graph cuts,” in 19th International Conference on Pattern Recognition. Dec. 2008, pp. 1–4.
2. Q. Fan, K. Barnard, A. Amir, A. Efrat, and M. Lin, Matching slides to presentation videos using sift and scene background matching,” in
MIR ’06: Proceedings of the 8th ACM international workshop on Multimedia information retrieval. New York, NY, USA: ACM, 2006, pp. 239–248.
3. J. Chen and Y.-S. Moon, “Using sift features in palmprint authentication,” 19th International Conference on Pattern Recognition.
ICPR 2008, Dec. 2008, pp. 1–4.
4. F. Liu and M. Gleicher, “Region enhanced scale-invariant saliency detection,” IEEE International Conference on Multimedia and Expo, vol. 0, pp. 1477–1480, 2006.
5. Y. Ke and R. Sukthankar, “Pca-sift: a more distinctive representation for
local image descriptors,” in 2004 IEEE Computer Society Conference on Computer Vision and Pattern Recognition, vol. 2, 2004, pp. 06– 513.
6. Y. Cui, N. Hasler, T. Thormählen, and H.-P. Seidel, “Scale invariant feature transform with irregular orientation histogram binning,” in
ICIAR ’09: Proceedings of the International Conference on Image Analysis and Recognition. Springer, 2009.
7. D.H. Ballard “Generalizing the Hough Transform to detect arbitrary shapes”,Pattern Recognition, Vol. 13, No. 2,pp. 111-122,1981. 8. J. Illingworth and J. Kittler “A Suvey of the Hough Transform”
CVGIP 44, pp 87-116, 1988.
9. P. Hough. Method and means for recongnizing complex patterns. U.S Patent 3,069,654, 1962.
10. Kimura and T. Watanabe. An extension of the generalized hough transform to realize affine-invariant two-dimensional (2d) shape detection. In 16th International Conference on Pattern Recognition ICPR, volume 1, page 10065, 2002.
11. N. Kiryati, Y. Eldar, and A. Bruckstein. A probabilistic hough transform. Pattern Recognition, 24(4):303–316, 1991.
12. P. Kultaken, L. Xu, and E. Oja. A new curve detection method: randomized hough transform. Pattern Recognition Lett, 11:331–338, 2002.
13. H. Li, M. A. Lavin, and R. J. L. Master. Fast hough transform: A hierarchical approach. Computer Vision, Graphics, and Image Processing, 36(2-3):139–161, 1986.
14. M. A. Fischler and R. C. Bolles, “Random sample consensus: A paradigm for model fitting with applications to image analysis and automated cartography,” Comm. Assoc. Comp. Mach, vol. 24, no. 6, pp. 381–395, 1981.
15. O. Chum and J. Matas, “Matching with PROSAC - progressive sample consensus,” in Proc. IEEE Conf. on Computer Vision and Pattern Recognition, San Diego, CA, volume 1, June 2005, pp. 220– 226.
16. D. Nister, “Preemptive RANSAC for live structure and motion estimation,” in Proc. 9th Intl. Conf. on Computer Vision,Nice, France, volume I, October 2003, pp. 199–206.
17. P. H. S. Torr and D. W. Murray, “The development and comparison of robust methods for estimating the fundamental matrix,”
International J. of Computer Vision, vol. 24, no. 3, pp. 271–300, 1997.
18. P. H. S. Torr and A. Zisserman, “Robust parameterization and computation of the trifocal tensor,” Image and Vision Computing, vol. 15, pp. 591–605, August 1997.
19. P. H. S. Torr and A. Zisserman, “MLESAC: A new robust estimator with application to estimating image geometry,” Computer Vision and Image Understanding, vol. 78, pp. 138–156, 2000.
20. R. I. Hartley and A. Zisserman, Multiple View Geometry in Computer Vision. Cambridge University Press, 2000.
AUTHORSPROFILE
RAMMAH YOUSEF was born in Latakia, Syria in 1994. He received the B.in Mechatronics engineering from Tishreen University in 2017.He is currently studying M.Tech in Communication Engineering in KIIT University, Bhubaneswar, India.
Pranaw Kumar is an Assistant Professor in School of Electronics Engineering, Kalinga Institute of Industrial Technology University, Bhubaneswar, Odisha, India. He completed his PhD from Kalinga Institute of Industrial Technology University, Bhubaneswar. He received his Master of Technology in Communication Engineering in 2012 from MNIT Jaipur. He is a member of OSA, SPIE, and Life-member of Indian Science Congress Association. He is also an IEEE student member. His research interests include photonic crystal fibers, optical communication, microstrip antenna, communication, and signal processing. He has published approximately 120 papers in international journals and conferences in the aforementioned research areas. He serves as a reviewer for many international journals.
.