Abstract: crop type identification timely and accurately is one of the applications of remote sensing (RS). It assists the people to regulate the variations in the costs of the food grains. RS images are utmost beneficial for agricultural productions. Recent research methodologies focuses mainly on the crops classification using satellite RS image. This paper proffers the survey on crop detection and classification utilizing RS images. This paper also highlights the latest studies regarding the implementation of crop detection and classification techniques like, review on disparate methodologies for crop recognition and classification (different classifiers are used to detect the crop), review on crop conditions monitoring system, and review on identification of yield estimation , crop region, and also crop growth. At last, the performances of the state-of-art methods are contrasted centered on the Kappa coefficient metrics and overall accuracy. Here, accuracy is the notable metric in the crop identification system.
Keyword: RS images, state-of-art
I. INTRODUCTION
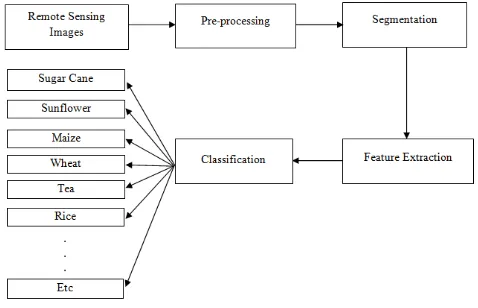
Agricultural sector benefits increasingly as of the services such us, informatics and satellite technology which have substantial contributions lately [1]. RS has an imperative role in proffering the land coverage mappings and in classifying the land cover features which chiefly encompasses water bodies, roads, vegetation, etc [2]. Crops identification as of RS images is necessary because RS images are regarded as input for agricultural and economic planning by government and private agencies. The crop classification system is delineated in detail using the flow diagram evinced in Fig 1,
[image:1.595.44.283.513.667.2]
Figure 1: General flow diagram for the crop identification system
The Agricultural Monitoring Community of Practice of the
Revised Manuscript Received on October 22, 2019.
N.V.S Natteshan, Research Scholar, School of CSE, VIT University, Vellore, [email protected]
Dr. N. Suresh Kumar, Associate Professor, School of CSE, VIT University, Vellore, [email protected]
Group on Earth Observations (GEO), with its Integrated Global Observing Strategy (IGOL), also utilizes RS Images for an operational system for monitoring global agriculture [3]. Existing satellite sensors like LISS (IRS series), LANDSAT, AWIFS, SPOT 5, and also MODIS are the good sources of multi-spectral data with disparate SRs, whereas, AVIRIS, Hyperion and Hy-Map are the sources of hyper-spectral data [4].
One of such tasks is crop identification utilizing satellite images. The solution of this task is imperative for such events [5]:
control of croplands usage, real-time monitoring,
Mapping land usage in regions with no information as of the farmers about crops seeded on fields.
verification of information rendered by farmers about crops seeded on fields,
Accurate crop identification utilizing derived information as of earth observation satellites could contribute to the elevated resource usage and assists in timely agricultural planning. Crop type recognition and crop area assessment being practiced are centered on moderate resolution satellite data with an SR as of 23.5m to 250m [6]. Crop identification and classification utilizing certain images is expounded in the below steps,
1.1 Crop detection using SAR images
Land resource allocation and Cropland surveillance are critical for ensuring a food supply to provide food for the global populace of over 7billion people. As an all-weather, all-time observation tool, SAR (Synthetic Aperture Radar) is developing rapidly with the recent launches of several space-borne satellites, such as Sentinel-1, Chinese Gaofen-3, and India Risat-1, among others.
SAR images are utilized in a) Monitoring of Kharif Crops, b) early detection of drought, c) flood mapping as part of disaster mining and relief operation, d) huge area soil moisture mapping for Hydrological applications (flood and drought), e) Biomass estimation in forests (also forest type and density), f) accurate DEM generation in terrain analysis, g) Land movement (for earthquake studies and land subsidence) and h) oceanography for Oil Spills, Sea State, Waves, Coastal Bathymetry [12].
1.2 Crop detection using MODIS Data
A 30-days time series of 8-days composite MODIS 500m reflectance data (MOD09A1), ranging from 7 April to 25
Crop Detection and Classification using Remote
Sensing Images
November 2013 was generated for Kansas. Data were needed as of ‘4’ MODIS tiles (h09v05, h09v04, h10v05, and h10v04) for state-wide coverage. The tiled MODIS data was attained as of the LP-DAAC (Land Process- Distributed Active Archives Centre), re-projected as of the Sine format to UTM projection (WGS 84zone 14N), and subset across Kansas for every time period which is composite in nature and also eventually piled-up to create the time series dataset [13].
1.3 Crop detection using UAV images
Unmanned aerial vehicle (UAV) imageries render thematic information at higher temporal resolution and spatial resolution (SR) rather than the images from satellite that pocess high potential in classifying the crops. With respect to the UAV’s SR, contextual data (textures) in the spatial domain are often utilized for crop classification [14]. Typical application domains of UAVs comprise environmental, vegetation, urban, or disaster monitoring [15], precision agriculture, rangeland monitoring and land cover mapping in the agricultural domain [16].
1.4 Crop detection using SPOT images
A SPOT 5 multi-spectral scene of image spanning to a 60km by 60km area in the Rio Grande Valley of South Texas was attained when images for a considered region were clicked at the discrimination period [17].
II. RELATED WORK
This section surveys the recent literature works in the crop detection domain and classification, crop monitoring, and identification of crop growth, and yield area estimation which are expounded in the below sub-sections.
2.1 Review on different methodologies for crop identification and classification
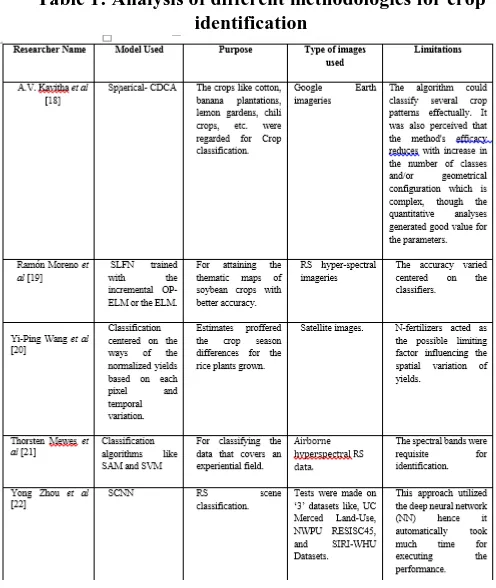
A.V. Kavitha et al [18] suggested an unsupervised algorithm termed Spherical-CDCA (Contact Distribution Classification Algorithm) for effectually classifying the crop's image. The Spherical -CDCA utilized the spherical contact distributions, 1st -order statistics and mathematical morphology. In the preliminary step, the textural features were extorted by assessing the contact which is spherical disseminations of each pixel. In the secondary step, the feature vectors extorted were categorized to exhibit a classified image. Two sorts of tests were conducted for classification. One was supervised classification, where some training set was recognized and all the pixels were categorized centered on the training set utilizing a nearest neighbor algorithm. The test on unsupervised classification did not utilize any training set. Later, SCDCA was contrasted with linear -CDCA.
Ramón Moreno et al [19] pondered on employment of ELM (Extreme Learning Machines) to the image classification of RS hyper-spectral data. Firstly, spectral data were transmuted into hyper-spherical representations. Secondly, an image gradient which is robust was computed over that representation letting an image segmentation which
recognizes crop plots which is major. Thirdly, feature selection was attained by a greedy wrapper methodology. Lastly, a classifier was trained and also tested on the chosen features of image pixel. The classifier utilized for selection of features and classification was the eminent SLFN (Single Layer Feedforward Networks) which is trained with the incremental OP-ELM or ELM. Actual features of image pixel were normally obtained after the FDA (Functional Data Analysis) of the spectral data characterization.
Yi-Ping Wang et al [20] introduced the system to identify and characterize the limiting the production aspects in paddy areas since the required crop/year season-yield-maps could be obtained as of the satellite images with historical data. Spatio-temporal production-trend maps with inconsistent low, high, and average yields, and also improper yield regions was elucidated centered on variation with respect to time or yield which is normalized on a pixel-by-pixel basis. Plant and Soil samples are utilized and clustered for statistic analysis centered on the aforesaid yield-trend maps.
Thorsten Mewes et al [21] examined the effects of selection of features and decreasing the resolution of the spectrum on the accuracy in classification of healthy and wheat plants that are infected. This approach analyzed a single air-borne hyper-spectral HyMap data set for its competency to spot plant’s stress symptoms on wheat-stands caused due to pathogens. The classification algorithms like SAM (Spectral Angle Mapper) and SVM (Support Vector Machines) were utilized to categorize the covering of the data on an experiential field. To perceive influences of the spectral resolution of crop detection accurateness, the dataset used were spectrally re-sampled and the features were selected from all steps.
Yong Zhou et al [22] propounded joint decision-making along with rotation-invariant feature learning methodologies centred on the SCNN (Siamese convolutional neural networks) which integrate the verification and also identification models. This methodology could not only reduces issues caused by a deficiency of label samples but also ameliorate the fault tolerant nature of SCNN. Experiential outcomes elucidated that this methodology was effectual for RS scene classification.
Table 1: Analysis of different methodologies for crop identification
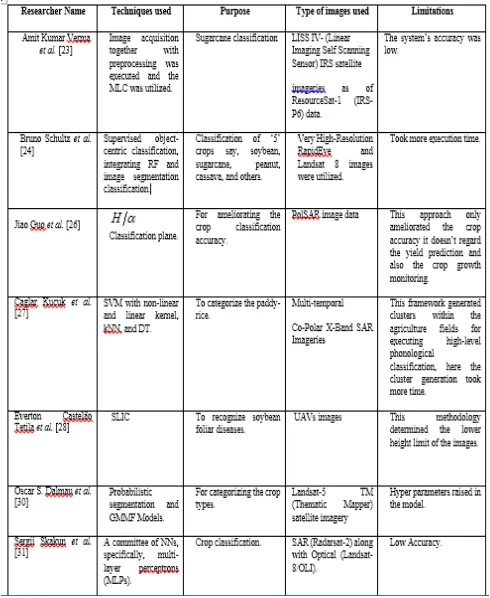
Gauss Markov Measure Field (GMMF) design, in which the data and regularization terms comprise a weight function that permits combining disparate feature spaces, in a manner that information sources with least entropy probability distribution contributed more in the classification process. This approach regarded contextual and punctual spatial information. The weight Amit Kumar Verma et al [23] paved attention on a framework to employ the ISODATA, MLC (Maximum Likelihood Classifier), and decision tree (DT) methodologies for sugarcane recognition. Grounded on results, it could be deduced that MLC and ISODATA algorithms were excellent for separating non-crop areas (water, built-up and fallow land) but could not categorize sugarcane crop regions with acceptable accurateness. These methodologies could not attain better classification accurateness owing to overlapping spectral features with the other classes whilst vegetation indices (VI) –centric DT framework has great competency for recognizing the sugarcane areas.
Bruno Schultz et al [24] presented and assessed a framework of the combined utilization of image’s classification and segmentation with the target to ameliorate object-centric crop type mapping whilst minimizing inputs of the operator. This work introduced a completely autonomous work-flow for the supervised object-centric classification, integrating RF (random forest) classification and image segmentation. This framework separated ‘5' classes say, soybean, sugarcane, peanut, cassava, and others. Amongst the ‘5' classes, soybean and sugarcane were excellently classified, whilst peanut and cassava were frequently mis-classified owing to higher within-class variabilities and similar
spatio-temporal feature space.
Mark W. Liu et al [25] presented a framework for crop-type classification that utilizes information as of images of disparate temporal and spatial resolutions simultaneously, by exploiting their strengths. The solution was executed and experimented on the real along with synthetic data set as a proof of concept. This elevation in the accuracy was approximately equivalent to supplementary high-resolution images to the temporal stack during the classification process.
Jiao Guo et al [26] ameliorated the classification of crop accurateness with disparate features of classical parameters. Firstly, the decomposition algorithm for quad-PolSAR was modified to cope with the dual-PolSAR (PolSAR - Polarimetric synthetic aperture radar) data and also to match with the dual-polarization. Secondly, as per the differential scattering features of main crops, a parameter was provided to gauge the differential features in the classification plane. Thirdly, the considered crop types were distinguished by employing a supervised classification framework with the provided parameter. Lastly, the classification performances were examined by contrasting with complex SVM, Freeman–Wishart, together with Wishart classifiers.
Caglar Kucuk et al. [27] build a viable phenology classification framework for categorizing paddy-rice utilizing multi-temporal co-polar TerraSAR-X images. The aforesaid classification was done utilizing SVM with nonlinear and linear kernel, DT and k-nearest neighbors (kNNs). The chief implementation challenges say the total of classes, the selection of polarimetric and textural features and the recognition of the boundaries of classes, were deeply examined. The outcomes facilitated an individual to draw an inference about the feasibility of ML (machine learning) algorithms in an operational phenology monitoring.
Everton Castelão Tetila et al. [28] recommended a framework centered on a segmentation approach. Simple Linear Iterative Clustering (SLIC) recognized the soybean foliar diseases utilizing Unnamed Aerial Vehicle Images (UAVs). The SLIC segmentation algorithm detected the leaves in the images as visual attributes for delineating the features of the foliar physical features, like, texture, gradient, color, and shape. This methodology assessed the performance of ‘6’ classifiers for disparate heights, encompassing 1, 2, 4, 8, and 16m. Experiential outcomes corroborated that the color and texture attributes brought higher classification rates, attaining the precision of 98.34% for heights between 1 and 2m, with a decay of 2% at every meter. Outcomes signified that this approach could support adepts and farmers to perceive diseases in soybean fields.
Jefersson Alex dos Santos et al [29] propounded a methodology for interactive RS image classification concerning the multi-scale segmentation. The framework encompasses ‘3’ chief processing modules: i) segmentation, ii) feature extortion, and iii)
This approach utilizes a increasing-centric learning approach which is active in nature to choose regions at disparate scales for user’s relevance feedback. Its notion was to select the areas that were nearer to border which separates the classes of the target: non-relevant and relevant regions. Experiential outcomes evinced that this scales of combination attained somewhat best outcomes on considering the isolated scales in relevance feedback.
Oscar S. Dalmau et al [30] suggested a generalization of the function of the next term permitted to control the edges betwixt classes attaining a robust potential centered on the likelihoods. This framework’s performance was assessed in satellite images for categorizing disparate crops.
Sergii Skakun et al [31] paved attention on appraising the efficacy and exploring the viability of utilizing multi-temporal satellite SAR (synthetic-aperture radar) attained in optical and C-band images for classifying crops in Ukraine. The SAR (Radarsat-2) and optical (Landsat-8/OLI) images were utilized to appraise the impacts of addition of intensity that is backscattered as of images from Synthetic Aperture Radar for the classifying purpose. A collection of Neural networks, particularly perceptrons in Multi Layer (MLPs), was used to ameliorate classification accurateness contrasted to numerous standard classifiers. It was found that utilizing backscatter coefficients as of SAR images only proffered the similar performances for winter crops (rapeseed and wheat) as reflectance of the surface as of optical images. Concerning the crops cultivated in summer, the chief impacts were in excellent separation of maize sunflower and soybeans.
M. Cruz-Ramírez et al [32] proffered a multi-objective NN centered framework for classifying of bare soil (BS), olive trees (OT), and disparate cover crops (CC), utilizing RS data taken in summer and spring. These system models well-performed in every season especially at the time of summer, where just 48 pixels of CC were bewildered with BS and 10 pixels of BS were bewildered with CC. This model acquired a 97.8% of global classification, 0.971 in the KAPPA statistics and 95.2% in the class with the least classification rate, and the best-performing designs could diminish the complaint rate made to the European and Andalusian administrations.
Henning Skriver et al [33] paved attention on the statistical frameworks utilizing ‘3’ data like a) single-polarization data (SPD), b) dual-polarization data (DPD), and c) fully polarimetric data (FPD). They were utilized in the analysis (FPD was only existent at band of L). The main outcomes for analysis were, multi-temporal acquitances which were extremely for SPD-and DPD modes and backscatter which is cross-polarized which yielded the excellent outcomes, with errors down to 3% - 6% at the ‘2’ frequencies.
Disparate methodologies for the crop identification and classification systems are discussed in table 2,
Table 2: Analysis of different methodologies for crop identification
2.2 Review on crop condition monitoring systems
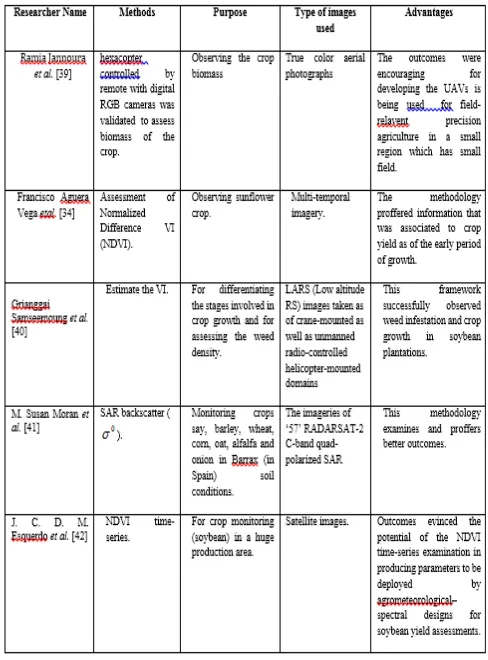
Francisco Aguera Vega et al [34] examined the competency of a UAV carrying a multi-spectral sensor to attain multi-temporal images at the time of growing seasons of a sunflower. Whilst computing linear regressions, its correlation coefficients fitted betwixt grain yields and NDVI. Aerial biomass and also Nitrogen contents in them were statistically imperative except during their growing season. Hence, the NDVI which was estimated as of images with a G, R and NIR sensor equipped on a UAVs or attained in the R1 stage (while the floral button perceived in R5 (full Anthesis)), could be utilized to spot the differences existent in the grain yield.
Caili Guo et al [35] recommended a prediction of wheat growth methodology by integrating the Wheat Grow model (WGM) and the PROSAIL, centered on partition of zones. This technology partition was introduced by blending indices of soil nutrient with their respective spatial features of wheat growths, as specified by RS data. A model that integrated RS data and the WGM by utilizing the parameters like NDVI, RVI, SAVI and EVI as respectively was centered on the PSO algorithm (Particle Swarm Optimization). PROSAIL framework was introduced for realizing the accurate predictions of WGM parameters and also grain yields at a spatial scale. Each index differs between the defined subzones, specifying relevant partitioning was attained.
Juliane Bendig et al [36] scrutinized the appropriateness of VI and plant height in the
[image:4.595.314.559.91.390.2]region in their suitability for predicting the biomass in summer. The statistic analysis corroborated that the GnyLi near-infrared index was an apt indicator for biomass and derived plant UAV height as of surface models of the crop. Secondly, there was a potential in estimating the biomass by integrating visible band VI say GRVI (Green Red VI), RGBVI (Red Green Blue VI) and MGRVI (Modified Green Red VI) with plant height. This framework collaborated that the band which is visible VI proffered a alternate competency to design of early growth stages of biomass in contrast to the late growth stages. In contradiction to expectation, the integration of VI and height of the plant did not notably ameliorate the performance of the model.
Mengmeng Du and Noboru Noguchi [37] corroborated the possibility of employing multi-temporal color imageries attained as of a lower altitude UAV-camera for monitoring the instantaneous status of wheat growths and for mapping within-field spatial variations of yield for small-level wheat growers and this would be a reference for field-associated operations. The Orthomosaic imageries were referenced geographically so that supplementary work on step-wise analysis of regression amongst ‘9’ yield samples of wheat and ‘5’ color VI (CVI) could be taken, wherein it confirms that wheat yields and ‘4’ accumulative CVIs like VDVI (Visible-Band Difference VI), NGBDI (Normalized Green-Blue Difference Indices), GRRI (Green-Red Ratio Indices), and ExG (Excess Green VI) were correlated, with the coefficient of RMSE and determination as 0.02 and 0.94, respectively. Lastly, grounded on the stepwise regression design, an estimated wheat yield map was created hence within the span of variations of wheat yield in the field spatially, that was normally viewed as common details on water potential, fertility of the soil, density of the tiller can be comprehended for the mechanism of variable-rate or field-specific operations.
Bingfang Wu et al [38] delineated a hierarchical methodology of global crop monitoring that exploited the development in the satellite RS and its derivatives, as considered in the most current modified Crop Watch scheme in which typical applications and distinctive features were proffered. The hierarchical methodology in Crop Watch replaced the classical country-centric framework to global monitoring and undertook disparate scales for diverse indicators. Monitoring of the crop globally in Crop Watch was not now a simpler group of information and national methodologies.
[image:5.595.314.558.51.381.2]Disparate crop monitoring systems and their merits are delineated in Table 3,
Table 3: Analysis of different crop monitoring system
2. 3 Review on identification of crop growth, crop area and yield estimation
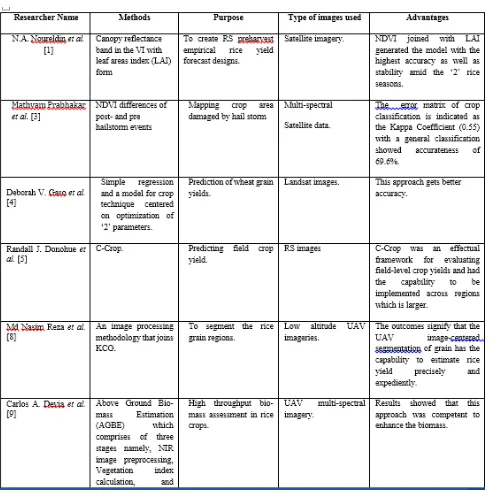
N.A. Noureldin et al. [43] propounded a rice yield predicting designs utilizing satellite imageries taken in Egypt. This method utilized the canopy reflectance band or disparate band ratios as VI with LAI (leaf area indices) for creating RS pre-harvest experiential rice yield prediction designs. Factor which is remotely sensed were utilized distinctly and also at the integration with LAI to generate the designs. The outcome showed that green spectral band, green VI (GVI) and middle infra-red spectral band didn’t signify sufficient capability as rice yield estimators whilst other inputs say, near infra-red and red spectral bands and VI that were algebraic ratios as of those 2 spectral bands when utilized individually or in integrated with LAI create accurate rice yield assessment designs. The validation process was executed utilizing 2 tests of statistical nature like, correlation coefficient and the standard error of estimate between predicted yield and the yield which is modelled. The outcomes of validation evinced that utilizing (NDVI) integrated with LAI created the design with high stability and accurateness during the ‘2’ rice seasons.
resolution LISSIV satellite information as of IRS Resourcesat-2. The 6 hailstorm-damaged streaks differ in length as of 6km to 33km and width as of 3km to 8km. The maximum area destructed in grapes, trailed by papaya and sugarcane. The crop classification error matrix showed the Kappa Coefficient with a general classification accurateness around 70 percent.
Deborah V.Gaso et al [45] projected to compute 2 disparate techniques centered on RS data to predict the wheat yield during winter season at the field scale. Successively, the accuracy of: (i) a simpler regression technique between disparate VI at anthesis and yield of grains, and (ii) A design method for crops centered on enhancement of 2 factors (aboveground-biomass along with specific leaf nitrogen) utilizing time series of VI were compared. Normally, VI was obtained from Landsat-8 OLI (operational land imager) and Landsat-7 ETM+ (enhanced thematic mapper +) images acquired for 2 growing seasons (2013 and 2014) over 22 fields in southwestern Uruguay accompanied by 128ha average size. At the entire site, the grain yields were calculated by the harvesters with certain monitoring for yeild and the LAI (Leaf area indices) was gauged through field campaigns. The SRM (simpler regression method) obtained a accuracy which is higher than the model centered approach (CMM) for the approximation of field level yield (RMSE= 966 and RMSE=1532, correspondingly).
Randall J. Donohue et al [46] established a crop yield at the level of field range design termed as C-Crop. It was locally calibrated and hence, it has accurateness at the field level. Its input information could be remotely (say, air temperature, crop types, and foliage cover) inferred.
Chunyuan Diao [47] projected to determine crop phenological phases with satellite time series utilizing a network-centered phenological design. The innovative phenol-network (IPN) design was non-parametric without mathematically defined phonological assumptions and could be created with partial-year RS data. As rooted in network theory, this design describes the complex phenological technique with spectrally defined edges and nodes. It offers a network representation to design the temporal dynamics of spectral reflectance of crops along the phonological trajectory. This projected technique was contrasted to conventional phonological techniques. The nonparametric pheno-network design doesn't make mathematical assumptions of crop phenological procedures and could be created with partial-year RS data. A great promise was shown from a phenol-network design with those unique characteristics to ameliorate the phenological monitoring in an intensified agriculture system.
Teodoro Semeraro et al [48] examined the correlations of few VI in respect of the wheat canopy (durum), computing 2 disparate phonological stages (maturity and elongation). The outcome illustrated that in the 1st stage of growth
Md Nasim Reza et al. [49] projected an image processing
method that integrates K-means clustering with a graph-cut (KCG) algorithm for segmenting the rice gain areas. To remove the foregrounds together with the backgrounds of an image, a graph cut algorithm was implemented. The foreground RGB images were transmuted into the Lab color space. The K-means clustering was utilized to label pixels centered on color information. As of those clustered images, the area of the rice grains was computed. To assess the rice yield of the field, the grain area data was utilized. The experiment demonstrated that this method could segment the grain areas with a relative error of 6%-33%, and it improved the relative error of the previous method (by 1%-31%). The coefficient of determination betwixt the ground truth and the outcomes of this method were found to be 0.98.
Carlos A. Devia et al [50] bestowed a high-throughput technique for AGBE (Above ground estimation of biomass) in rice utilizing multispectral NIR (near-infrared) imagery clicked at disparate scales of the crop. By creating an integrated aerial crop monitoring solution (IACMS) utilizing a UAV (Unmanned Aerial Vehicle), this method computes 7 VI that were combined as multi-variable regressions relying on the rice growth phases: vegetative, ripening or reproductive. By utilizing a minimum sampling area of 1 linear meter of the crop, this concept was measured. Under the lowland and upland production system, a comprehensive experimental test has been carried out over 2 different rice varieties. The output showed that this approach was able to estimate the biomass of large areas of the crop with an average correlation of 0.76 contrasted to the conventional manual destructive method.
Isidro Campos et al [51] examined the abilities of meteorological data and RS for mapping the variability’s of biomass or yield in cultivated wheat. A common easy design based on water productivity was obtained by integrating a time series of RS-centric VI. The output of this design was examined in respect of absolute values and within-field variability’s concerning space continual measurements of biomass and yields. The variability recorded in all fields was measured as the ratio betwixt biomass (or) actual yield in a given area along with the average value for the examined variable in all fields. The potential of those approaches would regenerate variability even in stress conditions which were illustrated by good correlation among modeled and measured variability. This method defined differences in crop growth comparable to the ground measurements.
Table 4: Analysis of identification of crop growth, crop area, and yield estimation
[image:7.595.48.293.96.344.2]The comparison of the proposed with the top-notch methods was demonstrated in the below table 5,
Table 5: Comparison on the overall accuracy and kappa coefficient of various methods. State-of-art
Methods
Overall Accuracy (%)
Kappa coefficient
(%)
OP-ELM [19] 88.6 81.5
Yong Zhou et al. [22]
94.48 93.8
Bruno Schultz
et al. [24]
85 78
Jiao Guo et al. [26]
78.09 69.45
Oscar S. Dalmau et al.
[30]
86.49 79.93
Discussion: Table 5 delineates the performance shown by the state-of-art methods centered on the overall accuracy in addition to the kappa coefficient. The Yong Zhou et al. [22] provided the better accuracy (i.e.,) 94.48% comparing with the other methods and also it provides the highest kappa coefficient, which uses the Siamese CNN for classification. Then, the Jiao Guo et al. [26] gives the worst performance contrasted to the other top notch methods which give 78.09% accuracy and 69.45% kappa coefficient. Hence, this discussion shows that if the classifier has deep layers, then it
would produce a better result. The graphical representation of this table value is shown in below Figures 2 and 3.
[image:7.595.312.568.112.326.2]
Figure 2: Overall Accuracy comparison of various methods
[image:7.595.59.279.398.652.2]
Figure 3: Kappa coefficient comparison of various Methods
III. .CONCLUSION
REFERENCES:
1. Mihai Hrebei and Florin Sala, “Classification of land and crops based on satellite images landsat 8: case study SD timisoara”, Bulletin of University of Agricultural Sciences and Veterinary Medicine Cluj-Napoca, Agriculture, vol. 73, no. 1, pp. 29-34, 2016.
2. Beeresh H V, Latha G Thimmaraja Yadava, and Naveen Dandur, “An approach for identification and classification of crops using multispectral images”, International Journal of Engineering Research, vol. 3, no. 5, 2014.
3. Mariana Belgiu and Ovidiu Csillik, “Sentinel-2 cropland mapping using pixel-based and object-based time-weighted dynamic time warping analysis”, Remote sensing of environment, vol. 204, pp. 509-523, 2018.
4. Rajesh K D, Rajendra Y D, Kale K V and Mehrotra S C, “Classification of crops from remotely sensed Images: AnOverview”, International Journal of Engineering Research and Applications, vol. 3, no. 3, pp. 758-761, 2013.
5. Vorobiova N S, “Crops identification by using satellite images and al-gorithm for calculating estimates”, In CEUR Workshop Proceedings, vol. 1638, pp. 419-427, 2016.
6. Jagadeeswaran R, Poornima A and Kumaraperumal R, “Mapping and classification of crops using high resolution satellite image”, Journal of Applied and Natural Science, vol. 10, no. 3, pp. 818-825, 2018. 7. Lei Xie, Hong Zhang, Hongzhong Li, and Chao Wang, “A unified
framework for crop classification in southern China using fully polarimetric, dual polarimetric, and compact polarimetric SAR data”, International Journal of Remote Sensing, vol. 36, no. 14, pp. 3798-3818, 2015.
8. Arantzazu Larrañaga, , and Jesús Álvarez-Mozos, “On the added value of Quad-Pol Data in a multi-temporal crop classification framework based on RADARSAT-2 imagery”, Remote Sensing, vol. 8, no. 4, pp. 335, 2016.
9. Xianfeng Jiao, Heather McNairn, Jiali Shang, Elizabeth Pattey, Jiangui Liu, and Catherine Champagne, “The sensitivity of RADARSAT-2 polarimetric SAR data to corn and soybean leaf area index”, Canadian Journal of Remote Sensing, vol. 37, no. 1, pp. 69-81, 2011.
10. Onur Yuzugullu, Esra Erten, and Irena Hajnsek, “Rice growth monitoring by means of X-band co-polar SAR: feature clustering and BBCH scale”, IEEE Geoscience and Remote Sensing Letters, vol. 12, no. 6, pp. 1218-1222, 2015.
11. Hoa Phan, Thuy Le Toan, Alexandre Bouvet, Lam Nguyen, Tien Pham Duy, and Mehrez Zribi, “Mapping of rice varieties and sowing date using X-Band SAR data”, Sensors, vol. 18, no. 1, pp. 316, 2018. 12. Geetha Nagraj M and Asha Gowda Karegowda, “Crop Mapping using SAR Imagery: an review”, International Journal of Advanced Research in Computer Science, vol. 7, no. 7, 2016.
13. Pengyu Hao, Yulin Zhan, Li Wang, Zheng Niu, and Muhammad Shakir, “Feature selection of time series MODIS data for early crop classification using random forest: A case study in Kansas, USA”, Remote Sensing, vol. 7, no. 5, pp. 5347-5369. 2015.
14. Geun-Ho Kwak, and No-Wook Park, “Impact of Texture Information on crop classification with machine learning and UAV Images”, Applied Sciences, vol. 9, no. 4, pp. 643, 2019
15. Gonzalo Pajares, “Overview and current status of remote sensing applications based on unmanned aerial vehicles (UAVs)”, Photogrammetric Engineering & Remote Sensing, vol. 81, no. 4, pp. 281-330, 2015.
16. Mozhdeh Shahbazi, Jérôme Théau and Patrick Ménard, “Recent applications of unmanned aerial imagery in natural resource management”, GIScience & Remote Sensing, vol. 51, no. 4, pp. 339-365, 2014.
17. Zia Ul Qayyum, Asma Akhtar, Sohail Sarwar, and Muhammad Ramzan, “Optimal feature extraction technique for crop classification using aerial imagery”, In 2013 International Conference on Information Science and Applications (ICISA), pp. 1-5, IEEE, 2013. 18. Kavitha A V, A. Srikrishna, and Ch Satyanarayana, “Crop image classification using spherical contact distributions from remote sensing images”, Journal of King Saud University-Computer and Information Sciences, 2019.
19. Ramón Moreno, Francesco Corona, Amaury Lendasse, Manuel Graña, and Lênio S. Galvão, “Extreme learning machines for soybean
classification in remote sensing hyperspectral images”, Neurocomputing, vol. 128, pp. 207-216, 2014.
20. Yi-Ping Wang, Shou-Hung Chen, Kuo-Wei Chang, and Yuan Shen, “Identifying and characterizing yield limiting factors in paddy rice using remote sensing yield maps”, Precision agriculture, vol. 13, no. 5, pp. 553-567, 2012.
21. Thorsten Mewes, Jonas Franke, and Gunter Menz, “Spectral requirements on airborne hyperspectral remote sensing data for wheat disease detection”, Precision Agriculture, vol. 12, no. 6, pp. 795, 2011.
22. Yong Zhou, Xuning Liu, Jiaqi Zhao, Ding Ma, Rui Yao, Bing Liu, and Yi Zheng, “Remote sensing scene classification based on rotation-invariant feature learning and joint decision making”, EURASIP Journal on Image and Video Processing, no. 1, pp. 3, 2019. 23. Verma A K, Garg P K and Prasad K H, “Sugarcane crop identification from LISS IV data using ISODATA, MLC, and indices based decision tree approach”, Arabian Journal of Geosciences, vol. 10, no. 1, pp. 16, 2017.
24. Bruno Schultz, Markus Immitzer, Antonio Formaggio, Ieda Sanches, Alfredo Luiz, and Clement Atzberger, “Self-guided segmentation and classification of multi-temporal landsat 8 images for crop type mapping in southeastern Brazil”, Remote Sensing, vol. 7, no. 11, pp. 14482-14508, 2015.
25. Mark Liu W, Mutlu Ozdogan, and Xiaojin Zhu, “Crop type classification by simultaneous use of satellite images of different resolutions”, IEEE Transactions on geoscience and remote sensing, vol. 52, no. 6, pp. 3637-3649, 2013.
26. Jiao Guo, Peng-Liang Wei, Jian Liu, Biao Jin, Bao-Feng Su, and Zheng-Shu Zhou, “Crop classification based on differential characteristics of $ H/\alpha $ scattering parameters for multitemporal quad-and dual-polarization SAR images”, IEEE Transactions on Geoscience and Remote Sensing, vol. 56, no. 10, pp. 6111-6123, 2018.
27. Çağlar Küçük , Gülşen Taşkın, and Esra Erten, “Paddy-rice phenology classification based on machine-learning methods using multitemporal co-polar X-band SAR images”, IEEE Journal of Selected Topics in Applied Earth Observations and Remote Sensing, vol. 9, no. 6, pp. 2509-2519, 2016.
28. Everton Castelão Tetila, Bruno Brandoli Machado, Nícolas Alessandro de Souza Belete, David Augusto Guimarães and Hemerson Pistori, “Identification of soybean foliar diseases using unmanned aerial vehicle images”, IEEE Geoscience and Remote Sensing Letters, vol. 14, no. 12, pp. 2190-2194, 2017.
29. Jefersson Alex Dos Santos, Philippe-Henri Gosselin, Sylvie Philipp-Foliguet, Ricardo da S. Torres and Alexandre Xavier Falcao, “Interactive multiscale classification of high-resolution remote sensing images”, IEEE Journal of Selected Topics in Applied Earth Observations and Remote Sensing, vol. 6, no. 4, pp. 2020-2034, 2013.
30. Oscar Dalmau, Oscar, Teresa Alarcón and Francisco Oliva, “Crop classification in satellite images through probabilistic segmentation based on multiple sources”, Sensors, vol. 17, no. 6, pp. 1373, 2017. 31. Sergii Skakun, Nataliia Kussul, Andrii Yu Shelestov, Mykola
Lavreniuk and Olga Kussul, “Efficiency assessment of multitemporal C-band Radarsat-2 intensity and Landsat-8 surface reflectance satellite imagery for crop classification in Ukraine”, IEEE Journal of Selected Topics in Applied Earth Observations and Remote Sensing, vol. 9, no. 8, pp. 3712-3719, 2015.
32. Manuel Cruz-Ramírez, César Hervás-Martínez, Montserrat Jurado-Expósito and Francisca López-Granados, “A multi-objective neural network based method for cover crop identification from remote sensed data”, Expert Systems with Applications, vol. 39, no. 11, pp. 10038-10048, 2012.
33. Henning Skriver, Francesco Mattia, Giuseppe Satalino, Anna Balenzano, Valentijn RN Pauwels, Niko EC Verhoest, and Malcolm Davidson, “Crop classification using short-revisit multitemporal SAR data”, IEEE Journal of Selected Topics in Applied Earth Observations and Remote Sensing, vol. 4, no. 2, pp. 423-431, 2011.
34. Francisco Agüera Vega, Fernando Carvajal Ramirez, Monica Perez Saiz and Francisco Orgaz Rosua, “Multi-temporal imaging using an unmanned aerial vehicle for monitoring a sunflower crop”, Biosystems Engineering, vol. 132,
pp. 19-27, 2015.
Yan Zhu, Weixing Cao, Xiaolei Qiu, Tao Cheng and Yongchao Tian, “Integrating remote sensing information with crop model to monitor wheat growth and yield based on simulation zone partitioning”, Precision agriculture, vol. 19, no. 1, pp. 55-78, 2018.
36. Juliane Bendig, Kang Yu, Helge Aasen, Andreas Bolten, Simon Bennertz, Janis Broscheit, Martin L. Gnyp, and Georg Bareth, “Combining UAV-based plant height from crop surface models, visible, and near infrared vegetation indices for biomass monitoring in barley”, International Journal of Applied Earth Observation and Geoinformation, vol. 39, pp. 79-87, 2015.
37. Mengmeng Du and Noboru Noguchi, “Monitoring of wheat growth status and mapping of wheat yield’s within-field spatial variations using color images acquired from UAV-camera system”, Remote sensing, vol. 9, no. 3, pp. 289, 2017.
38. Bingfang Wu, René Gommes, Miao Zhang, Hongwei Zeng, Nana Yan, Wentao Zou, Yang Zheng et al, “Global crop monitoring: a satellite-based hierarchical approach”, Remote Sensing, vol. 7, no. 4, pp. 3907-3933, 2015.
39. Ramia Jannoura, Katja Brinkmann, Daniel Uteau, Christian Bruns and Rainer Georg Joergensen, “Monitoring of crop biomass using true colour aerial photographs taken from a remote controlled hexacopter”, Biosystems Engineering, vol. 129, pp. 341-351, 2015. 40. Grianggai Samseemoung, Peeyush Soni, Hemantha P W Jayasuriya
and Vilas M. Salokhe, “Application of low altitude remote sensing (LARS) platform for monitoring crop growth and weed infestation in a soybean plantation”, Precision Agriculture, vol. 13, no. 6, pp. 611-627, 2012.
41. Susan Moran M, Luis Alonso, Jose F Moreno, Maria Pilar Cendrero Mateo, Fernando De La Cruz D and Amelia Montoro, “A RADARSAT-2 quad-polarized time series for monitoring crop and soil conditions in Barrax, Spain”, IEEE Transactions on Geoscience and Remote Sensing, vol. 50, no. 4, pp. 1057-1070, 2011.
42. Esquerdo J C D M, Zullo Júnior J and Antunes J F G, “Use of NDVI/AVHRR time-series profiles for soybean crop monitoring in Brazil”, International Journal of Remote Sensing, vol. 32, no. 13, pp. 3711-3727, 2011.
43. Noureldin N A, Aboelghar M A, Saudy H S and Ali A M, “Rice yield forecasting models using satellite imagery in Egypt”, The Egyptian Journal of Remote Sensing and Space Science, vol. 16, no. 1, pp. 125-131, 2013.
44. Mathyam Prabhakar, Gopinath K A, Reddy A G K, Thirupathi M and Ch Srinivasa Rao, “Mapping hailstorm damaged crop area using multispectral satellite data”, The Egyptian Journal of Remote Sensing and Space Science, vol. 22, no. 1, pp. 73-79, 2019.
45. Deborah Gaso V, Andrés G Berger and Verónica S Ciganda, “Predicting wheat grain yield and spatial variability at field scale using a simple regression or a crop model in conjunction with Landsat images”, Computers and Electronics in Agriculture, vol. 159, pp. 75-83, 2019.
46. Randall Donohue J, Roger A Lawes, Gonzalo Mata, David Gobbett, and Jackie Ouzman, “Towards a national, remote-sensing-based model for predicting field-scale crop yield”, Field crops research, vol. 227, pp. 79-90, 2018.
47. Chunyuan Diao, “Innovative pheno-network model in estimating crop phenological stages with satellite time series”, ISPRS Journal of Photogrammetry and Remote Sensing, vol. 153, pp. 96-109, 2019. 48. Teodoro Semeraro, Giovanni Mastroleo, Alessandro Pomes, Andrea
Luvisi, Elena Gissi and Roberta Aretano, “Modelling fuzzy combination of remote sensing vegetation index for durum wheat crop analysis”, Computers and electronics in agriculture, vol. 156, pp. 684-692, 2019.
49. Nasim Reza Md, In Seop Na, Sun Wook Baek and Kyeong-Hwan Lee, “Rice yield estimation based on K-means clustering with graph-cut segmentation using low-altitude UAV images”, Biosystems engineering, vol. 177, pp. 109-121, 2019.
50. Carlos Devia A, Juan P Rojas, Petro E, Carol Martinez, Ivan F Mondragon, Patino D, Maria Camila Rebolledo, and Colorado D, “High-throughput biomass estimation in rice crops using UAV multispectral imagery”, Journal of Intelligent & Robotic Systems, pp. 1-17. 2019.
51. Isidro Campos, Laura González-Gómez, Julio Villodre, Maria Calera, Jaime Campoy, Nuria Jiménez, Carmen Plaza, Sergio Sánchez-Prieto and Alfonso Calera, “Mapping within-field variability in wheat yield and biomass using remote sensing vegetation indices”, Precision