International Journal of Innovative Technology and Exploring Engineering (IJITEE) ISSN: 2278-3075, Volume-8 Issue-10, August 2019
Abstract: Big data is extremely huge data sets analyzed computationally to expose patterns, trends, and prediction in order to make simpler the decision making. Predicting diseases became very important, it can be obtained with a large dataset using classification techniques. Various big data analytics tools are available for classification. Classification is the general technique used in the medical analysis for data prediction. In these paper classification algorithms like Support vector machine, Naïve Bayesian and C4.5 are discussed. The Pima Indian Diabetes Database (PIDD) is used in the analysis of the Classification algorithms to sort out and classify the people with diabetes positive and with diabetes negative it is openly accessible machine learning database found at UCI. The objective is to find the best suitable technique for prediction. Here, we used the comparison method with the results of three supervised learning algorithms based on three criteria, computation time taken, accuracy rate and error rate using the Tanagra tool. The classification algorithms are used to predict diabetes based on the data given. Accordingly, many classification techniques are there, from this study a few classification techniques suggested to be used in big data analysis, which has the probability to significantly progress the prediction. . As a result, a representative confusion matrix is displayed for making the verification process faster. From the results, it is concluded that C4.5 algorithm is best suited for predicting diabetes disease and also can be used in other disciplinary for making better prediction.
Index Terms: Big data, Classification techniques, C4.5, Diabetes, Naïve Bayesian, SVM, Tanagra.
I. INTRODUCTION
It is a complicated effort to process the big data efficiently via the conventional applications that previously exist which have humongous volumes of data. The data is processed from unstructured data. Big data analytics represents hidden patterns, correlations and also further insights with bulky of data. Predicting the future by estimating the prospect of a certain event’s occurrence is prediction it prognosticates what may come about in the future [19]. According to certain behavior they are characterized as structured data, unstructured data, and semi-structured data. By using expertise tools available now, analyzing the data and getting the required data accurately is possible at once. Big data analytics is the extraction of valuable information. Based on some behavioral patterns data are categorized into structured, unstructured and semi-structured data.
Using specialized software tools and applications data analytics is classically performed to examine a large volume of data for predictive analytics, data mining, text mining, and possibilities [1]. After collecting the data we start to analyze
Revised Manuscript Received on August 05, 2019.
P.Pandeeswary, M.Phil Scholar, Department of Computer Science, Dr. Umayal Ramanathan College For Women , Karaikudi.
Dr.M.Janaki, Associate Proffessor, Department of Computer Science, Dr. Umayal Ramanathan College for Women, Karaikudi.
it. Four types of analytics are used for different types of data. They arepredictive, prescriptive, diagnostic, and descriptive.
Predictive analysis analyzes and extracts information from the current and historical facts to predict what may possibly happen in the future, also gives probabilities of what would occur using statistical model and forecasts techniques. The prescriptive analysis is the area of business analytics (BA) which is dedicated to finding the best course of action or outcome among various alternatives for a given situation. It suggests possible outcomes using optimization and simulation algorithms. The diagnostic analysis measures the historical data to besides other data to find why something happened. Descriptive aims to afford insight into what happened in the past using data aggregation and data mining. From the perspective of the information and communication technology, big data is a robust motivation to the next generation of information technology industries, which are broadly built on the third platform, mainly referring to big data, cloud computing, internet of things, and social business [2].
There are various mining tools available to classify here we use Tanagra tool. Those tools and software offer methods and algorithms which helps us to analyze them in a much better way. It helps in analyzing the cluster, visualization of data, regression analysis, decision trees, predictive analytics, text mining, etc. In this paper, we conducted a comparison experiment with classification algorithms like support vector machine, c4.5 and naïve baysean using the Tanagra tool. The performance of the classification algorithm is identified by an accuracy measure that represents the approximate instance.
II. REVIEW OF LITERATURE
Big data has been applied to a variety of healthcare domains and in other domains to improve decision making and prediction. Mining consistent facts from diagnosis, however, have major challenges in healthcare domain. The application of various big data classification techniques is reviewed here, that is applied to the different analytical datasets.
M. Rajeshwaran, A.Ahila, discussed the ultrasound liver cancer tumor using SVM classifier and detected the seed point for the given ultrasound liver image as well as segment the ultrasound liver images also classified the ultrasound liver cancer tumor image as normal, benign and malignant using SVM classifier [11]. Ms.Poonam Bonde, Mr. Sachin Barahate, suggested for successively classifying the data and handle big data effectively the incremental SVM is combined with Hadoop map reduce. To alleviate the processing time for classification big data files
can be sent to multiple nodes. Processing time can be reduced further, by
Performance Analysis of Big data Classification
Techniques on Diabetes Prediction
leveraging big data files on multiple nodes [12].
Sunita Joshi, Bhuwaneshwari Pandey, Nitin Joshi, performed a comparative study with Naïve Bayes and J48 algorithm, based on the probability and decision tree. Using diabetes dataset and concluded that Naive Bayes uses less time to construct the model, more instances are classified correctly and prediction accurateness is also found to be better in Naive Bayes than of J48. And so they accomplished that Naïve Bayes achieves much better [13]. Lopamudra Dey, Sanjay Chakraborty, discussed the overall accuracy, precisions, and recall of the values of K-NN and Naive Bayesian. Naïve Bayes results for movie reviews and hotel reviews are taken. So they said to analyze movie reviews Naive Bayesian classifier can be effectively used [14].
Eka Sugiyarti, Kamarul Azmi Jasmi, Bushrah Basiron, Miftachul Huda, Shankar K., Andino Maseleno, used C4.5 algorithm to predict selection of scholarship grantee to senior high school student from external factors and internal students. Their tested results and analysis gave 94.7% accuracy. C45 algorithm can help to better and make better efficiency than previous as well as in earnings reports obtained can be minimized in error [15]. Efori Buulolo, Fadlina, Natalia Silalahi, Robbi Rahim, discussed earthquakes that occurred earlier can be used to predict the incidence of the quake will possibly happen someday. They used the c4.5 algorithm to predict. The results of C4.5 decision tree form, decision trees characteristic or condition of the earthquake and the decision, where the decision is an outgrowth of the earthquake that occurred modeling. C4.5 can predict the impact of the quake based on seismic data that has ever happened is modeled in the form of a decision tree [16].
III. CLASSIFICATION ALGORITHMS USED IN THE EXPERIMENT
Acquiring a precise diagnosis of certain important information is a major problem in bioinformatics analysis and in medical science. The clustering and classification of large scale data generally involve several analysis phases for a significant diagnosis [20]. Data classification is the process of organizing data into categories for its most efficient and effectual use. A Classification Algorithm is a way that selects the best fit of observations by the assumption from a set of alternatives. Assigning items in a collection that targets the categories or classes is a classification function. For each case in the data, the objective is to precisely predict the target class. In machine learning and statistics, classification is a supervised learning approach where the computer program classifies new observation by learning from the data given as input to it.
A. Support Vector Machine
A support vector machine is a classification technique for analyzing data in 1990. SVMs have frequently been found to provide maximum classification accuracies than other widely used pattern recognition techniques, such as the maximum likelihood and the multilayer perceptron neural network classifiers. SVMs are one of the most promising machines learning algorithms and there are many examples, where SVMs are used successfully, e.g. text classification, face recognition, and Bioinformatics [3]. The SVM algorithm is one of the best-advanced technique for the Big Data classification. At present, for different classification problems
in various applications, the SVM algorithm is used with immense achievement [4].
B. 3.2 Naive Bayesian
The Naive Bayesian classifier is a compilation of Bayes theorem based algorithms, which are not the distinct algorithm. A classification algorithm contributes to a general principle, which is related to it. Naïve Bayesian is a predictive modeling approach. A Naive Bayes classifier is one of the probabilistic machine learning models, which is used for the classification task. Naïve Bayes imposes fewer training data to approximate parameters essential for classification that makes a benefit of using it [5]. Based on Bayesian theorem it is the simplest classifier that has a well-built independence hypothesis, which is principally suited when the dimensionality of input is high [6].
C. 3.3 C4.5
C4.5 is the conservatory of Quinlan's earlier ID3 algorithm. It overcomes from various drawbacks of it. C4.5 is frequently referred to as a statistical classifier because the trees generated from it are widely used in classification technique. In decision making the attributes that have maximum normalized information gain is preferred [7]. C4.5 algorithm simplifies the grouping and searching process, it is furthermore expected to classify inventory data; hence, it proves to be as a statistical classifier algorithm [8].
IV. TOOL DESCRIPTION
Enormous data is utilized for a gathering of informational indexes so vast and complex that it is hard to process utilizing customary applications or devices [10]. Tanagra is free software which is used for academic and research purposes. Tanagra supports numerous of typical mining tasks such as data visualizing, descriptive statistics, instance assortment, feature selection, feature construction, regression and to examine the analysis factor, categorization of the data, clustering techniques, and then the association rule learning. Tanagra makes outstanding conciliation along with the statistical perspectives that are
parametric tests and non-parametric statistical tests, then the multivariate analysis tasks that is factor analysis, cluster analysis, regression techniques that include neural network, support vector machine, decision trees and random forest [9]. The foremost aim of Tanagra project is to provide researchers, students, and professionals a user-friendly software, conforming to the present software development in this domain and allowing analyzing either real or synthetic data [17].
V. EXPERIMENT
A.Dataset Source and Description
Extracting knowledge and patterns for the diagnosis and treatment of disease from the medical database becomes more significant to promote the innovation of telemedicine and community medicine [18]. The dataset is initially from the National Institute of Diabetes and Digestive and Kidney disease. It contains 3072 instances having 1072 data with diabetes and 2000 data without diabetes. The intention is to predict diagnostically
whether the patient has diabetes or not, based on
International Journal of Innovative Technology and Exploring Engineering (IJITEE) ISSN: 2278-3075, Volume-8 Issue-10, August 2019
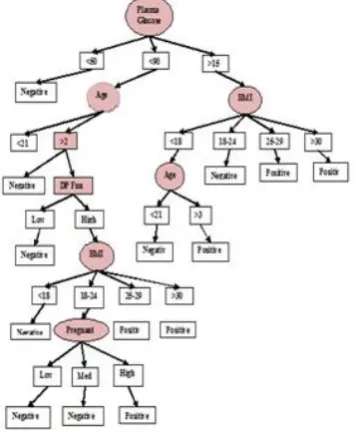
measurements included in the dataset. Some constraints were placed on the selection of these instances from a large database. Particularly all patients here are females at least 21 years old. Fig1 is the decision tree for pregnancy by the C4.5 classification algorithm.
Pregnancy: Indicates the number of times pregnant
Glucose: Shows plasma Glucose concentration
Diastolic BP: The diastolic Blood Pressure(mm Hg)
Skin Thickness: It is Triceps Skin Fold
Thickness(mm)
Insulin: The Serum Insulin(mug/ml)level
BMI: The Body Mass Index(Weight in Kg/(Height in
mm)^2)of patient
DP Function: Is Diabetes Pedigree Function
Age: Age in Years
Diabetes: Healthy represents no Diabetes, Sick
[image:3.595.308.544.152.285.2]represents Diabetes Decision tree
Figure 1: Decision tree representing pregnancy using C4.5 Algorithm
B.Evaluation of classification Algorithm
using Tanagra tool
In this division experimental results and analysis is done. The performance of the classification algorithm is estimated by using the confusion matrix, with a table that indicates true versus predicted values is shown. The confusion matrix for the support vector machine, Naïve Bayes, and c4.5 is depicted from the Table (1-3).
a)5.2.1. Support Vector Machine
[image:3.595.55.280.269.450.2]Table1contains the information of the SVM algorithm displayed in the confusion matrix, computed on learning sample (Classifier performance). The error rate is 0.22. We have the recall and (1.0-precision) for every value of the intent attribute.
Table: 1 Experimental results for Support vector machine
Error rate 0.2266
Values prediction Confusion matrix Value Recall 1-Precision
Sick 0.5634 0.2740
Healthy 0.8860 0.2089 Computation time: 343 ms.
Sick Healthy Sum Sick 604 468 1072
Healthy 228 1772 2000
Sum 832 2240 3072
b)Naive Bayesian
Table 2 contains the information of the Naïve Bayes algorithm displayed in the confusion matrix, computed on learning sample (Classifier performance). The error rate is 0.23. We have the recall and (1.0-precision) for every value of the intent attribute.
Table: 2 Experimental results for Naive Bayes
Error rate 0.2370
Values prediction Confusion matrix Value Recall 1-Precisio
n Sick 0.615
7 0.3238
Health y
0.842
0 0.1966
Computationtime:16 ms.
Sick Health y Sum Sick 660 412 107
2
Health
y 316 1684
200 0
Sum 976 2096 307 2
c)C4.5
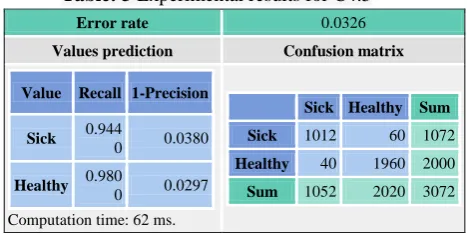
[image:3.595.318.552.388.505.2]Table 3 contains the information of the C4.5 algorithm displayed in the confusion matrix, computed on learning sample (Classifier performance). The error rate is 0.03. We have the recall and (1.0-precision) for every value of the intent attribute.
Table: 3 Experimental results for C4.5
Error rate 0.0326
Values prediction Confusion matrix Value Recall 1-Precision
Sick 0.944
0 0.0380
Healthy 0.980
0 0.0297 Computation time: 62 ms.
Sick Healthy Sum Sick 1012 60 1072
Healthy 40 1960 2000
Sum 1052 2020 3072
VI. RESULTS AND DISCUSSION
[image:3.595.50.288.688.778.2]Figure 2: Representation of Diabetes positive using Lift curve.
Figure3: Representation of Diabetes negative using Lift Curve
Figure 2 shows the tested positive curve for diabetes with respect to attributes such as pregnancy, glucose, diastolic BP, skin thickness, insulin, BMI, DP Function, age. Figure 3 shows the tested negative curve for diabetes with respect to the attributes.
Figure 4: Decision Tree for Diabetes
Figure 4 is the decision tree for analyzed diabetes datasets which shows the attributes such as pregnancy, glucose, diastolic BP, skin thickness, insulin, BMI, DP Function, age and their corresponding values which helps in making the decision.
The classification techniques performance with the given dataset based on accuracy, error rate, the time is taken to compute was compared, which is defined as follows,
Table: 4 Comparisons between Classification Algorithms in Tanagra.
Algorithm Used Time Taken(ms)
Accuracy Error Rate
1. SVM
1.
343 77% 0.226
6
2. Naïve
Bayesian 2.
16 76% 0.237
0
3. C4.5 62 96% 0.032
6
[image:4.595.49.285.57.427.2] [image:4.595.313.543.179.308.2]From the above table, the time taken by Naïve Bayes is very low compared with the SVM algorithm also the accuracy of the Naive Bayes algorithm is low comparing with the C4.5 algorithm. The error rate of the C4.5 algorithm is very less when analyzing it with other two classification algorithm. Figure 5 shows the line chart for Table 4.
Figure 5: Line chart representing the comparison of classification techniques.
The above chart shows clearly that Naïve Bayesian takes a very least time but accuracy and error rate of C4.5 is more than the other algorithms.
VII. CONCLUSION AND FUTURE WORK In this experiment, diabetes patient’s dataset from the National Institute of Diabetes and Digestive and Kidney disease is taken into consideration. Since most of the people are affected by diabetes today, it’s necessary to have a prediction system for this disease. Accuracy is more important in disease prediction, hence we have taken three classification techniques and the results are compared to show which one yields best result. In the experimental result, the C4.5 algorithm gives more accuracy and low error rate compared with the other two
[image:4.595.312.542.401.538.2] [image:4.595.85.263.538.755.2]International Journal of Innovative Technology and Exploring Engineering (IJITEE) ISSN: 2278-3075, Volume-8 Issue-10, August 2019
C4.5 algorithm Naive Bayesian gives better computation time comparing with SVM, and the accuracy, error rate are also better. The SVM gives better accuracy but the computation time is very high. So by analyzing three algorithms, C4.5 algorithm is suggested to be the best one for predictive analysis. We can get better results by applying further techniques, innovative approaches, and diverse tools over the newer version of the identical dataset. In the future, it helps healthcare professionals for improved decision making and prediction.
REFERENCES
1. Venkatesh Naganathan, ‘Comparative Analysis of Big Data, Big Data Analytics: Challenges and Trends’, (JET), Vol: 5,
Issue: 05, May-2018.
2. Althaf Rahaman.Sk, Sai Rajesh.K, ‘Challenging tools on Research Issues in Big DataAnalytics’, 2018 IJEDR, Volume: 6, Issue 1. 3. S. Vijayarani, Mr.S.Dhayanand, ‘Data Mining Classification
Algorithms for Kidney Disease Prediction’, International Journal on Cybernetics & Informatics (IJCI) Vol. 4, No. 4, August 2015. 4. Liliya Demidova,Evgeny Nikulchev, ‘Big data classification using
SVM Classifiers with the Modified Particle Swarm Optimization and the SVM Ensembles’ IJACSA, Vol:7, No. 5, 2016.
5. S.Vijayarani, Mr.S.Dhayanand, ‘DATA MINING CLASSIFICATION ALGORITHMS FOR KIDNEY DISEASE PREDICTION’, International Journal on Cybernetics & Informatics (IJCI) Vol. 4, No. 4, August 2015.
6. Prableen Kaur and Manik Sharma, ‘Analysis Of Data Mining And Soft Computing Techniques In Prospecting Diabetes Disorder In Human Beings: A Review’, IJPSR, 2018, Vol: 9, Issue 7.
7. R. Kishore Kumar, G. Poonkuzhali, P. Sudhakar, ‘Comparative Study on Email Spam Classifier using Data Mining Techniques’ International MultiConference of Engineers and computer Scientists 2012 and VolI, IMECS 2012.
8. Kalpesh Adhatrao, Aditya Gaykar, ‘Predicting Students Performance Using Id3 And C4.5Classification algorithms’, International Journal of Data Mining & Knowledge Management Process, IJDKP Vol:3, No:5,2013.
9. Amrita Naika, Lilavati Samantb, ‘Correlation Review Of Classification Algorithm using Data mining Tools: WEKA, Rapid miner, Tanagra, Orange And Knime’, International Conference on Computational Modeling and Security, 2016, ELSEVIER.
10. CH.ChandraSekhar,CH.Sekhar,‘productivity, ‘Improvement in Agriculture Sector Using Big Data Tools’, 2017, IEEE Conference Paper.
11. M.Rajeshwaran, A.Ahila, ‘Segmentation Of Liver Cancer Using Svm Techniques’, International Journal of Computing Communication and Information System (IJCCIS) vol: 6. No.2 – April - June 2014. 12. Poonam Bonde, Sachin Barahate, ‘Classification Of Big Data Using
Support Vector Machine’, JETER, March 2017, Vol 4, Issue 03. 13. Sunita Joshi, Bhuwaneshwari Pandey, ‘ Comparative Analysis Of
Naive Bayes And J48 Classification’, International Journal of advanced research in Computer science and Software Engineering, Vol:5, Issue 12, Dec 2015.
14. Lopamudra Dey, Sanjay Chakraborty,‘Sentiment Analysis Of Review Datasets Using Naïve Bayes’ And K-NN Classifier’, I.J.Information Engineering and Electronic Business,2016, 4.
15. Eka Sugiyarti1, Kamarul Azmi Jasmi,‘Decision Support System Of Scholarship Grantee Selection Using Data Mining’, International Journal of Pure and Applied Mathematics, Vol119, No. 15 2018. 16. Efori Buulolo, Fadlina, ‘C4.5 Algorithm To Predict the Impact of the
Earthquake’, (IJERT), Vol: 6 Issue: 02, Feb 2017. 17. P. Radha, Dr. B. Srinivasan
,
‘ Predicting Diabetes By Cosequencing The Various Data Mining Classification Techniques’, International Journal of Innovative Science, Engineering & Technology, Vol:1, Issue:6, Aug 2014.
18. T. Santhanam, M.S Padmavathi, ‘Application of K- Means and Genetic Algorithms for Dimension Reduction by Integrating SVM for Diabetes Diagnosis’, Elsevier, 2015, ScienceDirect.
19. Usha G Biradar, Deepa S Mugali, ‘Clustering Algorithms on Diabetes data: A Comparative Case Study’, International Journal of Advanced Research in Computer Science, Vol:8, No. 5, May-June 2017. 20. M. Rashedur Rahman, Farhana Afroz, ‘Comparison Of Various
Classification techniques using different Data mining Tools for the
Diabetes Diagnosis’, Journal Of Software Engineering And Applications, 2013.
AUTHORSPROFILE
First Author P.Pandeeswary is currently pursuing the M.Phil Degree in Computer Science at the Department of Computer Science, Dr. Umayal Ramanathan College ForWomen ,Karaikudi. Her research Interest includes Diabetic disease rediction and big data analytics.