Service Oriented Architecture for
Geographic Information Systems
Supporting Real Time Data Grids
DISSERTATION
Galip Aydin
Submitted to the faculty of the University Graduate School in partial fulfillment of the requirements
for the degree Doctor of Philosophy
in the Department of Computer Science Indiana University
I
Accepted by the Graduate Faculty, Indiana University, in partial fulfillment of the requirements for the degree of Doctor of Philosophy.
Doctoral Committee
--- Prof. Geoffrey C. Fox (Principal Advisor)
--- Prof. Dennis Gannon
--- Prof. David Leake
--- Prof. Beth Plale
II
Table Of Contents
Chapter 1
Introduction ... 1
1.1 Motivation ... 3
1.1.1 Problems with the Traditional GIS Approaches ... 3
1.1.2 Sensors and Real-Time Data Access in GIS... 7
1.2 Research Issues ... 8
1.3 Organization of the Dissertation ... 10
Chapter 2 Related Work and Motivating Use Cases ... 12
2.1 Related Projects ... 13
2.1.1 Linked Environments for Atmospheric Discovery (LEAD) ... 13
2.1.2 OPeNDAP ... 15
2.1.3 ROADNet ... 18
2.2 Data Stream Processing and Management ... 20
2.3 Motivating Use Cases ... 24
2.3.1 RDAHMM ... 24
2.3.2 Pattern Informatics ... 27
2.3.3 Interdependent Energy Infrastructure Simulation system (IEISS) ... 29
Chapter 3 GIS Data Grid Architecture ... 31
3.1 Overview of the System ... 31
3.2 Major Components of the Architecture ... 33
3.3 Summary ... 38
Chapter 4 Grid Architecture for Archival GIS Data ... 40
4.1 Introduction ... 40
4.2 Data Grids for Geographic Information Systems ... 41
4.2.1 Web Services ... 42
4.2.2 Open Geographic Standards ... 44
4.2.3 Web Services for GIS ... 46
4.2.4 Common Data Format... 47
4.2.5 Data Binding ... 51
4.2.6 Web Feature Service ... 51
4.2.7 Web Service Implementation of Web Feature Service ... 58
4.3 Web Feature Service Architecture ... 60
4.3.1 Creating a Geospatial Database ... 60
4.3.2 Adding New Features ... 63
4.3.3 Web Feature Service Operation Steps ... 71
4.3.4 Web Feature Service Capabilities ... 74
III
4.4 Streaming Web Feature Service ... 76
4.4.1 NaradaBrokering ... 77
4.4.2 GlobalMMCS: Using NaradaBrokering to Manage Audio/Video Streams ... 79
4.4.3 Comparison of Streaming and Non-Streaming Web Feature Services ... 81
4.5 Geophysical Data Grid Examples ... 84
4.5.1 Los Alamos National Laboratory, NISAC SOA Architecture ... 84
4.5.2 Pattern Informatics Integration ... 93
4.6 Summary ... 96
Chapter 5 Streaming Web Feature Service and Performance of the GIS Data Grid ... 98
5.1 Introduction ... 98
5.2 Streaming Web Feature Service ... 102
5.3 Performance Tests ... 106
5.4 Performance Test Results ... 110
5.4.1 LAN Tests ... 110
5.4.1.1 Streaming WFS Performance with Textual XML Transfer ... 111
5.4.1.2 Streaming WFS Performance with Fast Infoset Integration ... 113
5.4.1.3 Streaming WFS Performance with BNUX Integration ... 115
5.4.1.4 Performance Comparison of Three Encodings ... 118
5.4.1.5 Fast Infoset, BNUX comparison ... 119
5.4.2 WAN Testing I... 120
5.4.2.1 Streaming WFS Performance with Textual XML Transfer ... 121
5.4.2.2 Streaming WFS Performance with Fast Infoset Integration ... 123
5.4.2.3 Streaming WFS Performance with BNUX Integration ... 125
5.4.2.4 Performance Comparison of Three Encodings ... 127
5.4.3 WAN Testing II... 129
5.4.3.1 Streaming WFS Performance with Textual XML Transfer ... 129
5.4.3.2 Streaming WFS Performance with Fast Infoset Integration ... 131
5.4.3.3 Streaming WFS Performance with BNUX Integration ... 133
5.4.3.4 Performance Comparison of Three Encodings ... 136
5.5 Summary ... 137
Chapter 6 Real-Time GIS Data Grid ... 138
6.1 Introduction ... 138
6.2 Real-Time Data Grid Components ... 141
6.2.1 Filters ... 142
6.2.2 Filter Metadata ... 143
6.2.3 Filter Chains... 145
6.2.4 Information Service ... 148
6.2.5 Streaming Messaging Support ... 148
6.2.6 Filter Web Services... 149
6.3 Real time Data Grid Implementation for Global Positioning System Networks ... 153
6.3.1 Real-Time GPS Networks ... 155
6.3.2 Chain of Filters ... 157
IV
6.3.3.1 Decoding RYO Messages ... 160
6.4 Application integration Use Case: Coupling RDAHMM with Streaming Data ... 165
6.4.1 RDAHMM Integration using HPSearch... 166
6.4.2 RDAHMM Integration as a Filter ... 169
6.5 Real-Time display of the GPS station positions on Google Maps ... 170
6.5.1 Near Real-Time Data Analysis Display on Google Maps ... 178
6.5.1.1 GPS Station Position Changes on Google Maps ... 178
6.5.1.2 RDAHMM Analysis Results on Google Maps ... 180
6.6 Summary ... 181
Chapter 7 Performance and Scalability of the Real-Time Data Grid ... 182
7.1 Introduction ... 182
7.2 Testing the Real-Time GPS Data Grid Implementation ... 184
7.3 Test Methodology ... 185
7.4 Test Results ... 189
7.4.1 System Stability Test ... 190
7.4.2 Maximum number of GPS networks a single broker can support ... 191
7.4.3 Maximum number of clients a single broker can support ... 194
7.4.4 Multiple Broker Test ... 196
7.5 Summary ... 200
Chapter 8 Conclusion and Future Research Directions... 201
8.1 Thesis Summary ... 201
8.2 Answers to Research Questions... 203
8.3 Directions for Future Research ... 207
V List of Figures
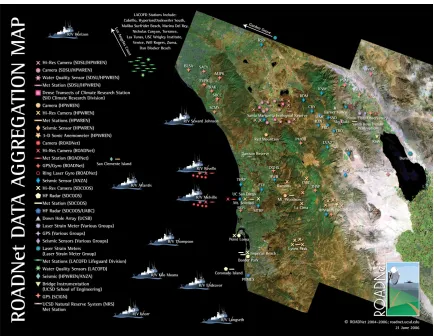
Figure 2-1- Current ROADNet Sensor map. ... 19
Figure 2-2 - RDAHMM output plots for time series data ... 25
Figure 2-3 - RDAHMM output plots for 800-day long GPS time series data... 26
Figure 2-4 - PI forecast map or hotspot scorecard ... 28
Figure 2-5 - IEISS screen capture ... 30
Figure 3-1 - SensorGrid Architecture ... 36
Figure 4-1 - OGC Geometry Model. ... 49
Figure 4-2 - WFS Interaction Steps. ... 53
Figure 4-3 - WFS may interact with multiple databases and various types of clients ... 55
Figure 4-4 -WSDL Components of our WFS implementation. ... 58
Figure 4-5 - XML Schema for SCEDC and SCSN Seismic Catalogs... 65
Figure 4-6 - Architectural diagram of the WFS implementation ... 71
Figure 4-7 - Main Components of GlobalMMCS architecture ... 80
Figure 4-8 - WFS in a Grid environment ... 83
Figure 4-9 - NISAC SOA Demonstration Architectural Diagram and Data Flow ... 86
Figure 4-10- Original IEISS Data for the Florida State ... 87
Figure 4-11 - Sample Florida State Electric Power and Natural Gas Components. ... 87
Figure 4-12 - Data flow in the IEISS Block ... 91
Figure 4-13 - Sample IEISS output generated by the WMS. ... 92
Figure 4-14 - A general GIS Grid orchestration scenario. ... 94
Figure 4-15 - High Performance Data Grid for Geographic Information Systems ... 97
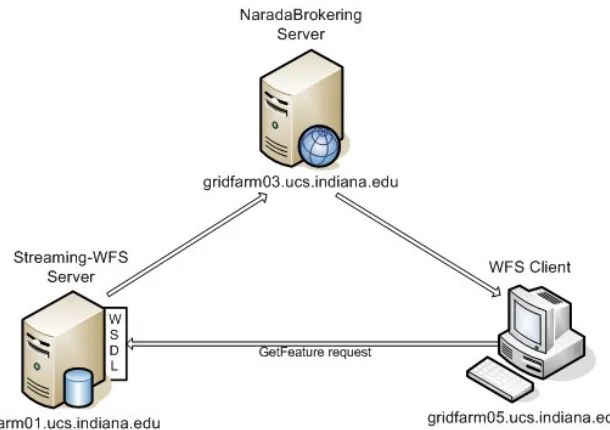
Figure 5-1 - Streaming Web Feature Service Performance Test Setup ... 104
Figure 5-5-2 - Streaming Web Feature Service integrated with a Binary XML framework. ... 106
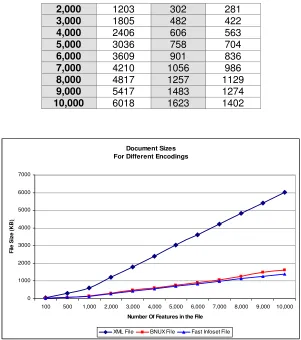
Figure 5-3 - Web Feature Service GML Message ... 107
Figure 5-4 - Document Sizes for different encodings. ... 108
Figure 5-5 Test Configuration for the first case ... 110
Figure 5-6 Average transfer times and standard deviations for small payloads ... 112
Figure 5-7 Average transfer times and standard deviations for larger payloads ... 112
Figure 5-8 - Streaming WFS performance with Fast Infoset integration, small files ... 114
VI
Figure 5-10 - Streaming WFS performance with BNUX integration for small payloads ... 116
Figure 5-11 - Streaming WFS performance with BNUX integration for larger payloads ... 117
Figure 5-12 - Total processing times for different XML encodings, small files ... 118
Figure 5-13 - Total processing times for different XML encodings, large files ... 118
Figure 5-14 - Performance comparison of Fast Infoset and BNUX frameworks, small files ... 119
Figure 5-15 - Performance comparison of Fast Infoset and BNUX frameworks, large files ... 120
Figure 5-16 - Test Configuration for the second case ... 120
Figure 5-17 - Streaming WFS timings for XML data exchange, small files ... 122
Figure 5-18 - Streaming WFS timings for XML data exchange, large files ... 123
Figure 5-19 - Streaming WFS performance with Fast Infoset integration, small files ... 124
Figure 5-20 - Streaming WFS performance with Fast Infoset integration, larger files ... 125
Figure 5-21 - Streaming WFS performance with BNUX integration, small files ... 126
Figure 5-22 - Streaming WFS performance with BNUX integration, large files ... 127
Figure 5-23 - Total processing times for different XML encodings, small files ... 128
Figure 5-24 - Total processing times for different XML encodings, large files ... 128
Figure 5-25 - Test Configuration for the third case... 129
Figure 5-26 - Streaming WFS timings for XML data exchange, small files ... 130
Figure 5-27 - Streaming WFS timings for XML data exchange, large files ... 131
Figure 5-28 - Streaming WFS performance with Fast Infoset integration, small files ... 132
Figure 5-29 - Streaming WFS performance with Fast Infoset integration, large files ... 133
Figure 5-30 - Streaming WFS performance with BNUX integration, small files ... 134
Figure 5-31 - Streaming WFS performance with BNUX integration, large files ... 135
Figure 5-32 - Total processing times for different XML encodings, small files ... 136
Figure 5-33 - Total processing times for different XML encodings, large files ... 136
Figure 6-1 - Simple Filter concept ... 142
Figure 6-2 - XML Schema for the Filter Metadata ... 145
Figure 6-3 - Parallel operation of the filters... 146
Figure 6-4 - Serial operation of the filters ... 146
Figure 6-5 - XML Schema for the Filter Chains ... 147
Figure 6-6 - Overall SensorGrid Architecture ... 152
Figure 6-7 -Plate Boundary Observatory (PBO) GPS Stations in North America; ... 154
VII
Figure 6-9 - Real-Time Filters for processing real-time GPS streams ... 159
Figure 6-10 - RYO Message Parts ... 160
Figure 6-11 - Filter Services and RDAHMM Integration ... 167
Figure 6-12 - NaradaBrokering topics can be arranged in a hierarchical order... 169
Figure 6-13 - Architectural diagram for Real-Time GPS messages and AJAX integration ... 174
Figure 6-14 - Real-Time GPS networks in Southern California displayed on Google Maps. ... 175
Figure 6-15 - Network selection page for AJAX and Google Maps Demo ... 176
Figure 6-16 - Real-Time Data Display on Google Maps. ... 177
Figure 6-17 - GPS Station Position Changes are displayed on Google Maps. ... 179
Figure 6-18 - RDAHMM Analysis Results Displayed on Google Maps ... 180
Figure 7-1 - SensorGrid Performance Test Setup includes three real-time filters and a broker . 187 Figure 7-2 - System Stability Test Results for 24-hour operation of the sample test setup. ... 190
Figure 7-3 - Multi Publisher Test Architecture ... 191
Figure 7-4 - Multiple publisher test results for the first 24 hour ... 193
Figure 7-5 - Multiple publisher test for the second 24 hour with 1000 active publishers ... 193
Figure 7-6 - Multi Client Test Architecture ... 194
Figure 7-7 - Multiple Subscribers Test Results ... 195
Figure 7-8 - Multiple Broker Test ... 197
Figure 7-9 - Total transit times for the first broker; ... 198
1
Chapter 1
Introduction
Geography is the science of studying earth and its features and of the distribution of
life on the earth, including human life and the effects of human activity [1]. Although
geography is often associated merely with studying places and maps these are not the
only areas its scope encompasses. Geography studies physical and human landscapes, the
reasons for their spatial variation, why and how they change over time and the dynamics
behind these changes. From creating simple maps to statistical analysis of population
distribution to effects of pollution on rain forests geographic data and tools are being
widely utilized by academia, industry and the governments for understanding almost
every aspect of the modern life.
A Geographic Information System is a system for creating, storing, sharing,
analyzing, manipulating and displaying spatial data and associated attributes. It can be
used for creating or capturing geographic information from various sources in digital
2
formats. Perhaps the simplest example of Geographic Information Systems is widely
available map viewers which process layers of geospatial data to create map images.
Geographic Information Systems are used in a wide variety of tasks such as urban
planning, resource management, environmental impact assessment, emergency response
planning in case of disasters, crisis management and rapid response etc. Although these
seem to be relatively independent and different areas a common feature of almost all GIS
use cases is the need for the system to relate information from different sources. For
instance a GIS framework to help planning adequate response in case of a natural disaster
such as a powerful earthquake would require latest information about the strength of the
earthquake, detailed images of the affected areas with and inhabited places clearly
marked, the names of these places, population density, usable roads and railroads,
information about the energy and natural gas lines, hospitals, police headquarters,
buildings that can be used for relocating affected people such as schools and public
buildings etc. The list can go indefinitely but it gives an idea about unique characteristics
of the GIS.
The 20th century saw the birth of the GI Systems, and their journey from centralized
mainframe systems to desktop systems and finally to distributed systems [2]. Today a
modern GIS requires distributed systems support at two levels; first for accessing various
geospatial databases to execute spatial queries and second for utilizing remote geographic
analysis, simulation or visualization tools to process spatial data.
In a relatively short period of time the Internet has dramatically changed how
scientists, industry specialists and the public access, exchange and process information.
3
significantly evolved. This helped academia, governments and businesses to have easy
access to substantial amount of geospatial data. Today hundreds of spatially enabled web
sites allow users to make spatial queries, create/view/manipulate interactive high-quality
online maps or search and find national or global geographic data. The governments are
working to establish national spatial data and services infrastructures to satisfy
ever-increasing demand from public for more and higher quality geospatial data. For instance
the Federal Geographic Data Committee under the National Geospatial Programs Office
is established to promote the coordinated development, use, sharing, and dissemination of
geospatial data on a national basis. It maintains the National Spatial Data Infrastructure
(NSDI) Clearinghouse Network which is “a community of distributed data providers who
publish collections of metadata that describe their map and data resources within their
areas of responsibility, documenting data quality, characteristics, and accessibility.” [3].
Similar clearinghouses or data warehouses have been created by others as well [4].
Although the advances in internet and distributed computing provided easy access
to distributed data products several issues still need to be resolved. These issues also
constitute the motivations of our research and explained in the next section.
1.1
Motivation
1.1.1
Problems with the Traditional GIS Approaches
The desktop GIS applications conventionally used to access and analyze local data
do not have the ability to interact with online data sources and with other spatial analysis
applications. To be able to interact with online geospatial resources the traditional
4
various distributed systems architectures. As a result client-server based distributed GIS
applications have been introduced to fill the gap, and the GIS companies and research
groups have developed their own spatial databases along with various data access and
manipulation tools.
However because of the proprietary design of these applications interoperability at
the application level has always been a significant bottleneck. For instance in addition to
the various types of GIS analysis applications there are at least three major types of GIS
servers used by different Indiana State counties, and these servers are not compatible with
each other [5]:
– ESRI [6] ArcIMS and ArcMap Server (Marion, Vanderburgh, Hancock,
Kosciusko, Huntington and Tippecanoe counties)
– Autodesk MapGuide [7] (Hamilton, Hendricks, Monroe and Wayne counties)
– WTH Mapserver Web Mapping Application [8] (Fulton, Cass, Daviess and City
of Huntingburg counties) based on several Open Source projects.
We also observe the same interoperability problem at the data level. This is perhaps
due to the aggressive policies GIS companies have embarked in early years of the GIS
development to discourage switching between different suites. There are numerous ways
of describing geospatial data in various formats such as ESRI shape files [9], ASCII files,
XML files, Geography Markup Language (GML) [10] files etc. Following table gives a
comparison of some of the GIS software file formats:
Table 1-1 – Software File-Format Chart (Source: Geo Community, [11])
tiff.tfw header.dxfdem .eoo .shp.jpgigds/.dgn.mif.dlg .sdtsdted Tiger AutoCad
5
Caliper Corp.
GIS Plus 1 2 1 1
Maptitude 1 2 1 1 1 1 1 1 1 Trancad 1 2 1 1
ENVI 1 1 3 ERDAS 1 1 1 1
ERMAPPER 1 1 1 1 1 1 1 1 1 ESRI
ARC/INFO 1 1 1 1 1 1 1 1 1 1 1 1 ArcView 1 1 1 2 1 1 1 2 Data Automation Kit 1 1 1 1 1 Geographix 1 1 1
Genasys 1 1 1 1 GRASS 1 1 1 1 1 HASP 3 3 1 3 IDRISI 1 1 1 3 Intergraph
IRAS C 1 3 3 3 PowerRas 1 3 3 3 Vista Map 1 3 3 3 Landform Gold 1 1 3 Microstation 3
95 1 2 1
Descartes 2 2 3 3
MapInfo 1 3 1 1 1 1 1 PCI Remote 1 1 1 1
Terramodel 1 1 1 1 TNT Mips 1 1 1 1 TOPO+ 1 1 3 3 Vertical Mapper 2 3 2 2
1= Full compatibility
2= Compatible only with third party software 3= Not compatible at all
Therefore, the unique properties of the geospatial data such as different resolutions
and scales of the same domain caused data providers to create different ways to describe
the same geospatial entity which in turn resulted in numerous incompatible formats.
We identify several problems with traditional distributed GIS approach:
1 Problems with assembling data: Because of the distributed nature of geospatial
data, users are required to utilize different tools to access data in various FTP or
6
real-time data providers employ different communication and data transport
protocols which further complicates the access.
2 Data format problems: Depending on the user’s choice of software, applications
that digest geospatial data require input in different formats. Users spend
significant amount of time converting data from one format to other to make it
available for their purpose.
3 Amount of resources for processing data: After the data is collected and
converted into a usable format, enough hardware and software resources need to
be allocated for analyzing the data. In most cases the amount of collected data
reaches to an amount in the order of gigabytes or even terabytes, handling this
data becomes a challenge for most users and organizations. Also, simulation and
visualization software used in conjunction require high performance computing
platforms which are unreachable for common users.
As a result, today, due to the distributed nature of the geospatial data and the variety
of data and application standards the GIS community faces the following challenges:
1. Adoption of universal standards: Over the years organizations have produced
geospatial data in proprietary formats and developed services by adhering to
differing methodologies;
2. Distributed nature of geospatial data: Because the data sources are owned and
operated by individual groups or organizations, geospatial data is in vastly
distributed repositories,
3. Service interoperability: Computational resources used to analyze geospatial
7
Undoubtedly these issues are the focal point of numerous research and development
efforts [12] [13]. Especially the problems related to data formats and standards are being
addressed by a number of groups and organizations some of which also offer solutions to
the application level interoperability issues [14-18]. We summarize these standards based
efforts in Chapter 4.
However most of the distributed GIS services approaches are based on more
traditional client-server models and lacks the potential of easily linking distributed
computational components.
1.1.2
Sensors and Real-Time Data Access in GIS
Another very important and relatively less explored issue in geospatial world is the
real-time data access and their integration with Geographic Information Systems. Thanks
to the advancements in sensor technology a revolution is slowly taking shape in terms of
data acquisition in a growing number of fields [19, 20]. Profound effects of sensors in
GIS related sciences such as in environmental monitoring, earth observation, real-time
pollution monitoring are becoming more and more visible [21-24].
GIS related use of sensors vary to a great extent; they can be used in monitoring the
water level of the rivers, or the number of vehicles passing through bridges at certain
times of the day, or recording humidity in the air etc [25] [26]. But what is common is
that all of these measurements are used by some GIS framework for statistical or practical
purposes. However since the traditional approach of the GIS frameworks is based on
accessing and using geographic data from archives or spatial databases integrating these
sensor measurements with the geo-processing tools is a problematic issue, especially in
8
There are some recent efforts to present unified interfaces to sensors and sensor
measurements such as OGC Sensor Web Enablement [28]. We summarize these efforts
in Chapter 6. However the GIS community today needs Service Oriented approaches for
coupling real-time sensor measurements with the data analysis tools.
1.2
Research Issues
In this dissertation we investigate the issues pertaining to the traditional Geographic
Information Systems approaches and propose solutions to these problems based on
modern Service Oriented Grids approaches.
The importance of providing access to computational resources has been central in
many research efforts in Grid community. Another such important issue is distributed
access to data stored in various types of databases. Geographic Information Systems are
especially affected by the developments in both of these areas since these systems are
traditionally data-centric; they require access to data from many different sources for
creating layers, and tend to use various types of data processing tools for analysis or
visualization of the geographic data.
Distributed data access in GIS is traditionally regarded as dealing with distributed
data archives, databases or files. However modern scientific applications especially
real-time data processing tools require continuous data streaming. High-rate data streaming is
also important for applications such as decision making tools that require fast data access.
We identify two major types of geographic data based on their sources: real-time
measurements acquired from sensors and archival data stored in spatial databases. The
9
because the measurements are most likely to be used by these systems for analysis or
statistical reasons.
This thesis is about developing a Web Services architecture that provides access to
both types of the geographic data products, manage data sources, connect them to the
geo-processing applications and allow users to access them in common formats. The
thesis implementation encompasses development of GIS data services, high-performance
streaming data services, integrating messaging system with these services, composition of
GIS services in scientific workflows, real-time data filters and coupling scientific
geophysical applications with real-time and archival data.
We identify following research questions in the scope of this thesis:
- Can we implement unified data-centric Grid architecture to provide common
interfaces for accessing real-time and archival geospatial data sources?
- How can we incorporate widely accepted geospatial industry standards with
Web Services?
- Are the performance of the Web Services acceptable for Geographic
Information Systems and how can we make performance improvements?
- How can we build services for supporting scientific GIS applications that
demand high-performance and high-rate data transfers?
- How can we build a Grid architecture to couple real-time sources with
scientific applications that also provides high interactivity and performance?
10
- Can we organize and manage real-time sensor data products using
publish-subscribe systems? Are the mechanisms of topic based publish/publish-subscribe
systems appropriate?
- Is the performance of the Real-Time Data Grid acceptable for uninterrupted,
continuous operation?
- Will the Real-Time Data Grid implementation scale for large number of data
providers such as sensors and clients?
1.3
Organization of the Dissertation
This thesis is organized as follows. The first chapter consists of an overview of the
Geographic Information Systems, a summary of the outstanding issues that relate to the
research outlined in this thesis and the research questions. Chapter 2 contains short
reviews of some of the related projects and motivating geophysical applications. Our
system is an example of the Grids of Grids paradigm [29] which consists of two major
architectural components; the first is a Data Grid for archival geographic data, and the
second is the Real-Time Data Grid for sensors. In Chapter 3 we give an overview of the
overall architecture and explain the major components of the system.
Chapter 4 and Chapter 5 present the High Performance GIS Data Grid architecture
for archival geospatial data, and a detailed performance study. In chapter 4 we explain the
design principles of the Data Grid architecture for GIS and give implementation details.
In this chapter we present our approach for creating GIS Web Services and methods for
improving the performance of these services. We introduce streaming GIS Web Services
11
performance study of the GIS Data Grid and the streaming services introduced in Chapter
4.
Chapters 6 and 7 introduce the Real-Time GIS Data Grid and its performance
studies. In Chapter 6 we present a novel Grid architecture which consists of filter Web
Services, Grid Messaging Substrate and Information Services. This architecture is
designed to provide continuous streaming access to sensor messages. We also present
metadata descriptions for real-time filters and filter chains. This chapter presents several
use cases of the Real-Time Data Grid architecture with real-time GPS streams. Chapter 7
presents a detailed performance study of the Real-Time Data Grid architecture. We
outline several test cases and give performance results. The tests help us determine the
limits of the system in terms of the maximum number of data producers and clients that
can be supported.
In Chapter 8 we give answers to the research questions identified in Chapter 1,
12
Chapter 2
Related Work and Motivating Use Cases
While writing about Geographic Information systems one must acknowledge the
tremendous amount of work done for more than half a century. Since the first true
operational GIS framework “Canadian Geographic Information System” (CGIS) was put
in service in 1964, there have been many successful systems developed and used. Later
the first mainframe GIS examples are replaced by the more modular Desktop based
systems working on UNIX workstations and Personal Computers (PC). With the
development of sophisticated networking methodologies, access to distributed geographic
data and geo-processing applications become much easier. Today widely known online
mapping applications such as Google Maps, Microsoft Visual Earth, and Yahoo Maps
provide GIS services to ordinary Internet users.
This research is mainly constructed around the Geophysical Grid notion and it aims
13
Pattern Informatics etc with real-time and archived geographic data. The research is
divided into two major parts; the first part is about issues related to creating a Service
Oriented Architecture for geographic data, proposed improvements and benchmarks, and
the second part is defining principles and developing a prototype implementation for
supporting sensors and real-time data in Grid environments. This logical separation of
geo-referenced data helps us clearly define the boundaries of the research and the
requirements for the two distinct Grids we build.
In this chapter we summarize several well-known projects in the community, which
are also closely related to our work. However it should be noted that it is not possible to
mention all related projects here because of the sheer number of work done or currently
being researched. Also it should be noted that the term GIS relates to many different
scientific fields, but we are only interested in Information Technology aspects of it.
Additionally we summarize some of the scientific applications which motivated this
research.
2.1
Related Projects
2.1.1
Linked Environments for Atmospheric Discovery
(LEAD)
Linked Environments for Atmospheric Discovery (LEAD) is a large scale project
funded by NSF Large Information Technology Research grant for addressing
fundamental IT and meteorology research challenges to create an integrated framework
14
to identify and access, prepare, manage, analyze or visualize a broad array of
meteorological data and model output independent of format and physical location [30].
For adaptive utilization of distributed resources, sensors and workflows LEAD is
developing the middleware. The LEAD system is constructed as a service-oriented
architecture and decomposes into services which communicate via well-defined
interfaces and protocols [31].
LEAD provides the scientists with necessary tools to build forecast models using
available observations or model generated data and manages necessary resources for
executing the model. The tools include supercomputer resources, automated search,
selection and transfer of required data products between computing resources [32]. One
major feature of LEAD is support for adaptive analysis and prediction of mesoscale
meteorological events. To provide such features LEAD data subsystem supports three
important capabilities: 1 - automated data discovery by replacing the manual data
management tasks with automated ones, 2 - a highly scalable data archiving system
which allows transfer of large scale data products between resources, metadata
descriptions of the available information and protected storage facilities, 3 – easy search
and access interfaces for the data via a search GUI and underlying ontology [32].
LEAD provides a web-portal as the entry point for students, users or advanced
researchers to the meteorological data, services, models, and workflow, analysis and
visualization tools related to the project. Users can interactively explore the weather as it
evolves, create custom scenarios or acquire and process their own data [33].
An important issue researched by LEAD scientists is adaptive workflow, termed as
15
(WOORDS). This approach allows use of tools such as analysis or visualization
applications, models or data repositories as dynamically adaptive, on-demand Grid
enabled systems instead of static data consumers with fixed configurations. The dynamic
nature of the system allows a workflow configuration to be changed in response to
weather, respond to user decisions, initiate other processes and interact with remote
observing technologies to optimize data collection for current problem [34]. The
workflow tools provided by LEAD automates many of the otherwise time consuming and
complicated tasks by linking data management, assimilation, forecasting, and verification
applications into a single experiment [LEAD Portal].
2.1.2
OPeNDAP
Open-source Project for a Network Data Access Protocol (OPeNDAP) is a
framework that aims to simplify all aspects of scientific networking. OPeNDAP or
formerly known as DODS (Distributed Oceanographic Data System) allows access to
scientific data over the internet from applications that were not specifically designed for
that purpose. There are also some applications designed to communicate with OPeNDAP
servers. To access data OPeNDAP provides a URL, however to retrieve the data using
the provided URL users need to know the type of the data and how to request it. By
default OPeNDAP data is stored and transmitted in binary format. To provide some
information about the data OPeNDAP provides Dataset Descriptor Structure (DDS).
DDS is OPeNDAP’s version of metadata in a C-like syntax. Users can access the DDS of
16
Distributed Oceanographic Data System or DODS was originally initiated in early
1990’s as a system that would facilitate scientific data exchange between researches,
archives, industry specialists etc [36]. Two fundamental design criteria was 1) servers
must be easy to install. And 2) the system must be compatible with the existing software.
Built to satisfy these criteria today OPeNDAP is one of the major tools used especially by
ocean scientists to share data across globe. The key futures of OPeNDAP is that it allows
access to data from a wide variety of programs including existing applications, and it
provides network versions of Application Program Interface (API) libraries for most
commonly used data formats such as NetCDF, HDF, JGOFS and several others. Thus it
allows users to continue to use their applications with OPeNDAP support.
The OPeNDAP architecture uses the World Wide Web model, or the client/server
model, where the browsers submit requests to the servers and the servers respond with
the data that make up the web pages. In addition to the requesting data from the servers
OPeNDAP allows clients to browse data, request data to be translated and delivered in
some particular format, request specific part of the data etc. Also OPeNDAP allows
researchers to convert their data analysis programs such as Matlab, Ferret, IDL into
specialized web browsers.
How an OPeNDAP server and client communicate with each other is defined by
OPeNDAP protocol which consists of four components: 1- A data model used to
transport data from one source to another, 2- A Data Descriptor Structure (DDS) which
17
retrieving data and the DDS from the remote source, 4- An API to implement this
protocol [36].
The advantages of using OPeNDAP to share data over the web is explained as
follows [37]:
1. OPeNDAP server and client cooperate to deliver the data in the particular
format in which the analysis application expects, so the user need not learn
about various archival formats.
2. OPeNDAP allows users to sample the datasets in the formats supported by
his/her analysis package, thus unnecessary data exchange over the Internet is
prevented.
3. Most of the search and sampling is performed on the server machines which
reduce the Internet traffic and decrease the load on the local machine.
The interaction between an OPeNDAP client and a server can be summarized in
four steps: User sends a request to the OPeNDAP server via URLS, the URL is passed to
the HTTP server via an OPeNDAP client, the data are returned via HTTP and the
OPeNDAP client reformats the received data for user’s analysis package. There are three
basic data object types provided by OPeNDAP:
1. Data Descriptor Structure (DDS), which describes the structure of the data
set and provides syntactic metadata,
2. Data Attribute Structure (DAS) semantic metadata which gives the attributes
18
3. The data (DODS data), the actual data in a binary structure.
Major advantages of OPeNDAP over conventional file transfer protocols such as
FTP are its ability to sample data, or request only subsets of data, and the ability to
aggregate data from several remote resources in one transfer operation.
2.1.3
ROADNet
The Real-time Observatories, Applications, and Data management Network
(ROADNet) (http://roadnet.ucsd.edu), is a large scale project involving several different
types of scientific research areas and communities. ROADNet research focuses on
resolving challenges related to building wireless sensor networks for various types of
observations and the information management system which will deliver this sensor
observation in real-time to the users.
The goal of creating sensor networks to measure various entities is to enhance our
capacity to monitor and respond to changes in our environment. ROADNet collects
seismic, oceanographic, hydrological, ecological and physical data and streams to a
variety of end users in real-time [38].
ROADNet utilizes Object Ring Buffers (ORB) to capture real-time data from sensor
networks [39]. ORBs capture data from the sensors and store them for immediate use as
well as archive them for further analysis. ORB allows users to access data through a
well-defined API and provides metadata about the raw sensor observations.
To enhance the capabilities of the ORB for real-time data exchange and dynamic
reconfiguration ROADNet team has developed Virtual Object Ring Buffers or Virtual
19
ORB implementation which can be useful in federated sensor networks to act as data
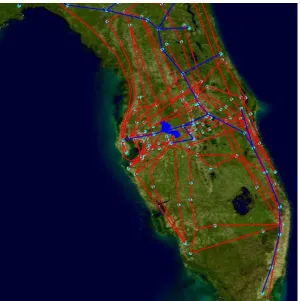
[image:27.612.108.542.123.459.2]exchange points or in developing test beds for virtual sensor networks [39].
Figure 2-1 Current ROADNet Sensor map (image taken from http://roadnet.ucsd.edu/index.html) shows several different types of sensors being utilized.
ROADNet research spans following scientific areas (source:
http://roadnet.ucsd.edu/field_research.html):
Ecology: By employing a multiplicity of sensors to monitor environmental
conditions such as physical, chemical and biological variables.
Geodesy: GPS stations are used for high-resolution, high-rate, precise position
measurements. The GPS streams are made available through internet which can be used
by surveyors to obtain real-time three-dimensional position fixes with high-level vertical
20
Hydrology: Sensors are used to monitor mountainous watersheds, precipitation,
runoff, and weather and water quality. ROADNet is proposing to build a remote sensor
network to continuously monitor hydrological and meteorological conditions of the water
resources.
Oceanography: Implementing continuous real-time data delivery helps
observational oceanography at several levels, such as understanding and modeling the
ocean and underlying crust and mantle using real-time and past data; taking necessary
steps in any emergency situations, or in educational, recreational or business purposes.
Seismology: ROADNet provides Virtual Seismic Network (VSN) for integrating
real-time data from multiple disparate seismic networks. Currently 550 globally
distributed stations are accessible through internet.
2.2
Data Stream Processing and Management
One of the major parts of our research is about processing real-time sensor streams
on-the fly. To achieve this goal we have developed real-time distributed data processing
filters extended from a generic filter class and deployed them around publish-subscribe
system. In 6.2 we describe our approach to create filter chains for more complex
processing and real-time data analysis. We use distributed filter services and filter chains
to process the data streams on-the-fly. In this section we summarize some of the related
work about issues pertaining to stream processing and management.
The Active Streams is a middleware approach and its associated framework for
building distributed applications and services [41]. In the Active Streams context the
21
data streams are sequences of self-describing data units flowing between components and
services. The data streams are made active by attaching functional units called streamlets.
Streamlets are self-contained units that operate on incoming streams and generate records
placed onto outgoing streams. Streamlets are created using E-code which is a subset of
general procedural language, and they can be obtained from streamlet repositories. A
coarse form of dynamic adaptation is obtained by attachment/detachment of streamlets
that work on data streams. Finer grain adaptation involves fine-tuning a streamlet’s
behavior via parameters, and by re-deploying streamlets to best leverage
dynamically-changing available resources over the data path [42]. Active Streams framework relies on
Echo [43] a high-performance event-delivery middleware designed to scale to the data
rates typically found in grid environments.
Echo which is developed at Georgia Tech aims to address requirements of
high-performance event-based communication in distributed systems. Echo provides
maximum bandwidth to the applications by allowing receivers to customize delivery
through derived event channels, which are mechanism that can operate at network
transmission speeds [43]. Related to our research is Echo’s filtering and transformation
ability. To support specific customizations on the event streams Echo provides derived
event channels which bears some similarities to content-based and pattern-based filtering.
Additionally Echo supports dynamic code generation (DGC) which allows general
computations on the streams. By using a derivation function applications can create a
new channel which is derived from an existing channel. This allows custom filter
22
Adapting Computational Data Streams (ACDS) system which is built on top of
Echo is a system for implementing adaptive computational data streams [44]. ACDS aims
to address the high-performance requirements for creation and management of the
large-scale data streams put forward by the distributed scientific applications. The streams are
sequence of data events, generated either in response to requests from consumers or by
the producers. ACDS supports migration, specialization, splitting and merging of these
stream computations. Some of the capabilities provided by ACDS are stream
parallelization, runtime filtering adaptation, and runtime migration of the stream
components. ACDS provides capabilities for parallelization of the stream computations
since in some cases the stream computations themselves are computationally intensive.
This motivates ‘split’ and ‘merge’ adaptations in ACDS. Runtime adaptation of the
parameters for single or sets of stream components allow data filtering at runtime.
Runtime migration of the stream components allows ACDS to deal with dynamic
variations in the node and network loads [44].
Managing and processing data streams in distributed systems are central in several
research efforts. One such example is dQUOB: dynamic Query Object system [45, 46].
dQUOB provides mechanisms to reduce end-to-end latency of the scientific data by
forwarding only the useful data. This requires ability to continuously run queries on the
data stream to strip the unnecessary parts for a specific purpose. dQUOB enables users to
create SQL-like queries and attach them into runtime components called quoblets. These
components may then be dynamically embedded into the streams at various points which
also provide distributed filtering capabilities [45]. By adopting dQUOB scientists may
23
explain that although the queries over data streams is a useful abstraction, they had
discovered that the transformation power of the rules can be enhanced by coupling a
query and a complex, user-defined function which is triggered when the query is
evaluated to true. This approach can be thought of a custom filter, based on a rule which
is created by the user.
dQUOB uses dQUOBEC, a publish-subscribe system implemented as event
channels [46]. dQUOBEC is a lightweight and efficient system for transferring binary
data as streams. It is a subject based publish-subscribe system and follows a push-based
streaming model, and also supports peer-to-peer architecture. dQUOBEC uses Portable
Binary Input Output (PBIO) [48] for binary data transfer. dQUOBEC is also used by
Calder, a stream processing engine, which aims to provide timely access to data streams
[49]. Architecture and experimental evaluation of Calder is discussed in [49, 50].
Data streams such as those obtained from the sensors and their management are
discussed in various publications. Golab and Ozsu in [51] discuss the issues in data
stream management and challenges related to executing queries on streaming data.
Telegraphcq [52, 53], Eddies [54] and Calder [50] are a few examples of Stream
Processing Engines (SPE’s) designed to process data flows. In [55] Babcock et al explain
the differences between the traditional Database Management Systems (DBMS) and the
continuous data streams. They also give a list of the data stream management projects
and propose STREAM (STanford stREam datA Manager) a data stream management
system (DSMS). In [56] and [57] Plale explains how distributed global snapshots can be
used to access streams and proposes a framework based on this idea to bring the data
24
2.3
Motivating Use Cases
2.3.1
RDAHMM
Regularized Deterministic Annealing Hidden Markov Model (RDAHMM) is an
implementation of regularized deterministic annealing expectation-maximization
algorithm (RDAEM) [58] for fitting hidden Markov Models (HMMs) [59] to time-series
data. Fitting an HMM to a time-series allows us to describe the statistics of the data in a
simple way that ascribes discrete modes of behavior to the system.
What is different in RDAEM than standard HMM time series fitting methods such
as those used in speech analysis, is that it does not require a priori knowledge about the
data. This property of RDAEM allows its use in data collected from poorly understood
25
Figure 2-2 – RDAHMM output plots for time series data collected for two years between 1998 and 2000 from GPS station CLAR which is located in the city of Claremont, California. The graphics display the displacement time series segmentation for north, east and up coordinates. This figure is
taken from [60].
RDAHMM has successfully been applied to geodetic time series in Southern
California such as daily displacement time series collected by the Southern California
Integrated Geodetic Network (SCIGN). To analyze the GPS time series data the HMMs
are first trained using a data set deterministic of the actual time series. The algorithms
segment the series based on statistical changes as identified by the trained HMMs. The
identified segments correspond to state changes or different behavioral modes in the
series. The correlations in the state changes across multiple stations at a given point of
26
detect seismic events across a region as well as signals associated with aseismic events or
long-range interactions between smaller events [61].
Figure 2-2 is an example plot of RDAHMM output given in [60]. The figure shows
that the states before and after the Hector Mine quake of October 1999 are clearly
separated, and distinct in turn from a period in 1998 in which well ground water drainage
caused displacement in the vertical direction is also identified.
Another HMM plot example is given in Figure 2-3 for the same time period.
Results show that the algorithm identified the dip due to the aquifer drainage between
days 120-250 and the Hector Mine earthquake at day 626.
Figure 2-3 – RDAHMM output plots for 800-day long GPS time series data. Figure courtesy of Robert Granat, JPL
From the point of view of our research RDAHMM is a geophysical application
which requires geographic data as input to produce a set of output. The input data is
27
We aim to provide a fully automatic integration of RDAHMM with the data sources with
ability to select single or multiple station analysis.
Another interesting research challenge we address in this research is that although
RDAHMM has traditionally been used to analyze archival GPS observations we can also
use it to analyze near-real time observations. Our architecture provides easy access to
real-time GPS observations of Southern California Integrated GPS Network (SCIGN) and
we have integrated RDAHMM with our data services to analyze the real-time data.
Details of this integration are explained in Chapter 6.
2.3.2
Pattern Informatics
As reported in [62] there have been two major types of approaches for forecasting
earthquakes. The first approach is based on empirical observation of precursory changes
such as seismic activity, ground motions and others. The second approach is statistical
patterns of Seismicity. The hypothesis behind these approaches is that the earthquakes
will occur in regions where typically large earthquakes have occurred in the past. The
Pattern Informatics (PI) [63-66] approach suggests that a more promising approach to this
hypothesis is that the rate of the occurrence of small earthquakes in a particular region
can be analyzed to assess the probability of much larger earthquakes [62].
The PI method uses observational data to identify the existence of correlated
regions of seismicity. The method does not predict earthquakes rather forecasts the
regions or so-called hotspots where earthquakes are most likely to occur in the relatively
28
Figure 2-4 – PI forecast map or hotspot scorecard shows the results of a forecast experiment for California. The time period of this experiment is January 1 2000 – December 31 2009. The green triangles represent the earthquakes occurred between 1990 and 1999, while the blue circles are the
large seismic events occurred after 2000. The scorecard indicates that 16 of these 19 significant earthquakes occurred after the work was first published in February 19, 2002. The figure is taken
from QuakeSim Website (http://quakesim.jpl.nasa.gov/scorecard.html)
The PI technique quantifies the temporal variations in seismicity patterns to identify
geographic regions with strongly correlated seismic activities. These regions are shown to
be the locations for subsequent large earthquakes. The result is a map which shows the
fluctuations in seismic activity which are found to be related to the preparation steps for
large earthquakes. In other words the PI map shows regions with hotspots where
earthquakes are likely to occur during a specified period in the future [62]. An example
29
The PI method has been applied to existing seismic observations to forecast future
seismic hotspots in various regions such as Southern California, Turkey and Japan [67].
The fact that the PI uses publicly available seismic records to forecast future earthquakes
makes it an ideal candidate for our research because our system provides access to both
real-time and non-real time geophysical records. We have harvested global and Southern
California specific seismic records off the internet and created services to access these
data. By using these services we were able to integrate PI with our architecture. This
integration is reported in Chapter 4. Sayar et al [68] reports the results of integration of
PI, our GIS data services and GIS visualization Web Services [69].
2.3.3
Interdependent Energy Infrastructure Simulation system
(IEISS)
The National Infrastructure Simulation and Analysis Center (NISAC) at Los
Alamos National Laboratory (LANL) develops advanced modeling and simulation tools
for analysis of the critical infrastructure. These tools allow authorities to understand
interdependencies, vulnerabilities, and complexities of the infrastructure and help
develop policies, investment plans, education and training etc for crisis situations. [70].
One such suite of analysis software is the Interdependent Energy Infrastructure
Simulation System (IEISS) developed at LANL with the collaboration of Argonne
National Laboratory (ANL). The goal of IEISS is to provide a comprehensive simulation
of national energy infrastructures and intra- and inter-infrastructure dependencies [70].
During our research we have worked with NISAC to develop a Service Oriented
30
input data supplied as XML files collected from various sources, and the result is locally
generated. We have used our Web Services to provide the required input data from our
geospatial databases. Additionally our map interfaces allowed users to select
geographical regions on the maps where the simulation is executed. This integration is
detailed in Chapter 4.
Figure 2-5 – IEISS screen capture shows various energy infrastructures and interdependencies between them in three-dimensional visualization. The infrastructures starting from the top layer are
31
Chapter 3
GIS Data Grid Architecture
3.1
Overview of the System
The Grid architecture we have developed for Geographic Information Systems is a
high performance, Service Oriented Architecture [72] to support coupling archived and
real-time geospatial data with scientific applications such as simulation, visualization or
data mining software.
GIS applications that require access to and processing of very large data sets are
increasing in number with the evolution of computing resources, network bandwidth, and
storage capabilities etc. At the same time some of the applications are being designed to
consume real-time data to provide near-real time analysis results; such applications are
gaining ground in systems like Crisis Management or Early Warning Systems because
they allow authorities to take action on time. Earth observation and earthquake data
32
GPS sensors which continuously collect data. However most of these tools currently
consume data from repositories and either they do not have access to real-time data or
they do not have the capability to analyze data on the fly.
We utilize GIS standards and Web Services methodologies to couple data
assimilation tools with real-time and archived geospatial data. The system uses
publish/subscribe [73] based messaging substrate to provide high performance data
transfer between data sources and the client applications. Standard GIS interfaces and
encodings like Geography Markup Language (GML) [10], GML-Observations and
Measurements (OM) [74] and Sensor Markup Language (SensorML) [75] allow data
products to be available to the larger GIS community. The architecture supports seamless
access to both archival and real-time geospatial data through standard Web Services
interfaces. Although the issues related to online and offline geographic data differ, our
architecture provides a common platform for suppliers to make their data sets available
without much effort and easy to use tools for users to access this data.
Geographical data can be classified in two major categories according to their
sources: Online or real-time measurements collected from sensors and offline or archived
records.
Archival geospatial data has been in the core of almost every GI System since the
first example. Long history of mapping, topography and related scientific activities has
created huge spatial repositories and with the development of computing resources
numerous instances of software were produced to consume and analyze these data.
Because of the need to create universal data and service standards for the GIS
33
This research has yield to very successful outcomes and the standards produced are being
adopted in every part of the world. In addition to the standards development the internet
revolution helped geospatial data to be used and integrated into very diverse web based
developments. Every day we see new examples of web sites offering access to some form
of geographic data. Online mapping tools, driving direction tools, store locators are just a
few examples. Web GIS, Internet GIS or Distributed GIS are some of the terms used to
describe these online GIS related activities [2].
Although there is enormous demand to utilize the spatial data online much of the
research in this area has been about developing data format and service standards. While
the GISystems are migrating from the traditional stand alone desktop applications or
LAN based desktop GIS to distributed systems [2] there is an obvious lack of thrust
towards service based approaches. The distributed GI services are mostly developed as
traditional, well known client/server architectures such as Java Servlets. In this chapter
we describe our approach which not only adopts the latest industry standards but also
conforms to Service Oriented Architecture principles.
3.2
Major Components of the Architecture
Taking into account the two types of the geospatial data, our architecture consists of
two major parts:
1 - GIS Data Grid for providing unified access to archived, offline geographic data
stored in various distributed databases,
2 – Real-Time Data Services to provide access to online, real-time sensor
34
Each of these parts consists of several Web Services and separately they provide
access to different types of data hence they can be thought of independent Grid
architectures. Therefore the complete SensorGrid architecture is an example of the Grid
of Grids [29] paradigm.
We discuss the details of these parts in the consecutive chapters; here we give a
short overview of the architecture and the service components.
The most important component of the Archival Data Grid is the Web Feature
Service [15]. Web Feature Service (WFS) is an Open Geospatial Consortium [76] service
for sharing vector geographic data on the web. Details of this service are discussed in
Chapter 4, here we only discuss how it is used in the overall architecture. The WFS
accesses various geospatial databases to retrieve and present the data to the users in a
standard format. However because the specification describes a HTTP GET/POST based
service we have extended it by implementing a Web Service version which allowed us to
integrate several installations of this service and other Web Services to create Grids for
particular purposes. For instance a Web Map Service [14] can be used to provide an
interface to the WFS and allow users to interact with it via online maps. Reference [68]
demonstrates one such example.
Although the first Web Service version of the WFS was successfully used in several
GIS Grid projects, for several reasons explained in Chapter 4 and 5 we have created a
streaming version, which uses a publish/subscribe system to stream data to the clients.
This method allows the WFS to serve arbitrarily large amount of geographic data in high
35
Therefore our archival GIS Grid architecture has two major types of data services,
streaming and non-streaming WFSs. Users may choose to use any one of these services
depending on the capabilities implemented on the client side. The non-streaming WFS is
a traditional Web Service which does not require any additional capabilities on the client
side, however to use the streaming version the clients need to implement streaming
publish/subscribe API. Furthermore our services have additional capabilities for
performance improvements such as Binary XML framework integration for shrinking the
query results in XML. To use these capabilities the clients need to have appropriate API
implementations. However existence of these capabilities does not prevent Web Service
clients from using the basic WFSs since they can serve the results in simple XML
Schema types.
The second part of the overall architecture is the Real-Time Data Grid which
consists of Real-Time Filter services and publish/subscribe messaging system. We
explain the details of this architecture in Chapter 6. The Real-Time Filter Services are
data processing or analysis applications exposed as Web Services and connected with
each other via publish/subscribe messaging substrate. Real-time messages collected from
sensors are processed using these services. Filters are usually connected as chains to
realize complex tasks. The fact that they use a topic based publish/subscribe system
provides us an important ability to access original and processed data products via
different topics. This method allows creation of many different types of chains for
various tasks. The system provides continuous access to sensor streams for large number
36
the number of sensors or clients the system can support. Chapter 7 gives detailed
performance evaluation of the Real-Time Data Grid architecture.
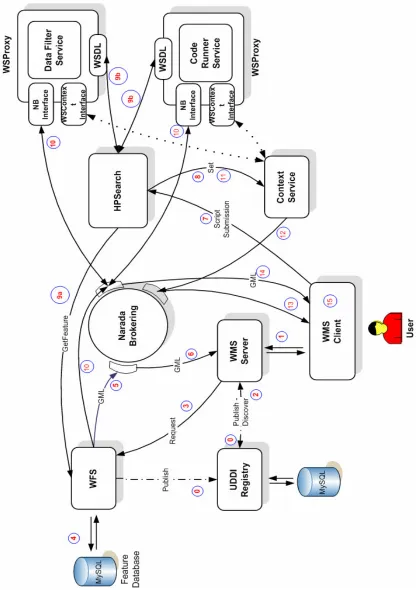
Figure 3-1 - SensorGrid Architecture consists of archival and real-time services. A publish/subscribe
messaging system is used to stream large archival data and real-time sensor messages to the clients.
Figure 3-1 illustrates the overall SensorGrid architecture with both archival and
real-time data services. The major components in the system are Web Feature Service,
Streaming-Web Feature Service, Real-Time Filter Services, Publish/Subscribe Messaging
System and Registry Service.
All services in the system have traditional Web Service endpoints or WSDL [78]
URLs. To provide easy access and search capabilities for the active services in the system
37
architecture is a specialized implementation of the UDDI specification [79] which has
GIS specific extensions. This UDDI registry service is part of a larger Information
Services project developed in Community Grids Lab [80], more information can be found
in [81-86].
Each service in the system publish its WSDL URL to the UDDI [79] registry at the
time of initialization. The registry service URL is supplied to the services before
initialization. The registry service also provides search capabilities, which is useful for
discovering particular GIS capabilities by the users. For instance a user may want to see
WFS instances which have access to data for a particular geographic region, or sensors
physically located in a particular region. We also have a JSP interface (Client Proxy) that
displays the available services and sensors in the registry and makes use of UDDI
service’s search capabilities for the user. Using this interface the clients can view the
capabilities of each service, available geographic features, and real-time sensors or filter
services. The Client Proxy also provides the required information to the client for
receiving streaming real-time messages.
To summarize the architecture we go back to Figure 3-1:
• The dotted lines represent one time access to the UDDI registry by other services
to register their WSDL URLs at the time of initialization. The streaming and
non-streaming WFSs access to GIS databases using JDBC connections. We use
several MySQL [87] databases for this purpose.
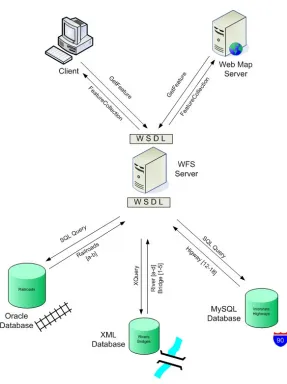
• The WFS communicates with the Client as a traditional Web Service, request and
response SOAP messages are transported over HTTP. The streaming-WFS is