Physics and Astronomy Publications
Physics and Astronomy
1-1999
Optical properties and electronic structures of B2
and B19′ phases of equiatomic Ni-Ti alloys
Joo Yull Rhee
Hoseo UniversityBruce N. Harmon
Iowa State University, [email protected]
David W. Lynch
Iowa State University, [email protected]
Follow this and additional works at:
http://lib.dr.iastate.edu/physastro_pubs
Part of the
Atomic, Molecular and Optical Physics Commons
, and the
Condensed Matter
Physics Commons
The complete bibliographic information for this item can be found athttp://lib.dr.iastate.edu/physastro_pubs/104. For information on how to cite this item, please visithttp://lib.dr.iastate.edu/howtocite.html.
Optical properties and electronic structures of B2 and B19′ phases of
equiatomic Ni-Ti alloys
Abstract
The dielectric functions of equiatomic Ni-Ti alloys were measured by spectroscopic ellipsometry in the energy
range of 1.5–5.4 eV at
∼
423 and at
∼
25 K. The peak at
∼
2.26 eV in the B19′ (monoclinic structure) optical
conductivity spectrum has a slightly larger magnitude than in the B2 (cubic CsCl structure) phase, while the
shoulder at
∼
3.5 eVbecomes weaker and almost indiscernible upon martensitic transformation. A new
structure develops at
∼
2.85 eV in the B19′ phase; however, it is also very weak. The band structures and the
optical conductivity were calculated in both phases using the linearized-augmented-plane-wave method
within the local-density approximation. k points near the Γ−X−M plane in the B2 phase and the
corresponding k-points in B19′ phase contribute significantly to all three structures. The difference between
the two spectra is due to the transitions between the folded-back bands from the B2phase because of the
larger unit cell of the B19′ phase and the change in the electronic energy spectrum near the Fermi level. The
overall optical properties of Ni-Ti alloys in the measured energy range are rather insensitive to the martensitic
transformation because the states far from the Fermi level are mainly involved in the interband transitions.
Keywords
Ames Laboratory, monoclinic structure, martensitic transformation
Disciplines
Atomic, Molecular and Optical Physics | Condensed Matter Physics | Physics
Comments
This article is from
Physical Review B
59 (1999): 1878, doi:
10.1103/PhysRevB.59.1878
. Posted with
permission.
Optical properties and electronic structures of B2 and B19
8
phases of equiatomic Ni-Ti alloys
Joo Yull Rhee
Department of Physics, College of Natural Sciences, Hoseo University, Asan, 336-795 Choongnam, Korea
B. N. Harmon and D. W. Lynch
Ames Laboratory-U.S. Department of Energy and Department of Physics and Astronomy, Iowa State University, Ames, Iowa 50011
~Received 13 July 1998!
The dielectric functions of equiatomic Ni-Ti alloys were measured by spectroscopic ellipsometry in the energy range of 1.5–5.4 eV at ;423 and at ;25 K. The peak at ;2.26 eV in the B198 ~monoclinic structure!optical conductivity spectrum has a slightly larger magnitude than in the B2~cubic CsCl structure! phase, while the shoulder at;3.5 eV becomes weaker and almost indiscernible upon martensitic transforma-tion. A new structure develops at ;2.85 eV in the B198 phase; however, it is also very weak. The band structures and the optical conductivity were calculated in both phases using the linearized-augmented-plane-wave method within the local-density approximation. k points near theG-X-M plane in the B2 phase and the corresponding k-points in B198phase contribute significantly to all three structures. The difference between the two spectra is due to the transitions between the folded-back bands from the B2 phase because of the larger unit cell of the B198phase and the change in the electronic energy spectrum near the Fermi level. The overall optical properties of Ni-Ti alloys in the measured energy range are rather insensitive to the martensitic transformation because the states far from the Fermi level are mainly involved in the interband transitions.
@S0163-1829~99!06403-6#
I. INTRODUCTION
The intermetallic NiTi compound undergoes a martensitic transformation ~MT! from the austenitic B2 phase at high temperature (>333 K) to the martensitic B19
8
phase upon cooling.1 The compound has been studied extensively be-cause of its peculiar structural phase transition as well as its technological importance. It exhibits the so-called shape-memory effect2 that accompanies the MT. If the alloy has a particular shape at a temperature above TM ([333 K) and is deformed into another shape at a temperature below TM, it ‘‘remembers’’ and transforms back to its original shape upon heating above TM. The transition also shows large hysteresis in electrical resistivity, Hall coefficient, sound velocity,3and magnetic susceptibility3–5upon cooling and heating.After the first observation of the MT, Wang and his colleagues2explained the MT as an electronic phase transi-tion such that at least some of the valence electrons become ‘‘metallic’’ ~delocalized: NiTi-II! from ‘‘covalent’’ ~ local-ized: NiTi-III!at the MT.3This electronic charge transfer is described by shifting the s-band relative to the d band. The Fermi level increases about 1.1 eV, while the shapes of the s-and the d-bs-and density of states ~DOS! do not vary.6 This model could successfully explain the low-temperature spe-cific heat, magnetic susceptibility, enthalpy and Hall coeffi-cient changes during the MT. However the Fermi energy shift is rather large. Furthermore soft-x-ray appearance po-tential spectroscopy measurements7 show that there is no evidence of band structure shifts and give an upper limit of 0.1 eV on any change of the width of the empty d-band, which is an order of magnitude smaller than the 1.1 eV shift of the Fermi level estimated by Mitchell, Wang, and Cullen.6 It was also shown that the electron transfer between Ni and Ti atoms accompanies changes in stoichiometry but is not
characteristic of the B2→B19
8
phase transition.Shabalovskaya et al.4suggested that an electronic charge redistribution upon MT occurs, accompanied by the variation of the Fermi surface without any essential energy displace-ment. The idea of the variation of the Fermi surface was further developed by Egorushkin8,9 by investigating the Fermi surface nesting and electron-phonon interaction. Zhao and co-workers10,11also investigated the phonon anomaly in
b-phase NiTi. They used a first-principles linear-combination-of-atomic-orbitals method to calculate the en-ergy band structure, which was fitted with a non-orthogonal tight-binding Hamiltonian. The nesting effects of the Fermi surface were found and phonon dispersion curves were cal-culated. The Fermi surface nesting causes the phonon mode
near Q05( 2 3,
2
3,0)(p/a), arising from strong electron-phonon coupling, to go soft. This is responsible for the pre-martensitic transition, the B2→R ~intermediate phase! tran-sition.
Fermi surface nesting led to an alternative point of view.12 A static distortion of the conduction-electron density and the lattice @charge-density wave ~CDW!# occurs during a MT. The divergence is due to the geometrical peculiarities of the Fermi surface, so q is determined by the Fermi surface nesting.12
There are several band-structure calculations of B2 phase NiTi. The first self-consistent augmented-plane-wave calculation13showed Fermi surface nesting, which is closely related to anomalies of the phonon dispersion observed in inelastic neutron scattering14 and ultrasonic attenuation experiments.15 The authors also suggested that the nesting effects are related to an incommensurate CDW.13
Eibler, Redinger, and Neckel16 calculated the band struc-tures of intermetallic compounds M Ti ( M5Fe, Co and Ni!
PHYSICAL REVIEW B VOLUME 59, NUMBER 3 15 JANUARY 1999-I
PRB 59
in the B2 structure. The calculated x-ray photoemission spectra were in good agreement with experiment if a self-energy correction was employed. They recently calculated the band structures of NiTi and PdTi in the B2 phase.17The calculated DOS with lifetime broadening showed a close re-semblance with measured photoelectron spectra. Their band structure is almost the same as that of Ref. 13 except for some differences in the symmetry assignment of the eigen-values and one missing band. However, Lapin et al.18 show somewhat different results from these two calculations, espe-cially around the M point.
There are several band structure calculations19–21for NiTi in the B19
8
phase. Recently Ye, Chan, and Ho21studied the structural and electronic properties of martensitic alloys ~NiTi, PdTi, and PtTi!. They used first-principles total-energy calculations to determine the equilibrium structure and concluded that the ground-state martensitic phase (B198
) is indeed lower in energy than the high-temperature B2 phase. The lowering of energy is associated with the lowering of the DOS at the Fermi level at the Ti site and the broadening of the Ni d band in the B198
phase, indicating stronger bonding between Ni and Ti in the martensitic phase. Recently Wang et al.22calculated the optical conductivity ~OC! spectra of various transition-metal titanides in the B2 and B19 or B198
phases. They used the equilibrium struc-tural data obtained by the Ye et al.21and found a significant change in the OC spectra of NiTi alloys between the B2 and B198
phases, especially in the 0.5–1.5 eV energy rangewhere a substantial OC change was observed
experimentally.23 They also calculated the polarization de-pendent OC in the martensitic phase.
Nearly 20 years ago the dielectric functions for both phases were measured23by spectroscopic ellipsometry in the 0.07–4.9 eV range. Three peaks were observed in the B2 phase above 2 eV but only two peaks in the B19
8
phase. However the magnitude does not change much upon MT. Some large changes occur below 1.5 eV. The structures be-low 1.5 eV are rich and change substantially upon MT, in-dicating an alteration of the electron energy spectrum in the vicinity of EF. The authors claimed that the alteration is attributed to the opening of gaps in the B198
phase, resulting from the splitting of degenerate d states.The OC spectra were calculated earlier without inclusion of the dipole-transition matrix elements.19,20 The calculated OC spectra for the B2 and B19
8
phases agreed reasonably well with measured ones.23 However, as shown below and elsewhere for Ni3Al,24the inclusion of matrix elements, life-time broadening, and the self-energy correction are very im-portant for reliable comparison with experiment.In this work we report the OC spectra measured in the energy range of 1.5–5.4 eV using a spectroscopic rotating-analyzer ellipsometer25 and calculations of band structure and OC spectra for both phases. The dipole-transition matrix elements were taken into account for the OC calculations. The measured OC spectra did not show as many structures as those of Ref. 23 above 2 eV. Specifically we did not observe the peak around 2.6 eV. However, we observed a little change upon MT. For the B19
8
phase calculation we used lattice parameters from new x-ray diffraction data26~slightly different from the previous measurement1!, which give more reasonable band structures and DOS. The justification forusing the new data is more thoroughly discussed by Ye, Chan, and Ho.21
II. EXPERIMENT
The alloy sample was produced by fusing iodine titanium and electrolytic nickel with purities of 99.999% in an electrolytic-arc furnace in a helium atmosphere. Sixfold fu-sion was used to ensure the homogeneity of the alloy sample. The weight loss was less than 0.1%. A nearly equiatomic NiTi alloy of composition Ni49.8Ti50.2was finally prepared. It was then cut by a low-speed diamond saw to a shape appro-priate for optical measurements. An optically reflecting sur-face was obtained by mechanical polishing with a series of alumina powders down to 0.05 mm diameter. The sample was then cleaned with acetone and methanol in an ultrasonic cleaner. We put the sample in an ultrahigh vacuum ~UHV! chamber for high-temperature measurement. The high tem-perature (;423 K) was achieved by baking the whole chamber to 150 °C. During the baking we measured for the B2 phase. The B19
8
phase was measured at;25 K, using a closed-cycle helium refrigerator. The spectroscopic rotating-analyzer ellipsometer and the closed-cycle helium refrigera-tor are described in detail elsewhere.25 The B198
phase is monoclinic, with three independent diagonal components in the OC tensor, and one off-diagonal component. Our poly-crystalline sample was sufficiently fine grained that we mea-sured an average of the components.III. CALCULATIONS
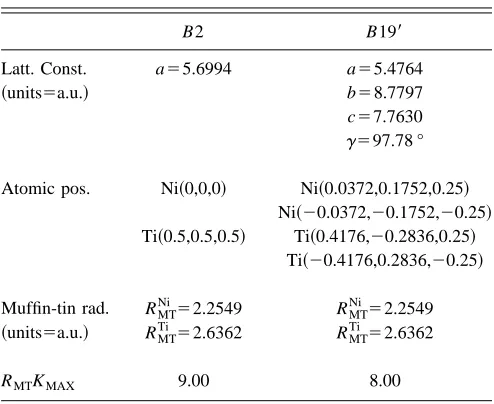
The self-consistent band structures for both phases were calculated using a scalar-relativistic version of the linearized-augmented-plane-wave ~LAPW! method27 within the stan-dard muffin-tin approximation for the potential. The spin-orbit interaction was included in the self-consistent iteration in such a way that the spin-orbit Hamiltonian was diagonal-ized after the scalar-relativistic bands and wave functions had been calculated. The core states were treated fully rela-tivistically in the frozen core approximation. The muffin-tin radius was chosen so that each sphere almost touches the neighboring spheres. The potential was spherically symmet-ric inside the muffin tin and constant outside. Parameters used in the calculation are summarized in Table I. For the B19
8
phase the inversion symmetry center was chosen as the origin. The local-density approximation of Hedin and Lundqvist28 to the density-functional formalism was used to include the exchange-correlation contribution to the poten-tial.A 150–160 LAPW basis function set for the B2 phase and 235 to 255 LAPW basis function set for the B19
8
phase, depending on the k point, were used for each self-consistent iteration. The energy eigenvalues at 120 k points in the irre-ducible Brillouin zone (IBZ5481 of the BZ!for the B2 phase were calculated. However, 250 k points in IBZ (514 of the BZ!for the B198
phase were used in the self-consistent it-erations.Once the self-consistent potential and charge were ob-tained, we calculated the DOS and OC spectra using the linear-energy-tetrahedron method.29 The usual direct inter-band transitions were assumed for the OC calculation. 512
tetrahedra in the IBZ, corresponding to 24 576 tetrahedra in the whole BZ for the B2 phase, and 1536 tetrahedra in the IBZ corresponding to 6144 tetrahedra in the whole BZ for the B19
8
phase were used in the calculation. For the B198
phase the number of tetrahedra is 14 of that of the B2 phase. However, the unit-cell volume of the B198
phase is almost twice as large as that of the B2 phase, resulting in four atoms ~two Ni atoms and two Ti atoms!in the unit cell for the B198
phase. Therefore, we believe that the smaller number of tet-rahedra for the B198
phase will cause little error. Effects of the quasiparticle self-energy are included by the methods de-scribed elsewhere.24IV. RESULTS AND DISCUSSION
The measured OC spectra are shown in Fig. 1. In the measured energy range the interband transitions are predomi-nant. We can clearly see two structures in the spectrum of the B2 phase: one peak at ;2.26 eV and one shoulder at ;3.5 eV. At the MT the intensity of the lower peak in-creases. The magnitude of the upper shoulder decreases and the spectrum of the B19
8
phase has an almost indiscerniblestructure around 3.5 eV. On the other hand, a new structure appears at ;2.85 eV. Most of the interesting change in the OC at the MT occurs in the infrared~IR!region.23However, we could not measure the IR region because of the spectral limitation of our measurement system. General shapes of the spectra and the trend of change upon MT is very similar to the previous measurements.23 However, there are some dif-ferences.
First, we could not observe peaks at 2.65 and 3.2 eV for the B2 phase and a peak at 2.65 eV for the B19
8
phase, all of which were reported in Ref. 23. Rather, we observed a weak shoulder at ;3.5 eV for both phases and another weak shoulder ;2.85 eV in the B198
phase. Although we ob-served a weak shoulder around 3.5 eV for the B198
phase, it is so weak that it is almost indiscernible. Second, the mag-nitude of the OC measured by us is 35–50 % higher than that of Ref. 23 in the measured energy range.In the previous measurements,23 the 3.5-eV peak for the B2 phase gets weaker and becomes just a weak shoulder upon MT. The trend is consistent with our measurements. And the fact that the lower-energy peak increases upon MT is also consistent with our results. However, the region around 2.8 eV needs to be understood more clearly.
The difference in magnitudes of the OC between the pre-vious measurements23 and ours can be explained by the dif-ferent methods of sample preparation. The authors of Ref. 23 electropolished the sample in an aged chloroacetic electro-lyte (20% HClO4180% acetic anhydride by volume!after mechanical polishing. Electropolishing makes the sample surface rough, because of nonuniform removal of the surface layer, and leaves some chemical overlayer. The surface roughness decreases the measured OC.25,30 The chemical overlayer may or may not decrease the OC. Although elec-tropolishing may reduce the magnitude of the measured OC, it has one advantage. Since it removes the cold-work layer and reveals the crystal structure, the measured spectra may carry more accurate information on interband transitions. Our sample was only mechanically polished and, hence, the surface is almost ‘‘amorphous’’ and the sharp structure viewed in the spectra of Ref. 23, especially the 2.65-eV peak for both phases and the 3.2-eV peak for the B2 phase, may smear out. This kind of smearing in the measured dielectric functions for an amorphous material versus that of the cor-responding crystalline one is seen in a-Si.31
However, in our sample the smearing of the 2.65-eV peak, due to the amorphization or deformation of the sample surface by mechanical polishing, is unlikely because we measured the OC spectrum of the B19
8
phase after the UHV chamber and the sample were cooled down to room tempera-ture after baking and, then, the sample holder was cooled down by the closed cycle helium refrigerator. As shown in Refs. 32 and 33, the baking of the UHV chamber at 150 °C can easily recrystallize the damaged surface due to mechani-cal polishing. In addition, the mechani-calculation~see below!shows no structure around 2.6 eV for the B2 phase. Therefore, we argue that there is no peak around 2.65 eV for the B2 phase; however, there must be some interband transition enhance-ment in the B198
phase. [image:5.612.51.298.68.270.2]In order to understand these changes we carried out the band structure and OC spectra calculations. The band struc-tures for the B19
8
phase along some high-symmetry lines areTABLE I. Parameters used in the calculations.
B2 B198
Latt. Const. a55.6994 a55.4764
~units5a.u.! b58.7797
c57.7630
g597.78 ° Atomic pos. Ni~0,0,0! Ni~0.0372,0.1752,0.25!
Ni~20.0372,20.1752,20.25! Ti~0.5,0.5,0.5! Ti~0.4176,20.2836,0.25!
Ti~20.4176,0.2836,20.25! Muffin-tin rad. RMTNi52.2549 RMTNi52.2549
~units5a.u.! RMT Ti
52.6362 RMT Ti
52.6362
RMTKMAX 9.00 8.00
FIG. 1. The OC spectra of the B2 phase~solid line!and B198 phase~dashed line!of the equiatomic NiTi alloy. Note that the zero of the optical conductivity is suppressed.
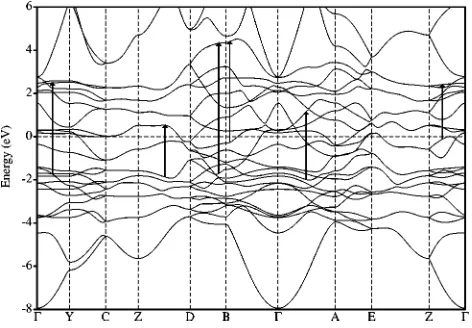
[image:5.612.61.291.548.719.2]shown in Fig. 2. ~See Fig. 4 of Ref. 33 for the B2 phase.! The arrows drawn in the figures denote the direct interband transitions, which have prominent intensities. There are, of course, other transitions, which are still strong but not along the high-symmetry lines. This will be discussed later.
For the B2 phase the band structures are very similar to most other calculations.11,13,16–18 However, there are some discrepancies. The lowest eight bands around the M point are located below the Fermi level in Ref. 18, while only the lowest six bands are below the Fermi level in Ref. 11 and Ref. 17. The bottom of the seventh band in the G-M direc-tion slightly touches the Fermi level at 3/4 of the way to the M point in Ref. 11 and Ref. 17 but not in Ref. 18. Our calculation shows the same results as Ref. 11 and Ref. 17, except for our inclusion of spin-orbit splitting of some bands along some high-symmetry lines and points.
For the B19
8
phase the calculated band structure shows a larger number of bands than that of the B2 phase, because of more atoms in the unit cell ~two atoms per unit cell for the B2 phase and four atoms for the B198
phase! and is very similar to that of Refs. 20 and 21 except for the spin-orbit splitting. One slight difference exists: the 16th band at the B point may or may not be occupied in Ref. 20, while our calculation, as well as that of Ref. 21, shows that it is unoc-cupied.Our DOS curves for the both phases are essentially the same as those of Ref. 21, since we used the same crystal structure newly refined by Kudoh et al.26 However, for the B19
8
phase the DOS curves calculated by Ye, Chan, and Ho21and by us have a different shape from those calculated by Bihlmayer, Eibler, and Neckel,20who used the old crystal structure data.1 The most striking result is that the Fermi level falls on a relatively deep local minimum of DOS curves in our calculations and in those of Ye, Chan, and Ho, while in Ref. 20 it is located at a rising edge of the DOS. The location of the Fermi level at a local minimum of the DOS is closely related to the stability of the crystal structure. As shown by Ye, Chan, and Ho21the B198
phase has the lowest total energy among the competing structures, B2, B11, B19, and L10. Although the DOS of the B2 phase in Ref. 21 has a shallow local minimum at the Fermi level, ours does not have any local minimum in the vicinityof the Fermi level ~see Fig. 5 of Ref. 33!. Also, the greatest stability and the strongest covalency of FeTi among three transition-metal titanides ~FeTi, CoTi, and NiTi! in the B2 phase was explained by the fact that only FeTi has a deep minimum in the DOS at the Fermi level, while it is located at a shallow local minimum~CoTi!or at a rising edge~NiTi!of DOS.33 This has the consequence that the stability of the three alloys in the B2 phase is on the order (FeTi.CoTi
.NiTi). Therefore, we conclude that the newly discovered crystal structure26 for the B19
8
phase NiTi is more suitable than the old one1and gives a better description of DOS and structural stability for the B198
phase.The calculated OC spectra were broadened by an energy-dependent Lorentzian function of width given by G(E)
5AE2 eV, where E5@Ef(k)2Ei(k)#, in eV, to simulate the effects of the imaginary part of the quasiparticle self-energy and the instrumental resolution. We set the limit for G(E)max52.5 eV. After broadening the overall shape of the calculated spectra are similar to that of the measured ones, however, the energy positions of peaks and shoulders do not match. Therefore we used the real part of self-energy correc-tion described in Ref. 24. The corrected optical conductivity,
sˆ (vˆ ), is given by
sˆ~vˆ!5 1 11ls
S
v
11l
D
,wheres(v) is the uncorrected optical conductivity. The pa-rameter l has the effect of changing the excited-state ener-gies Eˆn(k) relative to the energies, En(k), calculated from the ground-state potential, given by
Eˆn~k!5En~k!1l@En~k!2EF#. ~1!
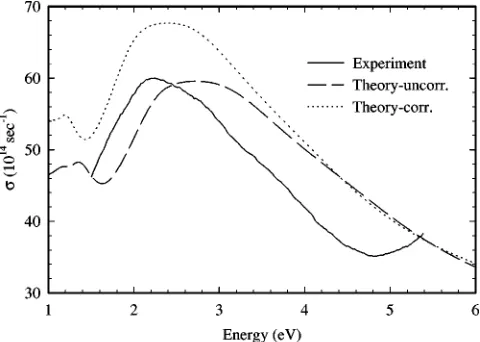
[image:6.612.57.293.58.222.2]Although the parameterl is dependent on the band index n and the wave vector k, we assumed it to be constant. There-fore, the introduction of the parameterl does not create any new features in the OC spectrum but just shifts the whole spectrum to lower or higher energy depending on the sign of l. It also reduce or enhance the magnitude of the spectrum. The self-energy effects, due to the increase of energy of ex-cited states below the Fermi level relative to the energy cal-culated from the ground-state potential, may lower the en-ergy position of the calculated spectral features to the measured one.34 It is not difficult to find the similar effects.24,33–35The fitting parameters, A,G(E)max, andl, are summarized in Table II. As shown in Fig. 8 of Ref. 33 for the B2 phase and Fig. 3 for the B19
8
phase, the broadening and self-energy correction markedly improve the agreement between experimental and theoretical OC spectra. For the purpose of comparison for both phases we redraw the theo-retical spectra in Fig. 4. As can be seen in Fig. 4, all three changes observed in the experiments ~enhancement of theFIG. 2. Band structure of NiTi in the monoclinic (B198) struc-ture along some high-symmetry lines. The optical direct interband transitions corresponding to the measured peaks are denoted by the arrows.
TABLE II. Fitting parameters for the real (l) and imaginary (A and Emax) parts of the self-energy.
A (eV) Emax (eV) l
B2 0.15 2.5 20.20
B198 0.12 2.5 20.10
[image:6.612.314.561.84.137.2]2.26 peak, new structure at ;2.85 eV, and decrease of the 3.5-eV shoulder in the B19
8
phase!are clearly evidenced in the theoretical calculations.Previously, we made a comparative study of the OC spec-tra of FeTi, CoTi, and NiTi.33 It was shown that the higher peak (;3.5 eV) is insensitive to the change of the number of valence electrons in a formula unit, while the lower peak (;2 eV) is very sensitive to the change. The band structure calculations show that the Fermi level moves ;1.0 eV to higher energy going from FeTi to NiTi. This shift is suffi-cient to change the occupation of several bands near the Fermi level, resulting in an alteration of the low-energy peak and even a splitting in the FeTi alloy.
Although the MT could not shift the Fermi level this much, it is enough to change the band structure near the Fermi level and the shape of the Fermi surface, and so on. Therefore, the lower the optical-transition energy, the greater the possibility of involving bands near the Fermi level, either initial or final states, and the more sensitive to the MT. Our measured and calculated spectra are consistent with this; the changes in the 2.26-eV peak and the 2.85-eV shoulder are more sensitive to the MT than the 3.5-eV shoulder.
To understand the OC spectra and their change upon MT more thoroughly, it is desirable to know which parts of the BZ are predominantly involved in the optical transitions, es-pecially those corresponding to the strong peaks and shoul-ders. For this purpose we analyzed the information on the k points and bands contributing strongly to the structures of the OC spectra. The k points whose optical transitions are strong along the high-symmetry lines are shown as arrows in Fig. 2 for the B19
8
phase and Fig. 4 of Ref. 33 for the B2 phase.For the B2 phase a large portion of the BZ near the G-X-M plane contributes to the 2.26 eV peak and the k points near the G-X-R plane also contribute. How-ever, the latter is significantly weaker than the former. Other strong transitions were from some high-symmetry lines such as the G-X, G-M , and X-R lines, especially near the X point. The transitions involved in this peak are mainly 4th→8th, 5th→8th, and 6th→9th. For the B19
8
phase the k points contributing to the 2.26-eV peak are similar to those in the case of the B2 phase, if we convert the k vector into the coordinates of the B2 phase. The main transitions for the B198
phase are 9th →15th, 9th→16th, 10th→15th, 10th→16th, and 14th →20th, 21st, and 22nd. Although the characteristics of the k points and the band pairs for the 2.26-eV peak for both phases are similar to each other, there are very strong tran-sitions for the B198
phase from band 14 to bands 20, 21, and 22 that are absent in the B2 phase and these transitions are allowed because of the bands folded back from the B2 phase to the B198
phase. The 14th band in these transitions is lo-cated near the Fermi level—approximately 0.02– 0.26 eV lower than the Fermi level—and is sensitive to the MT. These newly allowed transitions give contributions to the increase of the OC in the B198
phase.For the 3.5-eV shoulder, the situation is very similar to the case of the 2.26-eV peak in the B2 phase. The only differences are the final states; they are in the 10th, 11th, and 12th bands. Although for the B19
8
phase the portions of the BZ involved in this energy region are quite similar to those in the case of the B2 phase, the bands are somewhat differ-ent. There are still appreciable transitions from the 14th band to the 22nd, 23rd, and 24th bands and there are also signifi-cant contributions from the transitions fifth–seventh→19th bands. However, in Ref. 19 it was shown that there is some but not a significant difference in JDOS between the B2 and B198
phases and, hence, the strength of the transitions for the B198
phase must be much weaker than that of the B2 phase due to the smaller transition matrix elements, resulting in the weakening of the 3.5-eV shoulder in the B198
phase. We analyzed the band characters of the initial and final states of the transitions responsible for this peak. Bands 4, 5, and 7 ~initial states!of the B2 phase have mainly Ni 3d character with very small Ti 4 p character, and bands 11 and 12~final states!have mainly Ti 3d character, but with an appreciable amount Ni 4 p, resulting in a significant magnitude of the transition matrix element. Bands 5, 6, and 7~initial states!of the B198
phase have mainly Ni 3d character and band 19 ~final states!has mainly Ti 3d character. All the above bands have a negligible amount of p character, yielding a small magnitude of the transition-matrix element. The situation is quite similar to the case of the transitions from bands 10–15 to bands 22 and 23. The lower bands have either mainly Ni [image:7.612.55.295.58.229.2]FIG. 3. Comparison of experimental and theoretical optical con-ductivity spectra for the B198 phase. Two smoothed theoretical spectra ~with and without self-energy correction!are shown. Note that the zero of the optical conductivity is suppressed.
FIG. 4. Theoretical optical conductivity spectra for both phases. Spectra with and without self-energy correction are shown. Note that the zero of the optical conductivity is suppressed.
3d character~bands 10 and 15!or an admixture of Ni 3d and Ti 3d characters and the upper bands have mainly Ti 3d character~band 22!or an admixture of small amounts of all characters~Ni 4s,4 p, and 3d and Ti 4s,4 p, and 3d) with-out any predominant character. Therefore, we argue that the weakening of the 3.5-eV shoulder in the B19
8
phase is due to the reduction of the p character in the electronic wave func-tion of the final states upon the MT.Since a weak shoulder develops around 2.85 eV in the B19
8
phase, we also investigated this region. The portion of the BZ for the B2 phase is similar to the case of the 2.26-eV peak, but, the initial states are lower bands than those of the 2.26-eV peak; bands 2, 3, and 4. Some other transitions, such as 5th→10th and 6th→10th, are also observed. For the B198
phase these are transitions from bands 9–12 to bands 15–18. In this energy range the enhancement of the OC in the B198
phase is also due to the newly allowed transitions between the folded-back bands.Therefore, we can conclude that the change in the OC spectra in the measured energy range upon MT is due to the band folding-back for all three structures, change in the en-ergy spectrum near the Fermi level for the emergence of 2.85-eV shoulder, and change in transition matrix elements for the 3.5-eV shoulder. The occupied bands ~initial states! have mainly Ni d character with an admixture of Ti d char-acter, and the unoccupied bands~final states!have predomi-nantly Ti d character.
V. CONCLUSION
We measured the OC spectra for the B2 and B19
8
phases of NiTi equiatomic alloy. Although we did not observe the rich features found in previous measurements,23 we found some change upon MT. The electronic structure and the OC calculations were done for both phases. The agreement be-tween experiments and calculations were fairly good after an energy-dependent Lorentzian broadening and the self-energy correction were included. The calculations show that the change of the OC spectra upon MT is due to transitions between the folded-back bands, the change in the energy spectrum near the Fermi level and the change in transition matrix elements. Since the MT alters the energy spectrum near the Fermi level, but not much for the levels far from the Fermi level, further study of the OC spectra in the IR region is needed for more accurate understanding of the effects on the optical properties upon MT.ACKNOWLEDGMENTS
We wish to thank Dr. S. Shabalovskaya for providing us with an alloy sample and some helpful discussions. One of us ~J.Y.R.! was supported by the Basic Science Research Institute Program, Ministry of Education, Project No. BRSI-97-2459. A part of the theoretical work was done by using a CRAY C-90 supercomputer in SERI, Korea. The Ames Laboratory is operated for the U.S. Department of Energy by Iowa State University under Contract No. W-7405-Eng-82.
1G. M. Michal and R. Sinclair, Acta Crystallogr., Sect. B: Struct. Crystallogr. Cryst. Chem. 37, 1803~1981!.
2F. E. Wang, W. J. Buchler, and S. J. Pickart, J. Appl. Phys. 36, 3232~1965!.
3
F. E. Wang, B. F. DeSavage, W. J. Buchler, and W. R. Hosler, J. Appl. Phys. 39, 2166~1968!.
4S. A. Shabalovskaya, A. I. Lotkov, I. I. Sasovskaya, A. G. Nar-monev, and A. I. Zakharov, Solid State Commun. 32, 735
~1979!.
5G. V. Lashkarev, S. M. Solonin, A. V. Brodovoı˘, I. F. Martynova, M. V. Radchenko, A. L. Mirets, and N. V. Goncharuk, Fiz. Tverd. Tela~Leningrad!34, 658~1992! @Sov. Phys. Solid State
34, 352~1992!#.
6M. A. Mitchell, F. E. Wang, and J. R. Cullen, J. Appl. Phys. 45, 3337~1974!.
7R. N. Lee and R. Withers, J. Appl. Phys. 49, 5488~1978!. 8V. E. Egorushkin, Fiz. Tverd. Tela~Leningrad!24, 1276~1982!
@Sov. Phys. Solid State 24, 725~1982!#. 9
V. E. Egorushkin and S. E. Kulkova, J. Phys. F 12, 2823~1982!. 10G. L. Zhao, T. C. Leung, B. N. Harmon, M. Keil, M. Mu¨llner,
and W. Weber, Phys. Rev. B 40, 7999~1989!.
11G. L. Zhao and B. N. Harmon, Phys. Rev. B 48, 2031~1993!. 12S. A. Shabalovskaya, Phys. Status Solidi B 132, 328~1985!. 13D. A. Papaconstantopoulos, G. N. Kamm, and P. N. Poulopoulos,
Solid State Commun. 41, 93~1982!.
14M. B. Salamon, M. E. Meichle, C. M. Wayman, C. M. Whang, and S. M. Shapiro, in Meson Nuclear Physics, edited by E. V. Hungerford III, AIP Conf. Proc. No. 53, 233~AIP, New York, 1979!; M. E. Meichle, Ph.D. thesis, University of Illinois, 1981; S. K. Sajita, S. M. Shapiro, and M. B. Salamon, Bull. Am. Phys.
Soc. 26, 381~1981!; M. E. Meichle, M. B. Salamon, and C. M. Wayman, ibid. 26, 381~1981!.
15O. Mercier, K. N. Melton, G. Gremaud, and J. Ha¨gi, J. Appl. Phys. 51, 1833~1980!.
16
R. Eibler, J. Redinger, and A. Neckel, J. Phys. F 17, 1533~1987!. 17G. Bilhlmayer, R. Eibler, and A. Neckel, Ber. Bunsenges. Phys.
Chem. 96, 1626~1992!.
18V. B. Lapin, V. E. Egorushkin, S. A. Shabalovskaya, and O. P. Ivanova, Solid State Commun. 73, 471~1990!.
19S. E. Kulkova, V. E. Egorushkin, and V. V. Kalchikhin, Solid State Commun. 77, 667~1991!.
20G. Bilhlmayer, R. Eibler, and A. Neckel, J. Phys.: Condens. Mat-ter 5, 5083~1993!.
21Y. Y. Ye, C. T. Chan, and K. M. Ho, Phys. Rev. B 56, 3678
~1997!.
22X. Wang, Y. Y. Ye, C. T. Chan, K. M. Ho, and B. N. Harmon, Phys. Rev. B 58, 2964~1998!.
23I. I. Sasovskaya, S. A. Shabalovskaya, and A. I. Lotkov, Zh. E´ ksp. Teor. Fiz. 77, 2341 ~1979! @Sov. Phys. JETP 50, 1128
~1979!#.
24J. Y. Rhee, B. N. Harmon, and D. W. Lynch, Phys. Rev. B 55, 4124~1997!.
25J. Y. Rhee, Ph.D. thesis, Iowa State University, 1992.
26Y. Kudoh, M. Tokonami, S. Miyazaki, and X. Otsuka, Acta Met-all. 33, 2049~1985!.
27D. D. Koelling and B. N. Harmon, J. Phys. C 10, 3170~1977!. 28L. Hedin and B. I. Lundqvist, J. Phys. C 4, 2064~1971!. 29O. Jepsen and O. K. Andersen, Solid State Commun. 9, 1763
~1971!.
30D. E. Aspnes, E. Kinsbron, and D. D. Bacon, Phys. Rev. B 21,
3290~1980!.
31D. E. Aspnes, A. A. Studna, and E. Kinsbron, Phys. Rev. B 27, 985~1984!.
32
J. Y. Rhee~unpublished!.
33J. Y. Rhee, B. N. Harmon, and D. W. Lynch, Phys. Rev. B 54,
17 385~1996!.
34J. F. Janak, A. R. Williams, and V. L. Moruzzi, Phys. Rev. B 11, 1522~1975!.
35
D. G. Laurent, J. Callaway, and C. S. Wang, Phys. Rev. B 20, 1134~1979!.