Allocation of added selenium in lettuce and its impact on roots
10
0
0
Full text
(2) AGRICULTURAL AND FOOD SCIENCE IN FINLAND Simojoki, A. et al. Allocation of selenium in lettuce. Introduction. (Jackson 1991, Morgan and Drew 1997). However, there is little information about the effects that Se may exert on plant growth by changing root morphology, although these changes obviously affect e.g. the nutrient and water acquisition by plants. In our earlier studies, added Se induced root morphological changes that could be partly explained by assuming that Se increased endogenous ethylene production (Hartikainen et al. 2001). The aim of this study was to determine the allocation of Se in the shoots and roots of lettuce at increasing additions. A special emphasis was paid to the responses in the roots, especially the specific length and specific area of roots that affect nutrient and water acquisition by roots. Furthermore, the accumulation of Se in edible parts of plants was of interest: desirable Se contents in food and feed crops have been suggested to lie in the range 0.1–1 mg kg -1, whereas at above 5 mg Se kg-1 in the diet, there is a danger of toxicity (see Hakkarainen 1993, Mengel and Kirkby 2001). European legislation allow a maximum Se content of 0.5 mg kg -1 in all commercial feeds for domestic animals (Council directive 70/524/EEC, Commission Information 2002/C 329/EC), but no similar regulations exist for mineral elements, including Se, in food for human consumption. Lettuce was chosen for the study, because it is an important vegetable in human diet. It was grown in vermiculite, an inert growing medium, to promote effective utilization of added Se with minimal sorption and microbial uptake, and to allow easy study of roots.. Selenium (Se) is an essential microelement for animals and human, but toxic at high concentrations. Although Se is generally not considered essential for higher plants, it may benefit their physiology and growth at small concentrations (Hartikainen et al. 1997, Xue et al. 2001, Pennanen et al. 2002). Due to low bioavailability of Se in Finnish soils (Yläranta 1985), the multinutrient fertilizers for field crops have been supplemented with Na-selenate in Finland since 1984 to ensure adequate Se intake in domestic agricultural products by humans (Ekholm et al. 1995). The fertilization has to be repeated annually, as selenate is reduced to selenite, which is much more strongly bound to Al- and Fe-oxides than selenate. In greenhouse production, Se fertilization is not yet allowed. This is partly due to the toxicity risk attributable to the fertilization technique where the plants are subjected to a continuous flow of nutrient solution. The positive growth responses of plants to Se added at small concentrations have been attributed to the antioxidative effect of Se counteracting the oxidative stress (Hartikainen et al. 1997, Hartikainen and Xue 1999, Xue et al. 2001, Seppänen et al. 2003). Plants take up Se as selenate (SeO 4-2) and selenite (HSeO 3-2, SeO 3-2) ions. In the plant, selenite is generally less mobile, more easily assimilated and more toxic than selenate (Hopper and Parker 1999). Plants utilize Se effectively in their amino acid and protein synthesis (e.g. Fishbein 1991, Hartikainen et al. 1997) and replace it for S in amino acids (Läuchli 1993). The phytotoxicity of Se has been explained by the disruption of the protein metabolism due to the increased formation of selenoamino acids (Läuchli 1993, Terry and Zayed 1994) as well as the pro-oxidative effects of Se (Hartikainen and Xue 1999) at high concentrations. Selenoamino acids, in turn, enhance the production of ethylene (Konze et al. 1978), a plant hormone mediating plant responses to several stresses and affecting e.g. root morphology. Material and methods Experimental setup Lettuce was grown in a growth chamber for 7 weeks under controlled conditions (day: 16 h, photosynthetically active radiation 180 µmol. 156.
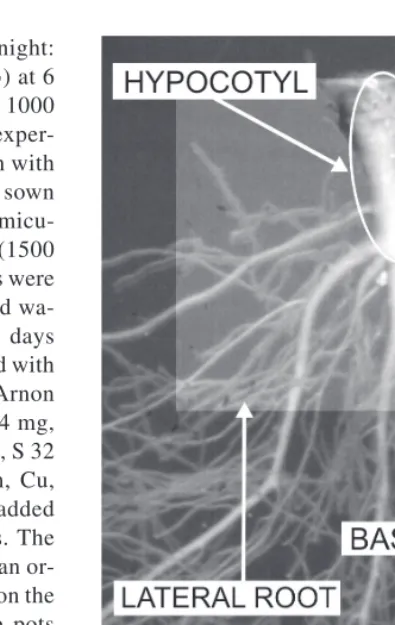
(3) AGRICULTURAL AND FOOD SCIENCE IN FINLAND Vol. 12 (2003): 155–164. m2 s-1, 20˚C, relative humidity (RH) 80%; night: 8 h, total darkness 6 h, 10–20˚C, RH 80%) at 6 Se addition levels: 0, 1, 10, 100, 500 and 1000 µg per 3.5-litre pot added as H2SeO4. The experiment had a completely randomised design with 4 replications. Fifteen lettuce seeds were sown in each plastic pot filled with 350 g of vermiculite pre-moistened with deionised water (1500 ml pot-1). After the emergence, the seedlings were thinned to four and watered with deionised water (500 ml pot-1). During a period of 10 days from the emergence, the pots were fertilized with Se and slightly modified Hoagland and Arnon solutions (1000 ml pot-1) containing N 224 mg, K 235 mg, Ca 160 mg, Mg 49 mg, P 62 mg, S 32 mg, and trace amounts of Fe, B, Mn, Zn, Cu, Mo and Ni per pot. The solutions were added carefully avoiding leaching from the pots. The amount of S in the solution was smaller than ordinary to reduce the antagonism of sulfate on the selenate uptake by plants. After this, the pots were watered from below with deionised water applied to the plates.. Plant sampling and analysis Fig. 1. Hypocotyl, basal roots and lateral roots of lettuce were separated manually and analysed by digital image analysis (Photo: Asko Simojoki).. At the harvest, one seedling in each pot was randomly selected for root morphological analysis. All roots were washed in cold water to remove the vermiculite particles and weighed fresh. Roots for the morphological analysis were stored in 18% ethanol at +5˚C before the analysis, whereas the rest, as well as the shoots, were weighed fresh, frozen in liquid nitrogen and stored at –70˚C for the later analysis of dry matter and Se content. For the analysis, the samples were dried overnight at +70˚C. Se content was determined by graphic furnace atomic absorption spectroscopy (Kumpulainen et al. 1983, Ekholm 1997). Reference samples (two in-house reference samples, one commercial certified sample NIST 1567) were included at an average frequency of 20% of all samples for data quality management. For morphological analysis, the roots were separated and classified manually according to their type into hypocotyls, basal. roots or lateral roots (Fig. 1) and analysed by digital image analysis (Simojoki 2000).. Statistical analysis The relationships between the response variables were explored by examining their linear correlations and principal components. The aim of the principal component analysis (Webster 2001) was to obtain a few variates that would capture most of the information in the numerous original response variables. Treatment means were examined by Tukey’s test.. 157.
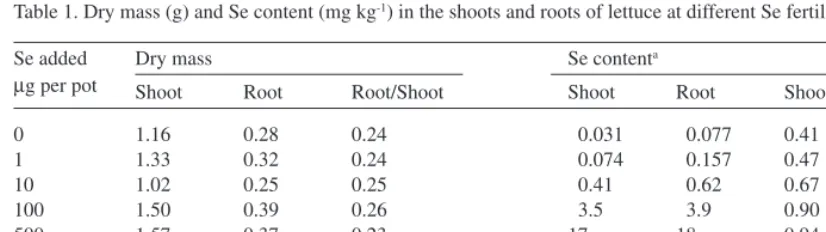
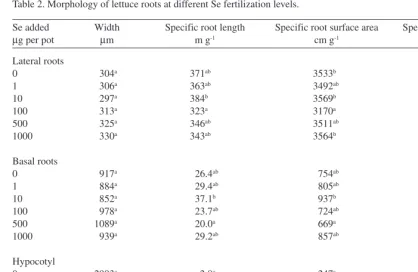
(4) AGRICULTURAL AND FOOD SCIENCE IN FINLAND Simojoki, A. et al. Allocation of selenium in lettuce Table 1. Dry mass (g) and Se content (mg kg-1) in the shoots and roots of lettuce at different Se fertilization levels. Se contenta. Dry mass. ANUEb. Se added µg per pot. Shoot. Root. Root/Shoot. Shoot. Root. Shoot/Root %. 0 1 10 100 500 1000. 1.16 1.33 1.02 1.50 1.57 0.99. 0.28 0.32 0.25 0.39 0.37 0.26. 0.24 0.24 0.25 0.26 0.23 0.25. 0.031 0.074 0.41 3.5 17 39. 0.077 0.157 0.62 3.9 18 42. 0.41 0.47 0.67 0.90 0.94 0.94. HSD. 0.73. 0.20. 0.06. 1.3. 1.5. 1.7. HSR. – 8.3 5.2 6.7 6.7 4.9. HSD honestly significant difference, HSR honestly significant ratio, P < 0.05 a Statistical tests with logarithm-transformed data b Apparent nutrient use efficiency for fertilizer Se = (Dry mass of shoots × (Se content in shoots minus that in the unfertilized treatment) + Dry mass of roots × (Se content in roots minus that in the unfertilized treatment)) / Amount of Se applied × 100. Results. The various root types differed from each other by orders of magnitude with respect to the measured morphological variables (Table 2). The average widths were 312, 940 and 3200 µm, and the specific lengths 3, 28 and 355 m g-1 in the lateral roots, basal roots and hypocotyls, respectively. Specific volume was, on average, larger in lateral roots (27 cm3 g-1) than in the basal roots and hypocotyls (18 and 20 cm3 g-1, respectively). Addition of Se had diverse effects on root morphology (Table 2). No statistically significant changes were observed in the morphology of hypocotyls. In the basal and lateral roots, on the contrary, specific length and specific area were smallest at intermediate Se additions (100 or 500 µg pot 1), whereas specific volume was largest at the largest application. In addition, the tips of lateral roots were frequently dark brown, however, roughly to the same extent in all treatments (Fig. 1). Numerous linear correlations between the response variables were relatively strong (see Table 3), which allowed capturing most of the information into a few orthogonal linear combinations of original variates by principal component analysis (Table 4). The first three principal components explained 69% of the total variation in the data. The first component correlated positively with plant growth and the width of hy-. Owing to the high variation between the replicates, the dry masses of shoots and roots and the shoot-to-root ratios were not significantly different at the various Se addition levels (Table 1). However, the intermediate additions of 100 and 500 µg Se per pot seemed to produce the highest biomasses. Dry mass allocated to the various root types was also fairly similar in all treatments (data not shown): the dry masses of lateral and basal roots were, on average, 239 ± 14 mg and 33 ± 3 mg, respectively (mean ± standard error, n = 24) with no significant differences between the treatments. However, slightly more dry mass was allocated to hypocotyls at the Se addition of 100 mg per pot (71 ± 5 mg, n = 4) than in other treatments (31 ± 3 mg, n = 20). In contrast, in the unfertilized treatment the Se content in roots was nearly 2.5-fold compared with that in shoots [mg kg-1 dry matter (DM), Table 1]. The increase in Se contents both in roots and shoots from these levels was roughly proportional to the amount of Se added. However, at small additions, Se was preferentially allocated to roots, whereas at larger additions the contents in roots and shoots did not differ from each other.. 158.
(5) AGRICULTURAL AND FOOD SCIENCE IN FINLAND Vol. 12 (2003): 155–164. Table 2. Morphology of lettuce roots at different Se fertilization levels. Se added µg per pot. Width µm. Lateral roots 0 1 10 100 500 1000. Specific root length m g-1. 304a 306a 297a 313a 325a 330a. Specific root surface area cm g-1. Specific root volume cm3 g-1. 3533b 3492ab 3569b 3170a 3511ab 3564b. 26.9ab 26.9ab 26.5ab 24.9a 28.5ab 29.5b. 371ab 363ab 384b 323a 346ab 343ab. Basal roots 0 1 10 100 500 1000. 917a 884a 852a 978a 1089a 939a. 26.4ab 29.4ab 37.1b 23.7ab 20.0a 29.2ab. 754ab 805ab 937b 724ab 669a 857ab. 17.2a 17.7ab 19.4ab 17.6ab 18.0ab 20.1b. Hypocotyl 0 1 10 100 500 1000. 2993a 3771a 2400a 3840a 3358a 2778a. 2.8a 2.2a 3.9a 1.9a 2.6a 3.8a. 247a 246a 303a 219a 232a 313a. 18.3a 22.5a 17.3a 20.6a 18.3a 21.4a. Means denoted by a different letter on the same column and root class differ significantly (P < 0.05). Table 3. Linear correlations between the growth, Se content and root morphology of lettuce. Se content in rootsa. Dry mass of shoots. Dry mass Width Specific length Specific surface area Specific volume. Lateral roots. Basal roots. Hypocotyl. Lateral roots. Basal roots. Hypocotyl. 0.90*** –0.08 –0.27 –0.49* –0.41*. 0.73*** 0.36 –0.42* –0.54** –0.52**. 0.66*** 0.70*** –0.74*** –0.79*** 0.29. 0.04 0.55** –0.27 0.18 0.53**. –0.22 0.21 –0.10 0.04 0.47*. –0.40 –0.11 0.15 0.30 0.18. n = 24; * P < 0.05, ** P < 0.01, *** P < 0.001 Average including all root types (lateral, basal, hypocotyl). a. ing of hypocotyls and by reduction of specific root surface area. The second component accounted for the increase in plant Se content accompanied by thickening and shortening of lateral and basal roots,. pocotyl, and negatively with the specific length of hypocotyl and the specific surface areas of all root classes (Table 4). Thus, it accounted for observations where the increases in plant growth were accompanied by thickening and shorten-. 159.
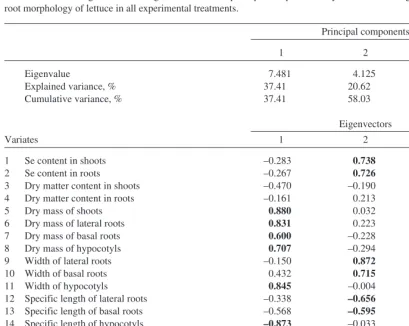
(6) AGRICULTURAL AND FOOD SCIENCE IN FINLAND Simojoki, A. et al. Allocation of selenium in lettuce Table 4. First three eigenvalues and eigenvectorsa from a principal component analysis of the data on growth, Se content and root morphology of lettuce in all experimental treatments. Principal components 1 Eigenvalue Explained variance, % Cumulative variance, %. 7.481 37.41 37.41. 2 4.125 20.62 58.03. 3 2.291 11.45 69.48. Eigenvectors Variates 1 2 3 4 5 6 7 8 9 10 11 12 13 14 15 16 17 18 19 20 a. 1. Se content in shoots Se content in roots Dry matter content in shoots Dry matter content in roots Dry mass of shoots Dry mass of lateral roots Dry mass of basal roots Dry mass of hypocotyls Width of lateral roots Width of basal roots Width of hypocotyls Specific length of lateral roots Specific length of basal roots Specific length of hypocotyls Specific surface area of lateral roots Specific surface area of basal roots Specific surface area of hypocotyls Specific volume of lateral roots Specific volume of basal roots Specific volume of hypocotyls. –0.283 –0.267 –0.470 –0.161 0.880 0.831 0.600 0.707 –0.150 0.432 0.845 –0.338 –0.568 –0.873 –0.657 –0.696 –0.879 –0.567 –0.647 0.456. 2 0.738 0.726 –0.190 0.213 0.032 0.223 –0.228 –0.294 0.872 0.715 –0.004 –0.656 –0.595 –0.033 –0.038 –0.426 0.022 0.620 0.395 0.048. 3 –0.444 –0.470 0.537 0.768 –0.015 –0.151 –0.112 0.004 0.109 0.277 –0.319 –0.227 –0.329 0.179 –0.233 –0.375 –0.001 –0.080 –0.275 –0.548. Product-moment correlations between the principal components and the original data; largest contributions are shown in bold. linearly related to the Se content in plants but showed maximum scores at the Se addition of 100 µg per pot and smallest ones at the largest addition. The second order polynomial fitted to the data (PC1 = a + bx + cx2) had a maximum near 400 µg per pot (a = –0.0488, b = 9.69 × 10⁻³, c = –0.012 × 10⁻³; x = added Se, µg per pot). However, the regression explained only 23% of the total variation in PC1 (R2 = 0.23). The scores of the second component increased roughly proportionally to the amount of Se added. Additions of Se did not change the third component significantly.. as well as by the increase in the specific volume of lateral roots (Table 4). The third component accounted for the inverse relationship between the plant dry matter content and the specific volume of hypocotyls. As the principal components are due to their orthogonality independent of each other, the examination of their mean scores could be used to sum up the essential responses of lettuce to the experimental treatments (Table 5). Only small part of the total variation was related to the Se treatments. The first principal component (PC1) that explained 37% of the total variation was not. 160.
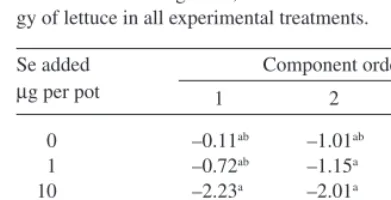
(7) AGRICULTURAL AND FOOD SCIENCE IN FINLAND Vol. 12 (2003): 155–164. Table 5. Mean scores from the first three principal components of the data on growth, Se content and root morphology of lettuce in all experimental treatments. Se added µg per pot 0 1 10 100 500 1000. growth is increased by small Se additions and decreased by large additions (Fig. 2). At low contents of 1–5 mg kg-1 DM, Se tended to enhance plant growth. When the Se content exceeded that range, the shoot yields started to diminish, the drop being drastic above 20 mg kg-1 DM. Moreover, by adopting a broader view on the growth process that takes into account the correlation of plant growth with certain root morphological features (first principal component), an optimum for plant growth could be established at intermediate Se additions also in this study (Tables 4 and 5). The results of this experiment were obviously partly confounded by some extraneous variables that increased the error variance so that even some large effects were statistically insignificant. Uneven distribution of moisture within the pots is the most likely reason for large error variation in this study. Watering the pots from below was probably not successful due to the poor water conductivity of unsaturated vermiculite, although no attempt was made to confirm this suggestion by measurement. Low illumination in the phytotron partly explains, why the yields were much smaller than in some earlier studies (Hartikainen et al. 1997, Pennanen et al. 2002). These factors are also probable major reasons for the very low apparent nutrient use efficiencies (5–. Component order 1. 2. 3. –0.11ab –0.72ab –2.23a 2.89b 1.09ab –2.37a. –1.01ab –1.15a –2.01a –0.19ac 1.90bc 2.46c. 1.09a –0.11a –0.21a 0.33a 0.61a –1.71a. Means denoted by a different letter on the same column differ significantly (P < 0.05). Discussion In contrast to our earlier experiments (Hartikainen et al. 1997, Hartikainen and Xue 1999, Hartikainen et al. 2001, Xue et al. 2001, Pennanen et al. 2002), practically no significant effects of Se addition on the dry matter production of lettuce could be proved in this experiment owing to large scatter in the data (Table 1). However, the relative shoot yields and Se contents in this experiment conformed rather well to the general pattern from the earlier experiments that plant. 200. Relative shoot yield (100 = no added Se) 1. 150. 100 Fig. 2. Relative yield as related to the Se content in lettuce shoots. The numbers below the points stand for the experimental data: 1 = Hartikainen et al. 1997, 2 = Hartikainen and Xue 1999, 3 = Xue et al. 2001, 4 = Pennanen et al. 2002, 5 = Simojoki et al. 2003 (this study).. 1. 5 4 1 5 2 43. 4 4. 3. 3. 5. 41 5 4 3 4. 5 2 4. 4. 50. 5 3. 4. 0. 0.01. 0.1. 1.0. 5. 20. 3. 100. 2. -1. Se content (mg kg DM). 161. 1000.
(8) AGRICULTURAL AND FOOD SCIENCE IN FINLAND Simojoki, A. et al. Allocation of selenium in lettuce 9%) for fertilizer Se by plants compared with our earlier experiments on soils (Hartikainen et al. 1997, Hartikainen and Xue 1999, Xue et al. 2001, Pennanen et al. 2002). The frequently observed dark brown root tips may be attributable to unfavourable microsites in the growth medium, although the exact reason for their occurrence remains unknown. Leaching of Se out of the pots can be excluded as a cause for large variation in plant growth, because leaching was avoided during the fertilization, and as the pots were later on watered from below. Furthermore, the plant Se contents in all treatments differed significantly from each other and roughly proportionally to the Se addition (Table 1). This confirms that the Se treatments were established succesfully. As for the allocation of Se into various parts of lettuce, the results show that in a growth medium rather inactive in retaining selenate, the Se content in lettuce increases effectively with increasing Se dosages (Table 1). Nevertheless, the effects in roots and shoots can be different. At small Se additions, roots contained relatively more Se than shoots (as mg kg-1 DM), whereas at larger additions, the Se contents were similar. Selenate as such is easily translocated from roots to shoots (Hopper and Parker 1999), while selenite remains in roots and is accumulated in organic Se (Asher et al. 1977, Zayed et al. 1998). The results thus suggest that the roots are relatively more efficient in metabolising selenate when added in small amount. At higher addition levels more selenate is translocated from roots to shoots, which smoothens the difference in their Se contents. As the dry mass of shoots is usually much larger than that of roots, most of the Se taken up by the plant is, however, allocated to shoots (63–80% in this study). The mean Se content of fresh lettuce in Finland is low, only 2 µg Se kg-1 (National Public Health Institute 2001), which is close to the Se content in the shoots of the unfertilized treatment in this study. Taking into account that about 95% of lettuce is water, our results suggest that Se fertilization up to at least 100 µg per pot (29 µg dm-3 soil) should not increase the Se con-. tents beyond desirable range. The contents in plants growing in soil, peat and other non-inert media at a given fertilization are likely to be smaller than those in this study due to the sorption and microbial uptake of Se as well as the sulfate antagonism on selenate uptake by plants. Moreover, in better growing conditions, the increase in apparent Se use efficiency is likely to be larger than the relative enhancement in plant growth (Hartikainen et al. 1997, Xue et al. 2001, Pennanen et al. 2002), so that a given Se fertilization will produce smaller contents in plants. The results of image analysis and statistical principal component analysis revealed that root morphology was related to both plant growth and Se content (Tables 3 and 4). Furthermore, the results confirmed that Se fertilization changes root morphology by exerting diverse effects on different parts of the root system (Tables 2 and 5). The morphology of hypocotyl seems not to be affected by Se addition. In contrast, moderate Se additions decrease the specific length and specific surface area in basal and lateral roots, and large Se additions increase the specific volume of roots. This implies that moderate Se additions decrease the efficiency of photosynthate use for constructing root surface area, and larger Se additions increase the root porosity. These responses may have been caused by ethylene, as its production is known to be enhanced by selenoamino acids (Konze et al. 1978) and as plants commonly react this way to stresses mediated by ethylene (Jackson 1991, Morgan and Drew 1997). Positive correlation between root Se content and the thickness and specific volume of lateral roots gives further indirect support to our hypothesis (Hartikainen et al. 2001) that added Se induces endogenic ethylene production in roots. The hypothesis thus deserves further study with direct measurements of ethylene production. On the other hand, better plant growth was found to be associated with more inefficient use of photosynthates for constructing root surface area (Tables 3 and 4). Thus, in this experiment the effects of Se fertilization on root morphology were not unambiguously related to plant. 162.
(9) AGRICULTURAL AND FOOD SCIENCE IN FINLAND Vol. 12 (2003): 155–164. and by Mr. Teemu Halme for the morphological analysis of roots. This study was financed by the Research Funds of the University of Helsinki.. growth. Moreover, Se use efficiency was apparently not related to root morphology. Overall, the results on root morphology thus suggest that the commonly observed plant growth enhancement by small Se additions are not likely due to more efficiently functioning roots, but more probably due to the positive effects of added Se on shoots such as enhanced production and accumulation of carbohydrates (Arvy et al. 1995, Mazzafera 1998, Pennanen et al. 2002).. References Arvy, M.P., Thiersault, M. & Doireau, P. 1995. Relationship between selenium, micronutrients, carbohydrates, and alkaloid accumulation in Catharanthus roseus cells. Journal of Plant Nutrition 18: 1535– 1546. Asher, C.J., Butler, G.W. & Peterson, P.J. 1977. Selenium transport in root systems of tomato. Journal of Experimental Botany 28: 279–291. Commission Information 2002/C 329/EC. List of the authorised additives in feedingstuffs published in application of Article 9t (b) of Council Directive 70/ 524/EEC concerning additives in feedingstuffs. Official Journal of the European Communities C 329/ 1–142. Council directive 70/524/EEC. Council directive of 23 November 1970 concerning additives in feedingstuffs. CONSLEG: 1970L0524-31/3/2003. Office for Official Publication of the European Communities. 38 p. Ekholm, P. 1997. Effects of selenium supplemented commercial fertilizers on food selenium contents and selenium intake in Finland. EKT-Series No. 1047. Helsinki. 82 p. (Academic dissertation, University of Helsinki). Ekholm, P., Ylinen, M., Koivistoinen, P. & Varo, P. 1995. Selenium concentration of Finnish foods: Effects of reducing the amount of selenate in fertilizers. Agricultural and Food Science in Finland 4: 377–384. Fishbein, L. 1991. Selenium. In: Merian, E. (ed.). Metals and their compounds in the environment, occurrence, analysis and biological relevance. Weinheim VCH. p. 1153–1190. Hakkarainen, J. 1993. Bioavailability of selenium. Norwegian Journal of Agricultural Sciences, Supplement 11: 21–35. Hartikainen, H., Ekholm, P., Piironen, V., Xue, T., Koivu, T. & Yli-Halla, M. 1997. Quality of the ryegrass and lettuce yields as affected by selenium fertilization. Agricultural and Food Science in Finland 6: 381–387. Hartikainen, H., Pietola, L. & Simojoki, A. 2001. Quantification of fine root responses to selenium toxicity. Agricultural and Food Science in Finland 10: 53–58. Hartikainen, H. & Xue, T. 1999. The promotive effect of selenium on plant growth as triggered by ultraviolet irradiation. Journal of Environmental Quality 28: 1372–1375. Hopper, J.L. & Parker, D.R. 1999. Plant availability of selenite and selenate as influenced by the competing ions phosphate and sulfate. Plant and Soil 210: 1999–207. Jackson, M.B. 1991. Ethylene in root growth and development. In: Mattoo, A.K. & Suttle, J.C. (eds.). The plant. Conclusions Small Se additions that increase Se contents in lettuce shoots up to 1–5 mg kg-1 DM tend to enhance plant growth. The yields drop drastically at Se contents above 20 mg kg-1 DM. Selenium contents in the shoots and roots of lettuce increase roughly proportionally to the amount of Se added. At small Se fertilization given to lettuce, the roots contain relatively more Se compared with the shoots, whereas at larger amounts the contents are similar. Selenium fertilization changes root morphology, and the effects are diverse in different parts of the root system. The morphology of hypocotyl is not affected. Moderate Se additions decrease the specific length and specific surface area of basal and lateral roots, whereas large additions increase the specific volume of roots. Root morphology of lettuce depends both on plant growth and Se content. In this study, better plant growth was associated with thicker and shorter hypocotyls as well as more inefficient use of photosynthates for constructing root surface area. The effects of Se fertilization on root morphology were not unambiguously related to plant growth. The positive correlation between the thickness and specific root volume of lateral roots gives support to the hypothesis that added Se induces endogenic ethylene production. Acknowledgements. We gratefully acknowledge the technical assistance by Ms. Maija Ylinen for the Se analyses,. 163.
(10) AGRICULTURAL AND FOOD SCIENCE IN FINLAND Simojoki, A. et al. Allocation of selenium in lettuce hormone ethylene. Boca Raton, FL: CRC Press. p. 159–181. Konze, J.R., Schilling, N. & Kende, H. 1978. Enhancement of ethylene formation by selenoamino acids. Plant Physiology 62: 397–401. Kumpulainen, J., Raittila, A.M., Lehto, J. & Koivistoinen, P. 1983. Electrochemical atomic absorption spectrometric determination of selenium in foods and diets. Journal of the Association of Official Analytical Chemists 66: 1129–1135. Läuchli, A. 1993. Selenium in plants: uptake, functions, and environmental toxicity. Botanica Acta 106: 455– 468. Mazzafera, P. 1998. Growth and biochemical alterations in coffee due to selenite toxicity. Plant and Soil 201: 189–196. Mengel, K. & Kirkby, E.A. 2001. Principles of plant nutrition. 5th ed. Dortrecht: Kluwer Academic Publishers. 849 p. Morgan, P.W. & Drew, M.C. 1997. Ethylene and plant responses to stress. Physiologia Plantarum 100: 620– 630. National Public Health Institute 2001. Fineli. Food composition database. Helsinki: National Public Health Institute, Nutrition unit. Available on the Internet: http:/ /www.ktl.fi/fineli/.. Pennanen, A., Xue, T. & Hartikainen, H. 2002. Protective role of selenium in plant subjected to severe UV irradation stress. Journal of Applied Botany 76: 66–76. Seppänen, M., Turakainen, M. & Hartikainen, H. 2003. Selenium effects on oxidative stress in potato. Plant Science 165: 311–319. Simojoki, A. 2000. Calibration of a desktop scanner and digital image analysis procedure for quantification of root morphology. Agricultural and Food Science in Finland 9: 223–230. Terry, N. & Zayed, A. 1994. Phytoremediation of selenium. In: Frankenberger, W.T., Jr. & Benson, S. (eds.). Selenium in the environment. New York: Marcel Dekker. p. 343–367. Webster, R. 2001. Statistics to support soil research and their presentation. European Journal of Soil Science 52: 331–340. Xue, T., Hartikainen, H. & Piironen, V. 2001. Antioxidative and growth-promoting effect of selenium on senescing lettuce. Plant and Soil 237: 55–61. Yläranta, T. 1985. Increasing the selenium content of cereal and grass crops in Finland. 72 p. (Academic dissertation, University of Helsinki). Zayed, A., Lytle, M.C. & Terry, N. 1998. Accumulation and volatilization of different chemical species of selenium by plants. Planta 206: 284–292.. SELOSTUS Seleenin jakautuminen salaatin versoihin ja vaikutus juuriin Asko Simojoki, Tailin Xue, Kaarina Lukkari, Arja Pennanen ja Helinä Hartikainen Helsingin yliopisto, Kiinan tiedeakatemia ja Merentutkimuslaitos. jen seleenipitoisuudet nousivat seleenimäärää lisätessä lähes verrannollisesti lisättyyn määrään. Pienillä lisäyksillä seleenipitoisuudet olivat suurempia juurissa kuin versoissa, kun taas suurilla määrillä juurten ja versojen seleenipitoisuuksissa ei ollut eroa. Seleenikäsittelyt eivät muuttaneet juurenniskan morfologiaa. Sitä vastoin basaali- ja lateraalijuurten pienimmät ominaispituudet ja ominaispinta-alat saatiin keskisuurilla seleenilisäyksillä (100 tai 500 µg Se per astia), ja suurin ominaistilavuus suurimmalla seleenilisäyksellä. Seleenin vaikutuksia juurten morfologiaan ei kuitenkaan voitu kytkeä yksiselitteisesti kasvin kasvuun. Lateraalijuurten paksuus ja ominaistilavuus kasvavat juuren seleenipitoisuuden noustessa, mikä tukee hypoteesia, että seleenilisä indusoi endogeenista etyleenin tuotantoa.. Seleeni on eläimille ja ihmisille välttämätön alkuaine, jota lisätään Suomessa moniravinteisiin lannoitteisiin. Lisäyksen tarkoituksena on parantaa peltokasvien seleenin ottoa ja taata ihmisille riittävä seleenin saanti ruoasta. Kasvihuoneviljelyssä seleenilannoitus ei kuitenkaan ole vielä sallittua, osittain koska kasvien seleenin otto ja jakautuminen kasvissa sekä siihen liittyvä myrkytysvaara tunnetaan puutteellisesti. Seleenin jakautumista versoihin ja juuriin sekä vaikutusta juurten morfologiaan tutkittiin kokeessa, jossa salaattia kasvatettiin vermikuliitissa kontrolloiduissa oloissa seitsemän viikon ajan nousevilla selenaattilisäyksillä (0, 1, 10, 100, 500 ja 1000 µg Se 3,5 litran astiassa). Suurin biomassa saatiin keskisuurilla lisäyksillä (100 tai 500 µg seleeniä astiaa kohti), joskin aineistossa oli paljon satunnaisvaihtelua. Juurten ja verso-. 164.
(11)
Figure
+2
Related documents
Sending the packets in bulk:In this mode of packet generation the packets sent to the firewall junction are generated randomly in large numbers,this is a measure
AUC: Area under the concentration time curve; Cl: Clearance; Cr: Creatinine; ICU: Intensive Care Unit; HPLC: High performance liquid chromatography; MIC: Minimum
Bureau of Labor Statistics, in cooperation with state and federal agencies, Census of Fatal Occupational Injuries, July 1998. a Includes paid and unpaid family workers and may
The study revealed that when it comes to TV commercial, emotions like pleasure and arousal influence consumers' attitudes towards brand and advertising.. Attitude
The differences in velocity between difficult and average races, and between fast and average races, calculated in these models were used to adjust reported race times for difficult
5 Medical facilities complete comprehensive training preparing personnel for mass casualty incidents (plan, exercise, and conduct post incident review on annual basis)..
First and most importantly, while in the previous countersignaling models (for example, Feltovich et al. 2002, Harbaugh and To 2008), the player is assumed to always receive the
