METHOD DEVELOPMENT AND VALIDATION OF SIMULTANEOUS ESTIMATION OF OLMESARTAN MEDOXIMIL AND CILNIDIPINE BY RP-HPLC IN
PHARMACEUTICAL DOSAGE FORM
DISSERTATION Submitted to
THE TAMIL NADU DR.M.G.R.MEDICAL UNIVERSITY,
CHENNAI.
In partial fulfillment for the award of the degree of
MASTER OF PHARMACY In
(Pharmaceutical Analysis)
By 261230011
Under the Guidance of
Dr. SHANTHA ARCOT, M.Sc. (Pharm)., Ph.D.,
HOD, Department of Pharmaceutical Analysis
DEPARTMENT OF PHARMACEUTICAL ANALYSIS
C.L.BAID METHA COLLEGE OF PHARMACY
CHENNAI – 600 097
SRI. VINOD KHANNA SRI. L. UDAY METHA
Chairman Secretary & Correspondent
Dr. SHANTHA ARCOT,M.Sc.(Pharm).,Ph.D., Dr. GRACE RATHNAM,M.Pharm.,Ph.D.,
HOD,Department of Pharmaceutical Analysis Principal
CERTIFICATE
This is to certify that the project entitled “METHOD DEVELOPMENT AND VALIDATION OF SIMULTANEOUS ESTIMATION OF OLMESARTAN MEDOXIMIL AND CILNIDIPINE BY RP-HPLC IN PHARMACEUTICAL DOSAGE FORM” submitted by 261230011in partial fulfillment for the award of degree of Master of Pharmacy. It was carried out at Indian Institute Of Chemical Technology, Hyderabad and at C.L.Baid Metha college of Pharmacy, Chennai-96 under the guidance of Dr. Shantha Arcot, M.Sc. (Pharm).,Ph.D., HOD, Department of Pharmaceutical Analysis during the
year 2013-2014.
SRI. VINOD KHANNA SRI. L. UDAY METHA
Chairman Secretary & Correspondent
Dr. SHANTHA ARCOT,M.Sc.(Pharm).,Ph.D., Dr. GRACE RATHNAM,M.Pharm.,Ph.D.,
HOD,Department of Pharmaceutical Analysis Principal
CERTIFICATE
This is to certify that the project entitled “METHOD DEVELOPMENT AND VALIDATION OF SIMULTANEOUS ESTIMATION OF OLMESARTAN MEDOXIMIL AND CILNIDIPINE BY RP-HPLC IN PHARMACEUTICAL DOSAGE FORM” submitted by 261230011in partial fulfillment for the award of degree of Master of Pharmacy. It was carried out at Indian Institute Of Chemical Technology, Hyderabad and at C.L.Baid Metha college of Pharmacy, Chennai-96 under the guidance of Dr. Shantha Arcot, M.Sc. (Pharm).,Ph.D., HOD, Department of Pharmaceutical Analysis during the
year 2013-2014.
Date: Mrs. Dr. GRACE RATHNAM,M.Pharm,Ph.D.,
Principal Department of Pharmaceutics, C .L.Baid Metha College of Pharmacy,
DECLARATION
The thesis entitled “METHOD DEVELOPMENT AND VALIDATION OF SIMULTANEOUS ESTIMATION OF OLMESARTAN MEDOXIMIL AND CILNIDIPINE BY RP-HPLC IN PHARMACEUTICAL DOSAGE FORM” was carried out by me in Department of Pharmaceutical Analysis, C.L.Baid Metha College of Pharmacy, Chennai – 97 during the academic year 2013-2014. The work embodied in this thesis is original, and is not submitted in part or full for any other degree of this or any other University.
Date: [Reg.No: 261230011]
ACKNOWLEDGEMENTS
I would like to express my appreciation and sincere thanks for the efforts of everyone who have directly or indirectly contributed their ideas and energy in the successful completion of my project.
It gives me an immense pleasure and pride to express my deep sense of gratitude and respect for my teacher and guide Dr. SHANTHA ARCOT, M.Sc. (Pharm)., Ph.D., HOD, Department of Pharmaceutical Analysis, C.L.Baid Metha College of Pharmacy, Chennai – 97, for her evergreen expertise and inspiring guidance for the timely completion of this work.
I would like to express my sincere thanks with deep sense of gratitude, to my respected guide, Dr. K. Suresh Babu, Scientist, NPL, Organic Division-I, Indian institute of Chemical Technology, Hyderabad for his immense guidance, help, undeterred support, dedication, intellectual supervision, professional expertise, freedom of thought, speech and trust he has bestowed upon me throughout the period of my work.
It’s my privilege to express my grateful and sincere gratitude to Dr. GRACE RATHNAM, M.Pharm., Ph.D, Principal, and HOD of pharmaceutics, C.L.Baid Metha College of Pharmacy. I acknowledge my sincere thanks to Mrs. VIJAYA NAGARAJAN, M.Pharm., (Ph.D)., Assistant professor, Mrs. VIJAYA GEETHA, M.Pharm., (Ph.D)., Assistant professor, Mrs. G. UMA, M.Pharm., (Ph.D)., Assistant professor, Mrs. S. YAMUNA M.Pharm., (Ph.D.,)Lecture Department of pharmaceutical Analysis, for their valuable suggestions throughout my thesis work.
I thank Dr.M LAKSHMI KANTHAM Director, IICT, Hyderabad and Dr. S. Chandrashekhar, Head of Department, Organic Division I, IICT for giving me opportunity to do project in IICT.
I would like to thank Dr. V U M SHARMA, IICT, Hyderabad for providing the facilities for performing method development and validation of my work and for constant support and Mrs.B Manjula for helping me in the process.
I would like to show my greatest appreciation to my seniors, Ch.Pavan ,B.Poornima,and B.Siva for their tremendous guidance, support and suggestions during my project and I take this opportunity to thank all my senior colleagues V Rajesh,K Hari Babu, Ramesh, K kumar, Ashok, A.Venkanna and my labmate Saheethi for their unreserved help and encouragement during my project.
I specially thank Ms.G.Surya, M.Sc, Incharge of Ceeal lab for her guidance and source of inspiration that I have received from her throughout my project work.
I extend my sincere thanks to Chief Librarian M. Rajalakshmi, C.L.Baid Metha College of
Pharmacy in helping me to utilize the library facilities for references.
I cannot ignore the support and help which I received from my friend and M. Pharmacy classmates SONJA JOSE AND FRANCIS XAVIER during the course of my training period
My gratitude, affection and lots of love saying special thanks to my Parents Mr.N V R Prasad and Mrs. N Sarada who mean the world to me and to whom I owe everything for what I’m today, having unwavering confidence in me and showing me a way to my will. Thanks for being a friend, guide, my positive energy, driving force, spirit and ever ending support and encouragement in every path of my life and thus completing me.
I might have missed a few names and I am sorry for that, but they are always in my memories.
Place: CHENNAI
Date: NIHARIKA NANDI
CONTENT
S.NO CONTENTS
Page No
1
INTRODUCTION1
2
DRUG PROFILE44
3
LITERATURE REVIEW47
4
AIM AND PLAN OF WORK52
5
MATERIALS AND METHOD53
6
METHOD DEVELOPMENT ANDOPTIMISATION
56
7 VALIDATION PARAMETER PROCEDURES 59
8 ESTIMATION AND VALIDATION OF
OLMESARTAN MEDOXIMIL AND CILNIDIPINE BY RP-HPLC
59
9 RESULTS AND DISCUSSION 77
10 SUMMARY AND CONCULSION 79
LIST OF TABLES
TABLE CONTENTS PAGE NO
1 Goals in method development 26
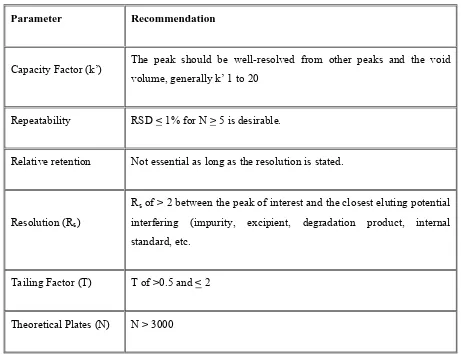
2 System suitability parameters and recommendations
32
3 Statistical analysis 38
4 Instruments used 54
5 Chromatographic conditions 54
6 System suitability for Olmesartan
medoximil 62
7 System suitability for cilnidipine
62
8 Specificity 64
9 Linearity of olmesartan 66
10 Linearity of cilnidipine 67
11 Accuracy 69
12 Immediate precision 72
13,14 Intermediate precision 74
15,16 Robustness 76,77
CHROMATOGRAMS LIST
TABLE CONTENTS PAGE NO
1 Standard chromatogram 1 58
2 Standard chromatogram 2 58
3 System suitability parameters 61
4 Specificity 64
5 linearity of cilnidipine and olmesartan 67
6 Accuracy-80% 70
7 Accuracy-100% 70
8 Accuracy-160% 70
9 Immediate precision 72
10,11 Intermediate precision 73
12,13 Robustness for Olmesartan medoximil
ABBREVIATIONS
Conc. Concentration
0C Degree centigrade
gm Grams
RP-HPLC Reverse Phase High Performance Liquid Chromatography ICH International Conference on Harmonization
λ Lambda
LOD Limit of Detection
LOQ Limit of Quantification
mg Milligrams
Min Minutes
ml Milliliter
mM Millimolar
mm Millimeter
Mol.Wt. Molecular weight
μg micro gram
μl micro liter
µm micro meter
nm Nanometer
NLT Not Less Than
NMT Not More Than
PDA Photo Diode Array
IP Indian Pharmacopoeia
BP British Pharmacopoeia
EP European Pharmacopoeia
pH Negative Logarithm Of Hydrogen ion pKa Dissociation Constant
% Percentage
RI Refractive Index
LC-MS Liquid Chromatography-Mass Chromatography RSD Relative Standard Deviation
Rt Retention Time
SD Standard Deviation
Std Standard
μg Micro gram
UV Ultra-violet
Vs Versus
1. INTRODUCTION
PHARMACEUTICAL ANALYSIS1
Pharmaceutical analysis1 plays a vital role in the pharmaceutical product development. Pharmaceutical analysis is a specialized branch of analytical chemistry. Analytical chemistry involves separating, identifying, and determining the relative amounts of components in a sample matrix.
Pharmaceutical analysis derives its principles from various branches of sciences like physics, microbiology, nuclear science, and electronics etc. Qualitative analysis reveals the chemical identity of the sample. Quantitative analysis establishes the relative amount of one or more of these species or analytes in numerical terms. Qualitative analysis is required before a quantitative analysis can be undertaken.
A separation step is usually a necessary part of both a qualitative and quantitative analysis. The results of typical quantitative analysis can be computed from two measurements. One is the mass or volume of sample to be analyzed and second is the measurement of some quantity that is proportional to the amount of analyte in that sample and normally completes the analysis.
Instruments play a key role in the quantitative analysis of pharmaceutical chemistry.
INSTRUMENTAL METHODS OF ANALYSIS
Instrumental methods are exciting and fascinating part of chemical analysis that interacts with all areas of chemistry and with many other areas of pure and applied sciences. Analytical instrumentation plays an important role in the production and evaluation of new products and in the protection of consumers and environment.
This instrumentation provides lower detection limits required to assure safe foods, drugs, water and air. Instrumental methods are widely used by Analytical chemists to save time, to avoid chemical separation and to obtain increased accuracy. Most instrumental techniques fit into one of the four-principle areas mentioned below.
a) Spectrophotometric techniques
UV and Visible Spectrophotometry
Atomic Spectrophotometry (Emission &Absorption)
Infrared Spectrophotometry
Raman Spectrophotometry
X-Ray Spectrophotometry
Nuclear Magnetic Resonance Spectroscopy
Mass Spectroscopy
Electron spin Resonance Spectroscopy
b) Electrochemical Techniques
Potentiometry
Voltametry
Electrogravimetry
Conductometry
Amperometry
c) Chromatographic Techniques
High Performance Liquid Chromatography
Gas chromatography
High Performance Thin Layer Chromatography
Thin Layer Chromatography
GC- MS (Gas chromatography - Mass Spectroscopy
LC-MS (Liquid Chromatography - Mass Spectroscopy
d) Miscellaneous techniques
Thermal analysis
Kinetic techniques
1.1 HIGH PERFORMANCE LIQUID CHROMATOGRAPHY2
High performance liquid chromatography2 is basically a highly improved form of column chromatography. Instead of a solvent being allowed to drip through a column under gravity, it is forced through under high pressures of up to 400 atmospheres, that makes it much faster. It also allows using a very much smaller particle size for the column packing material which gives a much greater surface area for interactions between the stationary phase and the molecules flowing past it. This allows a much better separation of the components of the mixture. The other major improvement over column chromatography concerns the detection methods which can be used. These methods are highly automated and extremely sensitive.
HPLC employs a liquid mobile phase and a very finely divided stationary phase. In order to obtain satisfactory flow rate, liquid must be pressurized to a few thousands of pounds per square inch. The rate of distribution of drugs between stationary and mobile phase is controlled by diffusion process. If diffusion is minimized, a faster and effective separation can be achieved. The technique of high performance liquid chromatography is so called because of its improved performance when compared to classical column chromatography. Advances in column technology, high-pressure pumping system and sensitive detectors have transformed liquid column chromatography into high speed, efficient, accurate and highly resolved method of separation.
The HPLC is the method of choice in the field of analytical chemistry, since this method is specific, robust, linear, precise and accurate and the limit of detection is low and also it offers the following advantages.
Speed (many analysis can be accomplished in 20 min or less) Greater sensitivity (various detectors can be employed) Improved resolution (wide variety of stationary phases)
Reusable columns (expensive columns but can be used for many analysis) Ideal for the substances of low viscosity
Easy sample recovery, handling and maintenance.
Instrumentation leads itself to automation and quantification (less time and less labor) Precise and reproducible
SEPARATION PRINCIPLES OF HPLC
Adsorption chromatography employs high-surface area particles that adsorb the solute molecules. Usually a polar solid such as a silica gel, alumina or porous glass beads and a non-polar mobile phase such as heptane, octane or chloroform are used in adsorption chromatography.
In adsorption chromatography, adsorption process is described by competition model and solvent interaction model. Competition model assumes that entire surface of the stationary phase is covered by mobile phase molecules as result of competition for adsorption site. In solvent interaction model the retention results from the interaction of solute molecule with the second layer of adsorbed mobile phase molecules. The differences in affinity of solutes for the surface of the stationary phase account for the separation achieved.
In partition chromatography, the solid support is coated with a liquid stationary phase. The relative distribution of solutes between the two liquid phases determines the separation. The stationary phase can either be polar or non polar. If the stationary phase is polar and the mobile phase is non polar, it is called normal phase partition chromatography. If the opposite case holds, it is called reverse-phase partition chromatography. In normal phase mode, the polar molecule partition preferentially in to the stationary phase and are retained longer than non-polar compounds. In reverse phase partition chromatography, the opposite behaviour is observed.
TYPES OF HPLC TECHNIQUES
Based on modes of chromatography:
Normal phase chromatography
Reverse phase chromatography
Based on principle of separation:
Adsorption chromatography
Ion exchange chromatography
Size exclusion chromatography
Chiral phase chromatography
Base on elution technique:
Isocratic separation
Gradient separation
Based on the scale of operation:
Analytical HPLC
Preparative HPLC
REVERSED PHASE CHROMATOGRAPHY3
In 1960s, chromatographers started modifying the polar nature of the silanol group by chemically reacting silicon with organic silanes. The object was to make silica less polar or non-polar so that polar solvents can be used to separate water-soluble polar compounds. Since the ionic nature of the chemically modified silica in now reversed i.e., it is non-polar or the nature of the phase is reverted, the chromatographic separation carried out with such silica is referred to as reverse-phase chromatography.
Reverse phase liquid chromatography (RPLC) is considered as the method of choice for the analysis of pharmaceutical compounds for several reasons, such as its compatibility with aqueous and organic solutions as well as with different detection systems and its high consistency and repeatability. Sensitive and accurate RPLC analysis, whether in the pharmaceutical or bioanalytical field, necessitates the use of stationary phases which give symmetrical and efficient peaks.
The stationary phase in the Reverse Phase chromatographic columns is a hydrophobic support that is consisted mainly of porous particles of silica gel in various shapes (spherical or irregular) at various diameters (1.8, 3, 5, 7, 10 µm etc.) at various pore sizes (such as 60, 100, 120, 300).
The surface of these particles is covered with various chemical entities, such as various hydrocarbons (C1, C6, C4, C8, C18, etc). In most methods C18 columns are used currently to separate medicinal materials, which sometimes are called ODS (octedecylsilane) or RP-18. A polar solvent is used as mobile phase.
The parameters that govern the retention in Reversed Phase systems are the following:
A. The chemical nature of the stationary phase surface.
B. The type of solvents that compose the mobile phase
C. pH and ionic strength of the mobile phase
A. The chemical nature of the stationary phase
The chemical nature is determined by the size and chemistry of hydrocarbon bonded on the silica gel surface, its bonding density (units of µmole/m2), and the purity and quality of the silica gel support. As a rule, the more carbons in a bonded hydrocarbon the more it retains organic solutes (as long as similar % coverage is compared). The higher the bonding density the longer the organic solutes are retained. A column is considered relatively hydrophobic if its bonding density exceeds 3 µmole/m2.
Very important modifiers of the stationary phase's surface are surface-active substances used as mobile phase's additives, acting as ion-pair reagents. These are substances such as tri-ethylamine or tetrabutylamine or hexyl, heptyl, octyl sulfonate. They are distributed between the mobile phase and the hydrophobic surface and cover it with either positive (alkylamines) or negative (alkyl sulfonates) charges. This change of the surface into charged surface affects the retention significantly, especially on charged species in the sample.
B. Composition of the mobile phase
or less their dielectric properties, or polarity. The less polar the solvent added to the mobile phase, the stronger it gets, shortening the retention times.
C. PH and ionic strength of the mobile phase
When the samples contain solutes of ionizable functional groups, such as amines, carboxyls, phosphates, phosphonates, sulfates and sulfonates, it is possible to control their ionization degree with the help of buffers in the mobile phase. As a rule, the change of an ionizable molecule to an ion makes it more polar and less available to the stationary phase.
NORMAL PHASE CHROMATOGRAPHY
In normal phase chromatography, the stationary phase is polar adsorbent. The mobile phase is generally a mixture of non-aqueous solvents. The silica structure is saturated with silanol group at the end in normal phase separations. These OH groups are statistically distributed over the whole of the surface. The silanol groups represent the active sites (very polar) in the stationary phase.
This forms a weak bond with many molecules in the vicinity when any of the following interactions are present. Dipole-induced dipole, dipole-dipole, hydrogen bonding, -complex bonding. These situations arise when the molecule has one or several atoms with lone pair electrons or a double bond. The adsorption strengths and hence ‘K’ value (elution series) increase in the following order. Saturated hydrocarbon < olefins < aromatic < organic < halogen compounds < sulphides < ethers < esters < aldehydes and ketones < amines < sulphones < amides < carboxylic acids. The strength of interactions depends not only on the functional groups in the sample molecule but also on stearic factors. If a molecule has several functional groups, then the most polar one determines the reaction properties.
Chemically modified silica, such as aminopropyl, cyanopropyl and diol phases are the stationary phases alternative to silica gel in normal phase chromatography.
ADSORPTION CHROMATOGRAPHY
The stationary phase is an adsorbent (like silica gel or any other silica based packing) and the separation is based on repeated adsorption-desorption steps.
ION EXCHANGE CHROMATOGRAPHY
Separation is based on the charge-bearing functional groups, anion exchange for sample negative ion, or cation exchange - for sample positive ion. Gradient elution by pH is common.
AFFINITY CHROMATOGRAPHY
Separation is based on a chemical interaction specific to the target species. The more popular reverse phase mode uses a buffer and an added counter-ion of opposite charge to the sample with separation being influenced by pH, ionic strength, temperature, concentration of and type of organic co-solvent(s). Affinity chromatography, common for macromolecules, employs a ligand (biologically active molecule bonded covalently to the solid matrix) which interacts with its homologous antigen (analyte) as a reversible complex that can be eluted by changing buffer conditions.
CHIRAL CHROMATOGRAPHY:
Separation of the enantiomers can be achieved on chiral stationary phases by formation of diastereomers via derivatizing agents or mobile phase additives on a chiral stationary phase. When used as an impurity test method, the sensitivity is enhanced if the enantiomeric impurity elutes before the enantiomeric drug.
ISOCRATIC SEPARATION
In this technique, the same mobile phase combination is used throughout the process of separation. The same polarity or elution strength is maintained the process.
GRADIENT SEPARATION In this
ANALYTICAL HPLC
In this only analysis of the samples are done. Recovery of the samples for reusing is normally not
done, since the samples used are very low.
PREPARATIVE HPLC
Where analysis of the individual fractions of pure compounds can be collected using fraction
collector. The collected samples are reused.
ION-PAIR CHROMATOGRAPHY11
Ion Pair Chromatography (IPC) is used to separate ionic analytes on a Column. An Ion Pair reagent is added to modulate retention of the ionic analytes. Ion-pair chromatography is commonly used in combination with UV detection, in which case it is referred as reverse phase ion-pair chromatography (RPIPC).
Principle of ion-pairing:
Separation mechanism:
Ion-exchange selectivity is mediated by
selectivity of an ion-pair separation is determined primarily by the mobile phase. The two major components of aqueous mobile phase are the ion
concentration of each component can be varied to achieve desired separation. The ion
is a large ionic molecule that carries a charge opposite to analyte of interest. It usually has both hydrophobic region to interact with the analyte. Stationa
hydrophobic resins such as polystyrene, divinyl benzene or bonded silica. A single stationary phase can be used for either anion or cation analysis.
Although the retention mechanism of ion theories have been proposed:
Ion pair formation
Dynamic ion exchange
Ion interaction
In first model, the analyte and ion the mobile phase and stationary
organic solvent in the mobile phase as in reverse phase chromatography.
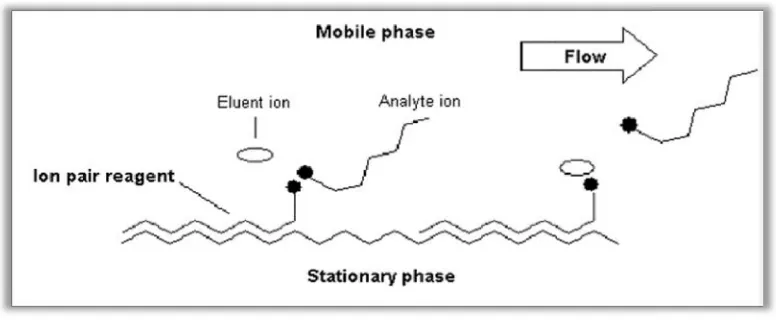
[image:21.612.130.518.67.228.2]The dynamic ion-exchange model maintains that the hydrophobic portion of ion adsorbs to the hydrophobic stationary phase to form a dynamic ion
Fig No.1: Ion Pairing
exchange selectivity is mediated by both the mobile phase and stationary phase. In contrast the pair separation is determined primarily by the mobile phase. The two major components of aqueous mobile phase are the ion-pair reagent and the organic solvent; the type and concentration of each component can be varied to achieve desired separation. The ion
is a large ionic molecule that carries a charge opposite to analyte of interest. It usually has both hydrophobic region to interact with the analyte. Stationary phases used for ion
hydrophobic resins such as polystyrene, divinyl benzene or bonded silica. A single stationary phase can be used for either anion or cation analysis.
Although the retention mechanism of ion-pair chromatography is not fully understood, three major
In first model, the analyte and ion-pair reagent form a neutral pair, which is then partitions between the mobile phase and stationary phase. Retention can be controlled by varying the concentration of organic solvent in the mobile phase as in reverse phase chromatography.
exchange model maintains that the hydrophobic portion of ion
stationary phase to form a dynamic ion-exchange surface. The analyte both the mobile phase and stationary phase. In contrast the pair separation is determined primarily by the mobile phase. The two major pair reagent and the organic solvent; the type and concentration of each component can be varied to achieve desired separation. The ion-pair reagent is a large ionic molecule that carries a charge opposite to analyte of interest. It usually has both ry phases used for ion-pair are neutral, hydrophobic resins such as polystyrene, divinyl benzene or bonded silica. A single stationary phase
fully understood, three major
pair reagent form a neutral pair, which is then partitions between varying the concentration of
is retained on this surface, as it would in classic Ion Chromatography. Using this scenario, solvents used in the mobile phase can be used to impede interaction of ion-pair reagent with the stationary phase, there by altering the capacity of the column.
A third model describes an electrical double layer that is formed when ion-pair reagent permeates the stationary phase, carrying with it an associated counter-ion. Retention of analyte ion in this model is dependent upon a combination of factors including those described in first two models.
Typical IP reagents are divided into two categories
Cationic:These are used for anion analysis. Cationic ion-pair reagents include ammonium and tetra methyl-, tetraethyl-, tetra propyl-, and tetra butyl ammonium.
Anionic: These reagents used for cation analysis. Anionic ion-pair reagents include hydrochloric, perchloric, and perfluorocarboxylic acids and pentane-, hexane-, heptane-, and octane sulfonic acids.
INSTRUMENTATION OF HPLC4
The individual components HPLC and their working functions are described below.
Mobile phase and reservoir
Solvent degassing system
Pump
Injector
Column
Detector
Data system
MOBILE PHASE AND RESERVOIR
The most common type of solvent reservoir is a glass bottle. Most of the manufacturers supply these bottles with special caps, Teflon tubing and filters to connect to the pump inlet and to the purge gas (helium) used to remove dissolved air.
The mobile phase is pumped under pressure from one or several reservoirs and flows through the column at a constant rate. With micro particulate packing, there is a high
chromatography column. Eluting power of the mobile phase is determined by it
the polarity of the stationary phase and the nature of the sample components. For normal phase separations, eluting power increases with increasing polarity of the solvent but for reversed phase separations, eluting power decreases with
conditions can be achieved by making use of mixture of two solvents. Some other properties of the solvents, which need to be considered for a
detector compatibility, flammability and toxicity.
Mobile phases used for HPLC typically are mixtures of organic solvents and water or aqueous buffers. Isocratic methods are preferable to gradient methods. Gradient methods will sometimes be required when the molecules being separated have vastly different partitioning properties. When a gradient elution method is used, care must be taken to ensure that all solvents are miscible.
[image:23.612.130.500.88.275.2]The following points should also be considered when choosing a mobile phase Fig No.2: Block diagram of HPLC
MOBILE PHASE AND RESERVOIR
The most common type of solvent reservoir is a glass bottle. Most of the manufacturers supply these bottles with special caps, Teflon tubing and filters to connect to the pump inlet and to the purge gas (helium) used to remove dissolved air.
ase is pumped under pressure from one or several reservoirs and flows through the column at a constant rate. With micro particulate packing, there is a high-pressure drop across a chromatography column. Eluting power of the mobile phase is determined by it
the polarity of the stationary phase and the nature of the sample components. For normal phase separations, eluting power increases with increasing polarity of the solvent but for reversed phase separations, eluting power decreases with increasing solvent polarity. Optimum separating conditions can be achieved by making use of mixture of two solvents. Some other properties of the ich need to be considered for a successful separation, are boiling point, viscosity, patibility, flammability and toxicity.
Mobile phases used for HPLC typically are mixtures of organic solvents and water or aqueous buffers. Isocratic methods are preferable to gradient methods. Gradient methods will sometimes be being separated have vastly different partitioning properties. When a gradient elution method is used, care must be taken to ensure that all solvents are miscible.
The following points should also be considered when choosing a mobile phase
The most common type of solvent reservoir is a glass bottle. Most of the manufacturers supply these bottles with special caps, Teflon tubing and filters to connect to the pump inlet and to the
ase is pumped under pressure from one or several reservoirs and flows through the pressure drop across a chromatography column. Eluting power of the mobile phase is determined by its overall polarity, the polarity of the stationary phase and the nature of the sample components. For normal phase separations, eluting power increases with increasing polarity of the solvent but for reversed phase increasing solvent polarity. Optimum separating conditions can be achieved by making use of mixture of two solvents. Some other properties of the successful separation, are boiling point, viscosity,
Mobile phases used for HPLC typically are mixtures of organic solvents and water or aqueous buffers. Isocratic methods are preferable to gradient methods. Gradient methods will sometimes be being separated have vastly different partitioning properties. When a gradient elution method is used, care must be taken to ensure that all solvents are miscible.
It is essential to establish that the drug is stable in the mobile phase for at least the duration of the analysis.
Excessive salt concentrations should be avoided. High salt concentrations can result in precipitation, which can damage HPLC equipment.
The mobile phase should have a pH 2.5 and pH 7.0 to maximize the lifetime of the column.
Reduce cost and toxicity of the mobile phase by using methanol instead of acetonitrile when possible minimize the absorbance of buffer. Since trifluoroacetic acid, acetic acid or formic acid absorb at shorter wavelengths, they may prevent detection of products without chromophores above 220 nm. Carboxylic acid modifiers can be frequently replaced by phosphoric acid, which does not absorb above 200 nm.
Use volatile mobile phases when possible, to facilitate collection of products and LC-MS analysis. Volatile mobile phases include ammonium acetate, ammonium phosphate, formic acid, acetic acid, and trifluoroacetic acid. Some caution is needed as these buffers absorb below 220 nm.
Ionizable compounds in some cases can present some problems when analyzed by reverse phase chromatography. Two modifications of the mobile phase can be useful in reverse phase HPLC for ionizable compounds. One is called ion suppression and other ion pairing chromatography. In both techniques, a buffer is used to ensure that the pH of the solution is constant and usually at least 1.5 pH units from a pKa of the drug to ensure that one form predominates.
If pH is approximately equal to pKa, peak broadening can occur. In ion suppression chromatography, the pH of the aqueous portion of the mobile phase is adjusted to allow the neutral form of the drug to predominate. This ensures that the drug is persistent in only one form and results in improvement of the peak shape and consistency of retention times.
In ion pairing chromatography, the pH of the mobile phase is adjusted so that the drug is completely ionized. If necessary to improve peak shape or lengthen retention time, an alkyl sulfonic acid salt or bulky anion such as trifluoroacetic acid is added to the ion pair to cationic drugs or a quaternary alkyl ammonium salt is added to ion-pair to anionic drugs. Ion pairing chromatography also allows the simultaneous analysis of both neutral and charged compounds.
SOLVENT DEGASSING SYSTEM12
They include heating and stirring, vacuum degassing with an aspirator, filtration through 0.45 filter, vacuum degassing with an air-soluble membrane, helium purging ultra signification or purging or combination of these methods. Helium purging and storage of the solvent under helium is not sufficient for degassing aqueous solvents. It is useful to apply a vacuum for 5-10 min and then keep the solvent under a helium atmosphere.
HPLC systems are also provided an online degassing system, which continuously removes the dissolved gases from the mobile phase.
PUMP:
High pressure pumps are needed to force solvents through packed stationary phase beds. Smaller bed particles require higher pressures. There are many advantages to using smaller particles, but they may not be essential for all separations.
The most important advantages are: higher resolution, faster analyses, and increased sample load capacity. However, only the most demanding separations require these advances in significant amounts.
Many separation problems can be resolved with larger particle pickings that require less pressure. Flow rate stability is another important pump feature that distinguishes pumps. Very stable flow rates are usually not essential for analytical chromatography.
However, if the user plans to use a system in size exclusion mode, then there must be a pump which provides an extremely stable flow rate. An additional feature found on the more elaborate pumps is external electronic control. Although it adds to the expense of the pump, external electronic control is a very desirable feature when automation or electronically controlled gradients are to be run.
Alternatively, this becomes an undesirable feature (since it is an unnecessary expense) when using isocratic methods. The degree of flow control also varies with pump expense. More expensive pumps include such state of-the-art technology as electronic feedback and multi headed configurations.
It is desirable to have an integrated degassing system, either helium purging, or membrane filtering.
INJECTOR
In more sophisticated LC systems, automatic sampling devices are incorporated where the sample is introduced with the help of auto samplers and microprocessors. In liquid chromatography, liquid samples may be injected directly and solid samples need only be dissolved in an appropriate solvent.
The solvent need not be the mobile phase, but frequently it is judiciously chosen to avoid detector interference, column/component interference, and loss in efficiency or all of these.
It is always best to remove particles from the sample by filtering over a 5 μm filter, or centrifuging,
since continuous injections of particulate material will eventually cause blockages in injection devices or columns. Sample sizes may vary widely.
The availability of highly sensitive detectors frequently allows use of the small samples which yield the highest column performance. Sample introduction techniques can be used with a syringe or an injection valve.
COLUMN
The heart of the system is the column. The choice of common packing material and mobile phases depends on the physical properties of the drug.
Many different reverse phase columns will provide excellent specificity for any particular separation. It is therefore best to routinely attempt separations with a standard C8 or C18column and determine if it provides good separations. If this column does not provide good separation or the mobile phase is unsatisfactory, alternate methods or columns should be explored.
Reverse phase columns differ by the carbon chain length, degree of end capping and percent carbon loading. Diol, cyano and amino groups can also be used for reverse phase chromatography.
Typical HPLC columns are 5, 10, 15 and 25 cm in length and are filled with small diameter (3, 5 or
For this reason, it is generally recommended that all but the most experienced chromatographers purchase prepacked columns, since it is difficult to match the high performance of professionally packed LC columns without a large investment in time and equipment.
In general, LC columns are fairly durable and one can expect a long service life unless they are used in some manner which is intrinsically destructive, as for example, with highly acidic or basic eluents, or with continual injections of 'dirty' biological or crude samples.
It is wise to inject some test mixture (under fixed conditions) into a column when new, and to retain the chromatogram. If questionable results are obtained later, the test mixture can be injected again under specified conditions.
The two chromatograms may be compared to establish whether or not the column is still useful.
DETECTOR
Today, optical detectors are used most frequently in liquid chromatographic systems. These detectors pass a beam of light through the flowing column effluent as it passes through a low
Volume (~ 10μl) flow cell.
The variations in light intensity caused by UV absorption, fluorescence emission or change in refractive index, from the sample components passing through the cell, are monitored as changes in the output voltage.
These voltage changes are recorded on a strip chart recorder and frequently are fed into a computer to provide retention time and peak area data. The most commonly used detector in LC is the ultraviolet absorption detector.
A variable wavelength detector of this type, capable of monitoring from 190 to 400 nm, will be found suitable for the detection of the majority samples.
Other detectors in common use include: Photo Diode Array UV detector (PDA), refractive index (RI), fluorescence (FLU), electrochemical (EC).
The RI detector is universal but also the less sensitive one. FLU and EC detectors are quite sensitive (up to 10-15 pmole) but also quite selective.
Since the detector signal is electronic, using modern data collection techniques can aid the signal analysis. In addition, some systems can store data in a retrievable form for highly sophisticated computer analysis at a later time.
The main goal in using electronic data systems is to increase analysis accuracy and precision, while reducing operator attention.
There are several types of data systems, each differing in terms of available features. In routine analysis, where no automation (in terms of data management or process control) is needed, a pre-programmed computing integrator may be sufficient.
If higher control levels are desired, a more intelligent device is necessary, such as a data station or minicomputer. The advantages of intelligent processors in chromatographs are found in several areas.
First, additional automation options become easier to implement. Secondly, complex data analysis becomes more feasible. These analysis options include such features as run parameter optimization and deconvolution (i.e. resolution) of overlapping peaks.
Finally, software safeguards can be designed to reduce accidental misuse of the system.
HPLC THEORY
5,6:
System Suitability Parameters
High performance liquid chromatography is defined as a separation of mixtures of compounds due to differences in their distribution equilibrium between two phases, the stationary phase packed inside columns and the mobile phase, delivered through the columns by high pressure pumps.
Components whose distribution into the stationary phase is higher, are retained longer, and get separated from those with lower distribution into the stationary phase. The theoretical and practical foundations of this method were laid down at the end of 1960s and at the beginning of 1970s.
Retention Time (t
R), Capacity Factor k' & Relative Retention Time (RRT)
The time elapsed between the injection of the sample components into the column and their detection is known as the Retention Time (tR).
The retention time is longer when the solute has higher affinity to the stationary phase due to its chemical nature. For example, in reverse phase chromatography, the more lypophilic compounds are retained longer.
Therefore, the retention time is a property of the analyte that can be used for its identification. A non retained substance passes through the column at a time t0, called the Void Time.
Retention factor is calculated as follows:
The Capacity Factor describes the thermodynamic basis of the separation and its definition is the ratio of the amounts of the solute at the stationary and mobile phases within the analyte band inside the chromatographic column:
Where Csis the concentration of the solute at the stationary phase and Cmis its concentration at the mobile phase and phi is the ratio of the stationary and mobile phase volumes all within the chromatographic band.
The Retention Factor is used to compare the retention of a solute between two chromatographic systems, normalizing it to the column's geometry and system flow rate.
between the retention time of any peak in the chromatogram and the retention time of the marker is used (tR (Peak) / tR (Marker)) and referred to as the
RRT is also used instead of the capacity rati
compare its extent of retention in two different chromatographic systems.
The sharpness of a peak relative to its retention time is a measure of the system's efficiency, calculated as N, plate count. Band
molecular diffusion, and mass-transfer kinetics and extra the separation.
The sharpness of a peak is relevant to the limit of detection and limit of qu
chromatographic system. The sharper the peak for a specific area, the better is its signal hence the system is capable of detecting lower concentrations.
Therefore, the efficiency of the chromatographic system must be establ
suitability test before the analysis of low concentrations that requires high sensitivity of the system, such as the analysis of drug impurities and degradation products.
Efficiency: Plate Count N and Peak Capacity P
The efficiency of the separation is determined by the Plate Count N when working at isocratic conditions, whereas it is usually measured by Peak Capacity P
conditions.
The following equation for the plate count is used by the United States Pharmac calculate N:
Where w is measured from the baseline peak width calculated using lines tangent to the peak width at 50 % height. European and Japanese Pharmacopoeias use the peak width at 50% of the peak height, hence the equation becomes:
between the retention time of any peak in the chromatogram and the retention time of the marker is ) and referred to as the Relative Retention Time (RRT).
RRT is also used instead of the capacity ratio for the identification of the analyte as well as to compare its extent of retention in two different chromatographic systems.
The sharpness of a peak relative to its retention time is a measure of the system's efficiency, Band-broadening phenomena in the column such as eddy diffusion, transfer kinetics and extra-column effects reduce the efficiency of
The sharpness of a peak is relevant to the limit of detection and limit of qu
The sharper the peak for a specific area, the better is its signal hence the system is capable of detecting lower concentrations.
Therefore, the efficiency of the chromatographic system must be established by the system suitability test before the analysis of low concentrations that requires high sensitivity of the system, such as the analysis of drug impurities and degradation products.
Efficiency: Plate Count N and Peak Capacity Pc
the separation is determined by the Plate Count N when working at isocratic conditions, whereas it is usually measured by Peak Capacity Pc when working at gradient
The following equation for the plate count is used by the United States Pharmac
is measured from the baseline peak width calculated using lines tangent to the peak width European and Japanese Pharmacopoeias use the peak width at 50% of the peak height, hence the equation becomes:
between the retention time of any peak in the chromatogram and the retention time of the marker is
o for the identification of the analyte as well as to
The sharpness of a peak relative to its retention time is a measure of the system's efficiency, broadening phenomena in the column such as eddy diffusion, column effects reduce the efficiency of
The sharpness of a peak is relevant to the limit of detection and limit of quantification of the The sharper the peak for a specific area, the better is its signal-to-noise;
ished by the system suitability test before the analysis of low concentrations that requires high sensitivity of the system,
the separation is determined by the Plate Count N when working at isocratic when working at gradient
The following equation for the plate count is used by the United States Pharmacopoeia (USP) to
Peak Capacity Pcis defined as number of peaks that can be separated within a retention window for a specific pre-determined resolution. In other words, it is the runtime measured in peak width units (34). It is assumed that peaks occur over the gradie
Therefore, Peak Capacity can be calculated from the peak widths follows:
Where n is the number of peaks at the segment of the gradient selected for the calculation, peak capacity can be simply the gradient run time div
the peaks the higher is the peak capacity, hence the system should be able to resolve more peaks at the selected run time as well as detect lower concentrations.
Another measure of the column's chromatographic
Theoretical Plate (HETP) which is calculated from the following equation:
HETP = (L/N)
Where L is column length and N is the plate count.
The behavior of HETP as function of linear velocity has been described by various equations. It is frequently called "The Van-Deemter curve", and it is frequently used to describe and characterize various chromatographic stationary phases' performance and
The lower are the values of HETP, the more efficient is the chromatographic system, enabling the detection of lower concentrations due to the enhanced signal
chromatogram.
Peak Asymmetry Factor Afand
The chromatographic peak is assumed to have a Gaussian shape under ideal conditions, describing normal distribution of the velocity of the molecules populating the peak zone migrating through the stationary phase inside the column.
is defined as number of peaks that can be separated within a retention window for determined resolution. In other words, it is the runtime measured in peak width units It is assumed that peaks occur over the gradient chromatogram.
can be calculated from the peak widths w in the chromatogram as
is the number of peaks at the segment of the gradient selected for the calculation, peak capacity can be simply the gradient run time divided by the average peak width.
the peaks the higher is the peak capacity, hence the system should be able to resolve more peaks at the selected run time as well as detect lower concentrations.
Another measure of the column's chromatographic efficiency is the Height Equivalent to which is calculated from the following equation:
Where L is column length and N is the plate count. HETP is measured in micrometer.
The behavior of HETP as function of linear velocity has been described by various equations. It is Deemter curve", and it is frequently used to describe and characterize various chromatographic stationary phases' performance and compare them to each other.
The lower are the values of HETP, the more efficient is the chromatographic system, enabling the detection of lower concentrations due to the enhanced signal-to-noise ratio of all the peaks in the
and Tailing Factor T
The chromatographic peak is assumed to have a Gaussian shape under ideal conditions, describing normal distribution of the velocity of the molecules populating the peak zone migrating through the
lumn.
is defined as number of peaks that can be separated within a retention window for determined resolution. In other words, it is the runtime measured in peak width units
in the chromatogram as
is the number of peaks at the segment of the gradient selected for the calculation, tg. Thus ided by the average peak width. The sharper the peaks the higher is the peak capacity, hence the system should be able to resolve more peaks at
Height Equivalent to
HETP is measured in micrometer.
The behavior of HETP as function of linear velocity has been described by various equations. It is Deemter curve", and it is frequently used to describe and characterize
compare them to each other.
The lower are the values of HETP, the more efficient is the chromatographic system, enabling the noise ratio of all the peaks in the
Any deviation from the normal distribution indicates non
migration process therefore might jeopardize the integrity of the peak's integration, redu accuracy of the quantification.
always measured in the system suitability step of the analysis.
The deviation from symmetry is measured by the calculation of Asymmetry Factor
Where A and B are sections in the horizontal line parallel to the baseline, drawn at 10% of the peak height
The calculation of Tailing Factor
suggested by the pharmacopeias, is described by the following equation:
Where A and B are sections in the horizontal line parallel to the baseline, drawn at 5% of the peak height. The USP suggests that
precise and accurate quantitative measurement.
Selectivity Factor: Alfa and Resolution Factor Rs
The separation is a function of the thermodynamics of the system. Substances are separated in a chromatographic column when their rate of
between the stationary and mobile phases.
The Selectivity Factor, α, and Resolution Factor, Rs adjacent peaks. The Selectivity Factor
the two peaks (k'2/k'1), whereas the
retention times of the two peaks relative to their width
The equation that describes the experimental measurement follows:
Any deviation from the normal distribution indicates non-ideality of the distribution and the migration process therefore might jeopardize the integrity of the peak's integration, redu
This is the reason why USP Tailing is a peak's parameter almost always measured in the system suitability step of the analysis.
The deviation from symmetry is measured by the Asymmetry Factor, Af or Tailing Factor Asymmetry Factor, Afis described by the following equation:
are sections in the horizontal line parallel to the baseline, drawn at 10% of the peak
Tailing Factor, T, which is more widely used in the pharmaceutical industry, as suggested by the pharmacopeias, is described by the following equation:
Where A and B are sections in the horizontal line parallel to the baseline, drawn at 5% of the peak The USP suggests that Tailing Factor should be in the range of 0.5 up to
precise and accurate quantitative measurement.
Resolution Factor Rs
The separation is a function of the thermodynamics of the system. Substances are separated in a chromatographic column when their rate of migration differs, due to their different distribution between the stationary and mobile phases.
Resolution Factor, Rs, measure the extent of separation between two Selectivity Factor accounts only for the ratio of the Retention Factors ), whereas the Resolution Factor, Rs, accounts for the difference between the retention times of the two peaks relative to their width
The equation that describes the experimental measurement of the Resolution Factor, Rs ideality of the distribution and the migration process therefore might jeopardize the integrity of the peak's integration, reducing the USP Tailing is a peak's parameter almost
Tailing Factor T. The
are sections in the horizontal line parallel to the baseline, drawn at 10% of the peak
, which is more widely used in the pharmaceutical industry, as
Where A and B are sections in the horizontal line parallel to the baseline, drawn at 5% of the peak should be in the range of 0.5 up to 2 to assure a
The separation is a function of the thermodynamics of the system. Substances are separated in a migration differs, due to their different distribution
, measure the extent of separation between two Retention Factors, k', of , accounts for the difference between the
Where tRis the retention time of peaks 1 and 2 respectively and the tangents' baseline. According to the pharmacopeias quantitative measurement.
The resolution is a critical value when working with complex samples such as drug impurities and degradation products, or when the formulation is complex and excipients might interfere with the quantitative measurements. Therefore, it is a
stage before the quantitative work of these types of samples.
The sample used for the measurements of
Resolution Solution, It usually contains the components that are the most difficult to resolve.
The theoretical description of the
some of the above parameters, the plate count capacity factors k':
It can be clearly seen from this equation that the plate count is the most effecting parameter in the increase of the chromatographic resolution.
particle diameter, it explains the reduction in particle diameter of the stationary phase material during the last 3 decades of HPLC.
This is also the rationale behind the recent trend in HPLC, the use of sub 2 micron particle columns and the development of a specially design of ultra performance HPLC systems to accommodate such columns.
is the retention time of peaks 1 and 2 respectively and w is their respective peak width at According to the pharmacopeias Rs should be above 1.5 for an accurate
The resolution is a critical value when working with complex samples such as drug impurities and degradation products, or when the formulation is complex and excipients might interfere with the Therefore, it is an essential part of the system suitability measurement stage before the quantitative work of these types of samples.
The sample used for the measurements of Rs during the system suitability runs is sometimes called , It usually contains the components that are the most difficult to resolve.
The theoretical description of the Resolution Factor Rs equation is shown in Equation. It includes some of the above parameters, the plate count N, the selectivity α and the average of the two peaks'
It can be clearly seen from this equation that the plate count is the most effecting parameter in the increase of the chromatographic resolution. Since the plate count increases with the reduction in diameter, it explains the reduction in particle diameter of the stationary phase material during the last 3 decades of HPLC.
This is also the rationale behind the recent trend in HPLC, the use of sub 2 micron particle columns ecially design of ultra performance HPLC systems to accommodate is their respective peak width at should be above 1.5 for an accurate
The resolution is a critical value when working with complex samples such as drug impurities and degradation products, or when the formulation is complex and excipients might interfere with the n essential part of the system suitability measurement
during the system suitability runs is sometimes called , It usually contains the components that are the most difficult to resolve.
equation is shown in Equation. It includes rage of the two peaks'
It can be clearly seen from this equation that the plate count is the most effecting parameter in the Since the plate count increases with the reduction in diameter, it explains the reduction in particle diameter of the stationary phase material
1.2 ANALYTICAL METHOD DEVELOPMENT7
Method development has following steps:
Collect information on sample, define separation goals
Need for special HPLC procedure, sample pretreatment, etc.
Choose detector and detector settings
Choose LC method, preliminary run, select best separation conditions
Optimize separation conditions
Check for problems, requirement for special procedure
Recover purified material Quantitative calibration Qualitative method
A good method development strategy should require only as many experimental runs as are necessary to achieve the desired final result. Finally method development should be as simple as possible, and it should allow the use of sophisticated tools such as computer modeling.
The important factors, which are to be taken into account to obtain reliable quantitative analysis, are:
1. Careful sampling and sample preparation. 2. Appropriate choice of the column.
3. Choice of the operating conditions to obtain the adequate resolution of the mixture. 4. Reliable performance of the recording and data handling systems.
5. Suitable integration/peak height measurement technique. 6. The mode of calculation best suited for the purpose 7. Validation of the developed method.
Sample preparation
Samples come in various forms:
Solutions ready for injection
Solutions that require dilution, buffering, addition of an internal standard or other volumetric manipulation
Solids must be dissolved or extracted
Samples that require pretreatment to remove interferences and/or protect the column or equipment from damage.
SELECTING HPLC METHOD AND INITIAL CONDITIONS:
The mode of HPLC can be selected based on the following chart:
In many cases the development of an adequate sample pretreatment can be challenging for achieving a good HPLC separation. The samples may be of two types, regular or special. The regular samples are typical mixtures of small molecules (<2000Da) that can be separated by normal starting conditions.
Reverse phase Hydro carbon
soluble
Adsorption Organic soluble
Normalphase Alcoholsoluble
Adsorption
MW<2000 Cation
exchange Electrolyte
Anion exchange Water soluble
Reversephase Sample
Non electrolyte
Normalphase
Organic soluble SFC
MW>2000
GOALS THAT ARE TO BE ACHIEVED IN METHOD DEVELOPMENT
Table No.1: Goals in method development8
Goal Comment
Separation time <5-10 min is desirable for routine procedures.
Quantification 2% for assays; 5% for less-demanding analyses 15% for trace analyses.
Pressure <150 bars is desirable, <200 bars is usually essential (new column assumed).
Peak height Narrow peaks are desirable for large signal/noise ratios.
Solvent consumption Minimum mobile-phase use per run is desirable.
OPTIMIZATION OF HPLC METHOD
During the optimization stage, the initial sets of conditions that have evolved from the first stages of development are improved or maximized in terms of resolution and peak shape, plate counts, asymmetry, capacity factor, elution time, detection limits, limit of quantification and overall ability to quantify the specific analyte of interest.
Optimization of a method can follow either of two general approaches:
Manual
Computer driven
This univariate approach to system is slow, time consuming and potentially expensive. However, it may provide a much better understanding of the principles and theory involved and of interactions of the variables. In the second approach, computer driven automated method development, efficiency is optimized while experimental input is minimized. Computer driven automated approaches can be applied to many applications. In addition, they are capable of significantly reducing the time, energy and cost of all instrumental method development.
The various parameters that include to be optimized during method development are
Selection of mode of separation.
Selection of stationary phase.
Selection of mobile phase.
Selection of detector.
Selection of Mode of Separation
In reverse phase mode, the mobile phase is comparatively more polar than the stationary phase. For the separation of polar or moderately polar compounds, the most preferred mode is reverse phase.
The nature of the analyte is the primary factor in the selection of the mode of separation. A second factor is the nature of the matrix.
A useful and practical measurement of peak shape is peak asymmetry factor and peak tailing factor. Peak asymmetry is measured at 10% of full peak height and peak tailing factor at 5%. Reproducibility of retention times and capacity factor is important for developing a rugged and repeatable method.
Buffers if any and its Strength
Buffer and its strength play an important role in deciding the peak symmetries and separations. Some of the most commonly employed buffers are
Phosphate buffers prepared using salts like KH2PO4, K2HPO4, NaH2PO4, Na2HPO4etc.
Phosphoric acid buffers prepared using H3PO4.
Acetate buffers-Ammonium acetate, Sodium acetate etc.
The retention also depends on the molar strengths of the buffer-Molar strength is increasingly proportional to retention times. The strength of the buffer can be increased, if necessary to achieve the required separations. The solvent strength is a measure of its ability to pull analyte from the column. It is generally controlled by the concentration of the solvent with the highest strength.
It is important to maintain the pH of the mobile phase in the range of 2.0 to 8.0 as most columns does not withstand to the pH which are outside this range. This is due to the fact that the siloxane linkages are cleaved below pH 2.0, while pH values above 8.0, silica may dissolve.
Mobile Phase Composition
Most chromatographic separations can be achieved by choosing the optimum mobile phase composition. This is due to the fact that fairly large amount of selectivity can be achieved by choosing the qualitative and quantitative composition of aqueous and organic portions.
Most widely used solvents in reverse phase chromatography are Methanol and Acetonitrile. Experiments should be conducted with mobile phases having buffers with different pH and different organic phases to check for the best separations of analyte peak.
A mobile phase which gives separation of analyte peak and which is rugged for variation of both aqueous and organic phase by at least ± 0.2% of the selected mobile phase composition should be used.
Selection of Detector
The detector was chosen depending upon some characteristic property of the analyte like UV absorbance, florescence, conductance, oxidation, reduction etc. The characteristics that are to be fulfilled by a detector to be used in HPLC determination are,
High sensitivity facilitating trace analysis
Negligible baseline noise to facilitate lower detection
Large linear dynamic range.
Low dead volume
Inexpensive to purchase and operate
For the greatest sensitivity λmax should be used. Ultra violet wavelengths below 200nm should be
avoided because detector noise increases in this region. Higher wavelengths give greater selectivity.
Performance Calculations
Carrying out system suitability experiment does the performance calculations. System suitability experiments can be defined as tests to ensure that the method can generate results of acceptable accuracy and precision.
The requirements for system suitability are usually developed after method development and validations have been completed. The criteria selected will be based on the actual performance of the method as determined during its validation. For example, if sample retention times form part of the system suitability criteria, their variation SD can be determined during validation.
System suitability might then require that retention times fall within a ±3 SD range during routine performance of the method.
The USP (2000) defines parameters that can be used to determine system suitability prior to analysis. These parameters include plate number (n), tailing factor (T), resolution (RS) and relative standard deviation (RSD) of peak height or peak area for respective injections.
The RSD of peak height or area of five injections of a standard solution is normally accepted as one of the standard criteria. For assay method of a major component, the RSD should typically be less than 1% for these five respective injections.
The plate number and/ or tailing factor are used if the run contains only one peak. For chromatographic separations with more than one peak, such as an internal standard assay or an impurity method expected to contain many peaks, some measure of separations such as RS is recommended. Reproducibility of tR or k value for a specific compound also defines system performance.
1.3 ANALYTICAL METHOD VALIDATION9,10
Method validation can be defined as (ICH) “Establishing documented evidence, which provides a
high degree of assurance that a specific activity will consistently produce a desired result or product meeting its predetermined specifications and quality characteristics”.
Method validation is an integral part of the method development; it is the process by which a method is tested by the developer or user for reliability, accuracy and preciseness of its intended purpose and demonstrating that analytical procedures are suitable for their intended use that they support the identity, quality, purity, and potency of the drug substances and drug products.
Data thus generated become part of the methods validation package submitted to Center for Drug Evaluation and Research (CDER). Simply, method validation is the process of proving that an analytical method is acceptable for its intended purpose.
All the variables of the method should be considered, including sampling procedure, sample preparation, chromatographic separation, and detection and data evaluation. For chromatographic methods used in analytical applications there is more consistency in validation practice with key analytical parameters includes namely
System suitability
Specificity
Accuracy
Precision
Linearity
Limit of Detection
Limit of Quantification
Ruggedness
Robustness
SYSTEM SUITABILITY