This is a repository copy of The Demand for Taxis and the Value of Time – A Welfare
Analysis..
White Rose Research Online URL for this paper:
http://eprints.whiterose.ac.uk/2230/
Monograph:
Toner, J.P. (1991) The Demand for Taxis and the Value of Time – A Welfare Analysis.
Working Paper. Institute of Transport Studies, University of Leeds , Leeds, UK.
Working Paper 333
[email protected] https://eprints.whiterose.ac.uk/ Reuse
See Attached Takedown
If you consider content in White Rose Research Online to be in breach of UK law, please notify us by
White Rose Research Online
http://eprints.whiterose.ac.uk/
Institute of Transport Studies
University of Leeds
This is an ITS Working Paper produced and published by the University of
Leeds. ITS Working Papers are intended to provide information and encourage
discussion on a topic in advance of formal publication. They represent only the
views of the authors, and do not necessarily reflect the views or approval of the
sponsors.
White Rose Repository URL for this paper:
http://eprints.whiterose.ac.uk/
2230/
Published paper
Toner, J.P. (1991) The Demand for Taxis and the Value of Time – A Welfare
Analysis. Institute of Transport Studies, University of Leeds. Working Paper 333
Working Paper 333
August
1991
THE DEMAND FOR TAXIS
AND THE VALUE OF TIME
- A WELFARE ANALYSIS
Jeremy P Toner
ITS Working Papers are intended to provide information and encourage discussion on a topic in advance of formal publication. They represent only the views of the authors, and do not necessarily reflect the views or approval of the sponsors.
ABSTRACT
CONTENTS Page
1. Introduction 1
2. Taxi users' values of time: a stated preference approach 2
2.1 Introduction 2
2.2 Experimental design 2
2.3 Basic models 3
2.4 Modelling issues 4
2.5 Non-linearities in the values of time 5
2.6 Socio economic effects 7
3. Taxi demand models: a transfer price approach 10
4. A welfare analysis of price and quanitity regulation 15
Bibliography 22
Appendix 1: Summary of the questionnaire results 23
1
1. INTRODUCTION
This paper reports the results of a study into the demand for hackney carriage services as part of an ESRC-sponsored project "The planning and regulation of local taxi markets". The paper details the results from two exercises; a study into the value of taxi users' time and a study into the price and service elasticities of demand for hackney carriages. 1 The survey work was carried out alongside a study commissioned by the City Council to assess the level of demand for taxi services in the city to comply with section 16 of the Transport Act, 1985, 2 although the study reported here was completely separate from the section 16 study.
The survey was carried out in October and November 1990; 1000 self-completion questionnaires were distributed to passengers boarding cabs at major taxi ranks in the university town; most were handed out at the post office rank, with smaller numbers at the Market Square and Railway Station ranks. 168 questionnaires were returned, a response rate of 17% 3. This is comparable to the response rate of 16% obtained in a similar study in Sheffield (Pells, (1990)) and is in accordance with our previous experience of this method of questionnaire distribution. A socio-economic break-down of the sample and a summary of the basic data obtained are reported in Appendix 1. The questionnaires were distributed during the hours 11:00 to 17:00 and so do not cover the peak in traffic often associated with the late-night leisure trade. The method of administration may have introduced certain biases through the sample not being totally random:
(a)people catching a taxi from a rank in the centre of the town during daylight hours may not be wholly typical of taxi users. In particular `private hire' bookings by telephone are omitted, as are any trips not originating in the centre, and all night time trips.
(b)people who are infrequent visitors to the town may have been less inclined to complete and return the questionnaire. This may include a high proportion of businessmen with high values of time, or a high proportion of tourists with potentially lower values of time:
(c)people who do not currently use taxis, but might do so if they were cheaper or more readily available, are excluded.
(d)people who are very sensitive to waiting time effects may have baulked if there was a queue of potential passengers and may thus be under-represented.
The results of this analysis must therefore be considered with regard to the above potential for bias.
1It should be noted that we are here concerned with the market for hackney carriages, that is primarily trips from a taxi rank, and not the private hire car market. Hackney carriages are distinguished from private hire cars by their exclusive right to "ply for hire", that is to be available for hire to the public on the street. Throughout the report, we use the term "taxi" to denote a hackney carriage available for hire on the street.
2For a discussion of section 16 and its effects to date, see Pells and Toner (1990).
3Some 37 responses were subsequently excluded from the analysis due to failure to complete the transfer price or stated preference experiments.
2
2.1 Introduction
The objective of this exercise was to provide empirical evidence on the value of taxi passengers walking time to taxi ranks, waiting times at ranks and in-vehicle time. This information is useful to regulators, who designate taxi ranks, set fares and, in this town, prescribe the number of vehicles able to ply for hire, in getting the balance right between fares and service levels. For example, if taxi users have very high values of waiting time, a regulator should try to ensure that, as far as possible, waiting times are kept low by licensing an adequate number of vehicles. Three previous studies have looked at:
Waiting time and vehicle type (Toner, 1990b) Waiting time (Pells, 1990)
Walking time, waiting time and vehicle type (Toner, 1990b) (Toner, 1991)
This study is the first to include the effect of in-vehicle time on the demand for taxis.
2.2 Experimental design
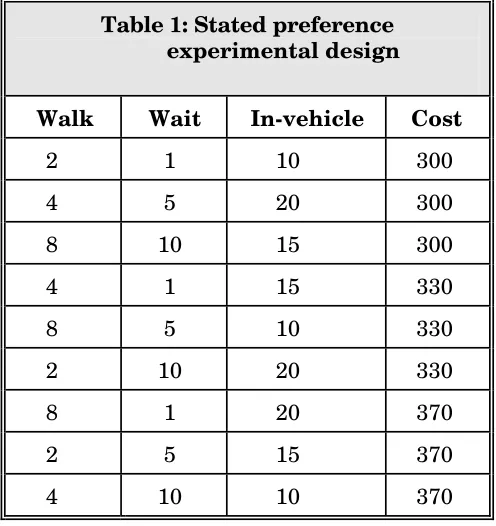
[image:7.595.174.422.462.725.2]Respondents were asked to assume that they had to make a 21/2 mile trip by taxi from a centrally located rank during the daytime. It was stated that respondents would have to bear the full cost of the journey themselves. They were then asked to consider nine alternative versions of this hypothetical taxi trip described in terms of the walk time to the taxi rank, the waiting time at the rank, the time spent in the vehicle (which, it was explained, varied according to the traffic conditions) and the fare, and to place these in order of preference (see Appendix 2 for the questionnaire used). The experimental design, chosen from Hahn and Shapiro (1966), is an orthogonal fractional factorial design with four variables at three levels each and is reproduced as table 1 below (times in minutes, cost in pence).
Table 1: Stated preference
experimental design
Walk Wait In-vehicle Cost
2 1 10 300
4 5 20 300
8 10 15 300
4 1 15 330
8 5 10 330
2 10 20 330
8 1 20 370
2 5 15 370
3
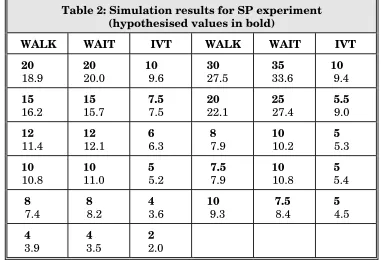
[image:8.595.106.487.179.441.2]The design was tested using synthetic data following the method of Fowkes and Wardman (1988) to check that it was capable of replicating accurately values of time over a range of values. As table 2 shows, the design in fact replicated values of walking time of between 4p/minute and 30p/min, values of waiting of between 4p/min and 35p/min and values of in-vehicle time of between 2p/min and 10p/min. None of the differences between the estimated values of time and the values of time specified in the simulation were significant at 5% level.
Table 2: Simulation results for SP experiment (hypothesised values in bold)
WALK WAIT IVT WALK WAIT IVT
20 18.9 20 20.0 10 9.6 30 27.5 35 33.6 10 9.4 15 16.2 15 15.7 7.5 7.5 20 22.1 25 27.4 5.5 9.0 12 11.4 12 12.1 6 6.3 8 7.9 10 10.2 5 5.3 10 10.8 10 11.0 5 5.2 7.5 7.9 10 10.8 5 5.4 8 7.4 8 8.2 4 3.6 10 9.3 7.5 8.4 5 4.5 4 3.9 4 3.5 2 2.0
2.3 Basic models
The basic device used for modelling the collected data was the multinominal logit model. Under the ordered logit formulation, a ranking of nine options by a respondent generates eight observations of preference which under certain assumptions can be treated as separate observations. Other issues relating to modelling are discussed in the next section.
The first model estimated was a straightforward linear utility function with all variables included and a full rank:-
UTILITY = -0.198WALK -0.251WAIT -0.162E-1IVT -0.778 E-2COST (12.9) (20.1) (1.8) (6.2)
(t-statistics in parentheses) rho-square = 0.1836
VOWALK = 25.4 p/min VOWAIT = 32.2 p/min VIVT = 2.1 p/min
4
The results of this model give very high values for walking and waiting time, about 6 times higher than the values generally accorded to bus users (MVA et al, 1987), but a much lower value (coefficient and value of time not significant at 5% level) for in-vehicle time. An attempt was made to see if the model could be improved by omitting the IVT variable. While this may then render the model inappropriate for forecasting purposes, it still retains validity for valuation. The revised model was
UTILITY = -0.198WALK -0.251WAIT -0.774 E-2 COST (12.8) (20.1) (6.2)
rho-square = 0.1826 VOWALK = 25.5 p/min VOWAIT = 32.3 p/min
A comparison of the two models shows little to choose between them; values of time and the coefficients are almost identical, and the rhobar-squares are very similar at 0.1818 for the model including IVT and 0.1814 for the model excluding IVT. On balance, although the inclusion of IVT brings only slight improvement in the model, it is judged worth keeping since it has marginal significance (at the 10% level) and should, according to theory, be an influence on travel choice. The results do, though give some support to the hypothesis that people choosing to travel by taxi are doing so because they want to reach their destination as quickly as possible, and consider in-vehicle time to be minimised by taxi and, within each mode, relatively invariant. Walk time and wait time are significant determinants of mode choice, but for short town journeys, taxi in-vehicle time will always be at least as quick as any other mode (except walking in extreme traffic conditions) and, if taxi IVT is high because of congestion, IVT for bus will be even higher.
2.4 Modelling issues
5
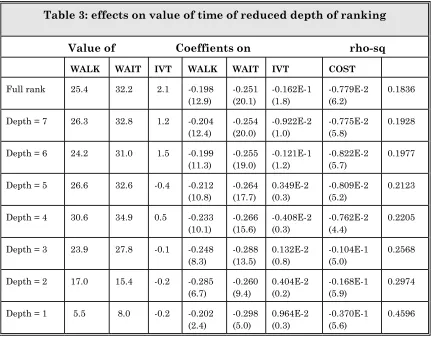
Table 3: effects on value of time of reduced depth of ranking
Value of Coeffients on rho-sq
WALK WAIT IVT WALK WAIT IVT COST
Full rank 25.4 32.2 2.1 -0.198
(12.9) -0.251 (20.1) -0.162E-1 (1.8) -0.779E-2 (6.2) 0.1836
Depth = 7 26.3 32.8 1.2 -0.204
(12.4) -0.254 (20.0) -0.922E-2 (1.0) -0.775E-2 (5.8) 0.1928
Depth = 6 24.2 31.0 1.5 -0.199
(11.3) -0.255 (19.0) -0.121E-1 (1.2) -0.822E-2 (5.7) 0.1977
Depth = 5 26.6 32.6 -0.4 -0.212
(10.8) -0.264 (17.7) 0.349E-2 (0.3) -0.809E-2 (5.2) 0.2123
Depth = 4 30.6 34.9 0.5 -0.233
(10.1) -0.266 (15.6) -0.408E-2 (0.3) -0.762E-2 (4.4) 0.2205
Depth = 3 23.9 27.8 -0.1 -0.248
(8.3) -0.288 (13.5) 0.132E-2 (0.8) -0.104E-1 (5.0) 0.2568
Depth = 2 17.0 15.4 -0.2 -0.285
(6.7) -0.260 (9.4) 0.404E-2 (0.2) -0.168E-1 (5.9) 0.2974
Depth = 1 5.5 8.0 -0.2 -0.202
(2.4) -0.298 (5.0) 0.964E-2 (0.3) -0.370E-1 (5.6) 0.4596
The values of time obtained are broadly similar until the depth of ranking is reduced to four; there are, though, problems with the coefficient on in-vehicle time which immediately becomes insignificant and eventually wrong-sign. Further, the increase in rho-squre is very slight until the depth of ranking is reduced to three, at which point the coefficient estimates are much less significant. Since the tradeoff is a fairly large reduction in t-statistics with the benefit of only a small increase in rho-squre, and since the IVT coeffienct quickly becomes insignificant, we feel justified in exploding the data to full depth in the remainder of this report.
2.5 Non-linearities in the values of time.
6
because the design of the experiment, with time entering at only three levels (2, 4 and 8 minutes for WALK, 1, 5 and 10 minute WAIT and 10, 15 and 20 minutes for IVT), induced chronic multicollinearity due to the high correlation between each time variable and its square. Multicollinearity causes the parameter estimates and their standard errors to become unreliable and volatile; for WALK and IVT, the multicollinearity also caused the parameter estimates to become insignificant, for WAIT the significance was much reduced, although WAIT2 also had a significant result. In this last case, the model calibrated was:
UTILITY = -0.1973WALK -0.1735WAIT -0.709IE-2WAIT2 -0.1502E-IIVT -07621E-2COST (12.8) (4.0) (1.9) (1.7) (6.1)
rho square = 0.1847
The sign on WAIT2 indicates increasing marginal disutility of waiting time, so that the values of time increase as waiting time increases.
Table 4: value of waiting time at different levels
Waiting time Value of time
0 22.8
1 24.6
5 30.1
10 41.4
Since the model has serious econometric problems, we are unable to place too much faith in the accuracy of the results; we therefore attempted the segmentation approach outlined below.
In the experimental design, each time variable entered at three levels, which we might call low, medium and high.
We construct two composite variables
WAIT 1 = waiting time if waiting time = 1 or 5 minutes, 0 otherwise WAIT 2 = waiting time if waiting time = 10 minutes, 0 otherwise
if we are dealing with WAIT, and similarly for WALK and IVT. Another grouping is to isolate the low value and combine the medium and high values. It is then possible to check whether the coefficients on WAIT 1 and WAIT 2 are the same; if they are, it suggests a constant marginal disutility of time.
7
between time variables and their squares, the results are again of dubious reliability. In any event, the standard errors were so large that no significant differences between the levels of the segmented variables could have been found even if the parameter estimates had been independent. From all this, we conclude that there is no evidence in these data to support anything other than a constant marginal disutility of time.
2.6 Socio-economic effects.
In this section, we examine the effects of factors such as age, gender and income on peoples' values of time. We also look at the effects of trip purpose and frequency of use. In the past (Toner, 1990b), we have found people travelling to or from work had higher values of time, as did people with incomes in excess of £15,000, but relatively few other differences. Throughout this section, the analysis has been undertaken using dummy variables to segment the sample. These were then used to estimate separate cost coefficients for each segment. The significance levels reported refer to these cost coefficients and not the significance of the value of time, although in practice, given highly significant coefficents on WALK and WAIT, it is the significance of the cost coefficient which determines the significance of the value of time. A significance level of 0.1% indicates significance at at least 0.1%.
2.6.1 Age
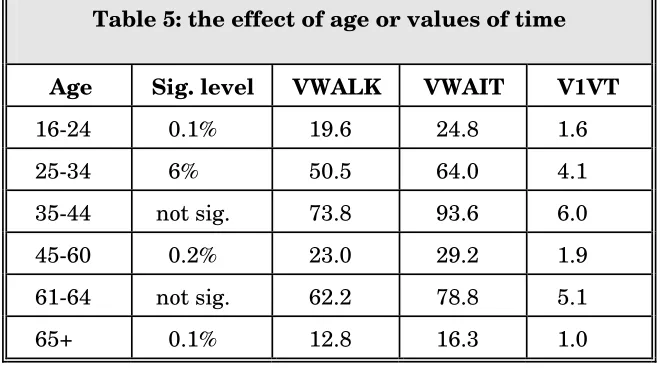
[image:12.595.133.463.400.584.2]As table 5 below shows, the main influence of age is a higher set of values of time for those aged 25-34 and lower value for those aged 65 or more.
Table 5: the effect of age or values of time
Age Sig. level VWALK VWAIT V1VT
16-24 0.1% 19.6 24.8 1.6
25-34 6% 50.5 64.0 4.1
35-44 not sig. 73.8 93.6 6.0
45-60 0.2% 23.0 29.2 1.9
61-64 not sig. 62.2 78.8 5.1
65+ 0.1% 12.8 16.3 1.0
The cost coefficients for the 25-34 group and one 65 group are significantly different; no other pair are so. Other studies (Toner, 1990b) have shown that by and large taxi users are under 35 years old, and relatively few over 65's travel by taxi. A high value of time for the former group and a low value of time for the latter group lend support to this finding, other things being equal.
2.6.2 Gender
8 t=1.02
Table 6: The effects of gender on values of time
Gender sig. level VWALK VWAIT VIVT
M 0.2% 34.0 43.4 2.7
F 0.1% 23.3 29.7 1.9
2.6.3 Income
The respondents were asked to tell us in which income group (out of five) they belonged. It is clear that the sample splits around the £10,000 income level; those earning less than this had low values of time, those above high values. In fact, there is no difference statistically between the first two cost coefficients and none between the last three.
[image:13.595.124.471.407.572.2]However the last three are all significantly smaller than the first two (at least 5% level, 1TT) implying higher values of time than each of the first two coefficients.
Table 7: The effect of income on and values of time
Income sig. level VWALK VWAIT VIVT
under £5,000 0.1% 16.4 20.9 1.3
£5,001-£10,0000 0.1% 15.3 19.5 1.2
£10,001-£20,000 3% 46.8 59.5 3.6
£20,001-£30,000 8% 40.8 52.0 3.1
One £30,000 11% 53.6 68.2 4.1
The reduction in size and significance of the cost coefficient as income rises also suggests the cost is less important to richer people than to poorer people.
2.6.4 Nature of residence.