Article:
McGonigle, A.J.S. (2005) Volcano remote sensing with ground-based spectroscopy.
Philosophical Transactions of the Royal Society A: Mathematical, Physical and
Engineering Sciences, 363 (1837). pp. 2915-2929. ISSN 1471-2962
https://doi.org/10.1098/rsta.2005.1668
[email protected] https://eprints.whiterose.ac.uk/ Reuse
Unless indicated otherwise, fulltext items are protected by copyright with all rights reserved. The copyright exception in section 29 of the Copyright, Designs and Patents Act 1988 allows the making of a single copy solely for the purpose of non-commercial research or private study within the limits of fair dealing. The publisher or other rights-holder may allow further reproduction and re-use of this version - refer to the White Rose Research Online record for this item. Where records identify the publisher as the copyright holder, users can verify any specific terms of use on the publisher’s website.
Takedown
If you consider content in White Rose Research Online to be in breach of UK law, please notify us by
Volcano remote sensing with ground-based
spectroscopy
BY ANDREW J. S. MCGONIGLE
Department of Geography, University of Sheffield, Winter Street, Sheffield S10 2TN, UK
The chemical compositions and emission rates of volcanic gases carry important information about underground magmatic and hydrothermal conditions, with appli-cation in eruption forecasting. Volcanic plumes are also studied because of their impacts upon the atmosphere, climate and human health. Remote sensing techniques are being increasingly used in this field because they provide real-time data and can be applied at safe distances from the target, even throughout violent eruptive episodes. However, notwithstanding the many scientific insights into volcanic behaviour already achieved with these approaches, technological limitations have placed firm restrictions upon the utility of the acquired data. For instance, volcanic SO2emission rate measurements are
typically inaccurate (errors can be greater than 100%) and have poor time resolution (ca once per week). Volcanic gas geochemistry is currently being revolutionized by the recent implementation of a new generation of remote sensing tools, which are overcoming the above limitations and are providing degassing data of unprecedented quality. In this article, I review this field at this exciting point of transition, covering the techniques used and the insights thereby obtained, and I speculate upon the breakthroughs that are now tantalizingly close.
Keywords: volcanology; remote sensing; spectroscopy
1. Introduction
In June 1991, Mt Pinatubo in the Philippines exploded violently, propelling material some 35 km high into the stratosphere (e.g. Newhall et al. 2002). This was the world’s largest eruption in 80 years and ten times greater than Mt St Helens. Yet, in spite of the enormous loss of life that could have followed, it is estimated that only a few hundred people died as a result. In what is regarded to be the most successful volcanic-hazard mitigation in history, some 80 000 people were safely evacuated shortly before the beginning of this eruption, saving many thousands of lives. Scientists had been carefully monitoring the volcano’s behaviour, since activity commenced some months previously, and correctly forecasted this climax to the eruption. One of their key lines of evidence was a rapid tenfold increase in the volcano’s SO2 emission rate (flux), observed with
ground-based spectroscopy (Daag et al. 1996).
Published online20 October 2005
Volcanoes emit gases to the atmosphere both during and between eruptions. These can be exsolved from magma and released through major craters and vents: the so-called primary emissions (seefigure 1), which are the focus of most remotely sensed volcanic gas observations. Additionally, volcanoes may release fluids from, or interact with, groundwaters (hydrothermal systems; Symonds
et al. 1994), and gases can be diffusely emitted through volcanic flanks. The most abundant chemical species in volcanic plumes are H2O and CO2, and other
significant components include SO2, HCl, HF and H2S. These gases carry
important information about underground conditions such as magmatic composition, volume, transport and degassing dynamics. As such, gas chemical composition and flux are routinely measured at a number of volcanoes worldwide to provide fundamental scientific insights. As the concentration of gas in magma and the dynamics of its escape to the atmosphere are arguably the primary drivers of volcanic activity, strongly influencing whether an eruption is explosive or effusive and triggering rapid switches between these regimes (Sparks 2003), these data are also valuable for forecasting eruptions.
Volcanic gases have important impacts upon the atmosphere and climate (Robock 2000), which must be correctly accounted for in climate change models. In particular, volcanic SO2 is converted to radiatively active sulphate aerosol,
which reflects sunlight back to space (Grafet al. 1997). Some scientists think this effect may have been responsible for prehistoric mass extinction events. More recently, aerosol from the Mt Pinatubo eruption cooled the troposphere, entirely offsetting the anthropogenic greenhouse effect for a limited duration. This eruption also caused stratospheric heating, an alteration in global stratospheric circulation patterns and an approximately 20% reduction in Antarctic ozone levels (McCormick et al. 1995).
A third motivation for interest in these emissions is the serious environmental and medical impacts they can have (Delmelle et al. 2002). For instance, at Masaya volcano, Nicaragua, atmospheric SO2concentrations are elevated over a
[image:3.493.62.424.61.194.2]downwind area greater than 1000 km2, resulting in loss of revenues from coffee plantations and exposing approximately 50 000 people to levels exceeding World Health Organization air quality standards. One of the world’s worst environmental disasters was precipitated by the 1783–1784 eruption of Laki in Iceland, which released over a hundred million tonnes of SO2 (Thordarson et al.
1996). This gas formed a blanket of haze that covered much of Europe, causing destruction of agricultural crops, contamination of pasture and human morbidity and mortality. Benjamin Franklin, then acting as ambassador to France, was one of the first to note the correlation between this volcanic pollution and the anomalously cold weather experienced in Europe and North America at that time.
The conventional method of measuring volcanic gases is to collect a gas sample directly, then transport it to the laboratory for subsequent analysis. Collection methodologies include bubbling gases from vents through alkaline solutions or pumping the gases through base-treated filters, which act as acid traps (Symonds
et al. 1994). While direct sampling is the most detailed and accurate source of degassing data, this approach suffers a number of limitations: first, routine surveillance may be difficult or impossible owing to the risks involved, which can restrict observations to low-temperature vents that are not representative of the volcano as a whole; second, the samples’ chemical compositions may be altered in storage; and third, analysis may involve delays (during volcanic crises data are often required immediately). In comparison, the geophysical techniques used to monitor volcanoes: seismology and geodesy (ground-deformation measurements), enable data to be acquired each second or so from autonomous installed units. While there have been a few efforts to obtain high time resolution continuous geochemical data by direct sampling, for instance using electrochemical sensors, this approach is not yet widespread.
Over the last 30 years, ground-based remote sensing techniques have been increasingly used for volcanic plume measurements, significantly broadening the surveillance capability of volcanic gas geochemistry. The primary advantage of these approaches is safety, as monitoring can take place multiple kilometres from the targets, allowing, in principle, the acquired data to resemble more closely seismic and geodetic data, in respect of continuous monitoring (particularly throughout violent eruptive phases), high time resolution (seconds to minutes) and near-real-time data evaluation. Remote sensing is also non-invasive, thereby avoiding sample-contamination issues; it involves integrated measurements across the whole plume, thus capturing the volcano’s bulk degassing behaviour, and it can provide fluxes, which are difficult to extrapolate from directly sampled data.
Spectroscopic plume observations can also be made from space. This began rather serendipitously, when an anomalously high ‘ozone’ signal was observed over Mexico by the Total Ozone Mapping Spectrometer, following the 1982 eruption of El Chicho´n. It was soon recognized that this corresponded to absorption of ultraviolet (UV) radiation by volcanic SO2 (Krueger 1983), and
satellite sensors have been used for volcanic plume monitoring ever since (e.g.
Bluth et al. 1993). However, in view of the inferior spatial and temporal resolution of these instruments, and their higher detection limits relative to ground-based remote sensing devices, they are of limited value in eruption monitoring at present. Rather, their primary utility is in measuring SO2burdens
exciting future prospect will be increased synchronous applications of space-borne and ground-based volcano remote sensing.
In this article, I outline the two most applied ground-based volcanic plume remote sensing techniques: UV and Fourier transform infrared (FTIR) spectroscopy. A description of some of the observations made, and volcanological insights gleaned, will then be presented, culminating in a discussion of future research prospects.
2. Methodologies
(a) Generic background
The techniques described here are based upon measurements of the spectra of electromagnetic radiation that has been attenuated by passing through a volcanic plume (figure 2). Depending upon the methodology used and the volcano studied, the radiation source may be natural, e.g. direct sunlight, scattered skylight, hot rocks or active lava bodies, or artificial, e.g. a lamp. As each of the volcanic gas species has a unique molecular structure, they have characteristic absorption features, e.g. a particular wavelength will be attenuated to a different extent by each gas present. Therefore, by examining an appropriate spectral window, the presence of these species can be inferred from the distinctive ‘bar-code’ spectral imprints they impress upon the incident radiation. This principle is used to determine gas concentrations quantitatively, using the Beer–Lambert Law:
IðlÞZI0ðlÞexp½KsðlÞNL:
I(l) andI0(l) are the intensities of the radiation measured by the instrument at wavelength l, when the plume is present and absent from the optical path, respectively; s(l) is the absorption cross-section of the absorbing molecule, a quantitative measure of how strongly it attenuates light. The product of the mean concentration of the attenuating species (N) and the width (L) of the plume viewed (the column amount) can thus be found. In practice, these are
detector light source attenuating volcanic
gas plume
l
I
l source
spectrum
detected spectrum absorption
[image:5.493.129.354.62.205.2]I0
Figure 2. Transmission of radiation (in this case from an artificial lamp) through a volcanic plume, before detection by a spectrometer. The emitted source spectrumI0(l) and the measured spectrum
simultaneously obtained for all volcanic species of interest, using computational fitting routines, which scale s(l) for each gas, across a spectral window.
(b) Ultraviolet spectroscopy
The most commonly used ground-based volcanic plume remote sensing technique is UV spectroscopic measurement of volcanic SO2fluxes. Attention has
been focused on SO2 because of its strong UV absorption features, low
background atmospheric concentrations and relatively high plume abundances: typically it is the third most ubiquitous species, behind H2O and CO2. In
contrast, it is extremely difficult to sense volcanic H2O and CO2 remotely
because of their high ambient concentrations. SO2flux measurements have been
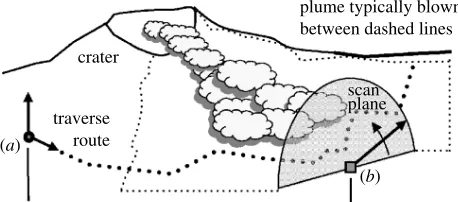
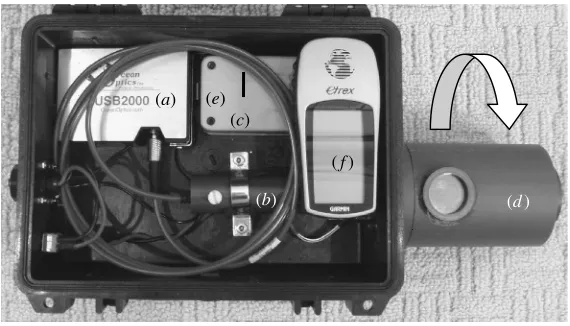
made for 30 years with correlation spectrometers (e.g.Stoiberet al. 1983), which were recently upgraded with laptop PC controlled USB-powered spectrometers (in particular Ocean Optics Inc. USB2000s; McGonigle et al. 2002; Galleet al. 2003), which are considerably smaller, lighter, cheaper and less power consuming. During flux measurements, the USB2000 is optical fibre coupled to a vertically pointing telescope, then the plume is traversed from below, by foot, boat, aircraft or road vehicle, and overhead scattered skylight spectra are continuously acquired and saved, as are positional data from a handheld GPS receiver (figure 3a).
The spectra are then processed to determine overhead SO2 column amounts.
First, all spectra collected underneath the plume are divided by a spectrum acquired outside it, according to the Beer–Lambert law, thereby isolating the attenuation of the skylight UV radiation by the plume. As a slight departure from the generic methodology outlined above, the resulting spectra are then high-pass filtered, before being fitted with the SO2absorption cross-section, itself identically
filtered. This methodology, termed differential optical absorption spectroscopy, removes the possible interference of spectrally broadband attenuation from the plume aerosols. The GPS data are then used to resolve the component of motion perpendicular to the plume transport direction, corresponding to each spectrum acquired underneath the plume; a cross-sectional profile of the plume SO2column
amounts is thus generated. By integrating across this, then multiplying by the plume transport speed, the SO2flux value is obtained.
While most measurements are made by manually traversing the plume (data typically have a time resolution of a few days and are often sustained only for the
scan plane crater
plume typically blown between dashed lines
[image:6.493.135.364.63.164.2]traverse route
Figure 3. Configurations for making UV SO2flux measurements by (a) traversing underneath the
duration of a field campaign, e.g. one to two months), a new monitoring configuration, based on scanning the plume from below with a USB2000, has recently been developed (Edmondset al. 2003a;McGonigleet al. 2003;figures 3b
and 4). With knowledge of the plume’s height, which can be determined, for instance by tomographic analysis of the plume profiles observed with two or more scanners, fluxes can be computed in a similar manner to the traverse case. Such a system was automated at the Soufrie`re Hills volcano, Montserrat, and has been collecting data autonomously since 2002. This is an outstanding example of the value added to volcanological monitoring by rapid capitalization upon new technological opportunities (Edmonds et al. 2003a).
While SO2fluxes are the most ubiquitous of all ground-based remotely sensed
volcanic data, and have provided many valuable scientific insights, they are limited in their utility by large errors (potentially greater than 100%). These primarily originate in the standard practice of using readings from ground-based anemometers as proxies for wind speeds at the plume altitude, typically hundreds of metres above the surface. In addition, the SO2flux measurements use scattered
skylight, and, while this makes alignment trivial, the flux calculation relies upon the somewhat naı¨ve assumption that the collected light has been scattered into the spectrometer’s field of view from above the plume and has thence travelled in a straight vertical line downwards. In reality, the sampled radiation can be scattered above, within (perhaps multiple times from aerosols) and/or below the plume; there has yet to be a rigorous characterization of errors arising from this.
(c) Fourier transform infrared spectroscopy
FTIR spectrometers, operating in the near- to mid-infrared wavelength range, are capable of measuring column amounts of gases such as HCl, H2O, SO2, HF,
CO2, SiF4, OCS and CO in volcanic plumes (e.g.Notsuet al. 1993;Franciset al. (a)
(c)
(b) (e)
(f)
[image:7.493.100.385.59.222.2](d)
Figure 4. Device for automated scanning SO2 flux measurements. Skylight is coupled into the
1998). With the miniaturization of FTIR spectrometers for military applications, commercial field-portable devices became available in the 1990s. In many cases, SO2 flux data are open to highly divergent explanations; interpretation can be
clarified with FTIR-derived multiple gas column amount data, because of the species’ different physico-chemical properties. Each acquired FTIR spectrum is analysed by using a radiative transfer model to generate a synthetic spectrum, which simulates the absorption along the optical path length by those atmospheric and volcanic species present. By iteratively varying the latter column amounts until the best fit to the observed spectrum is achieved, the plume composition is determined.
A variety of radiation sources can be used with FTIR spectroscopy: direct sunlight, artificial lamps, hot rocks or active lava bodies. While this provides design flexibility and avoids the scattering problems of the UV skylight measurements, alignment in the latter case is, generally, more straightforward. Likewise, FTIR spectrometers are considerably bulkier and more expensive than the USB2000s, and the retrievals are more complex. For these reasons, this approach has not yet become as widespread as UV spectroscopy among volcanologists. Correlation spectroscopy has also been used, albeit to a far lesser extent than FTIR spectroscopy, for remotely sensing multiple volcanic gas species concentrations.
3. Observations
UV spectroscopy was initially applied in a volcanological context to determine whether observed SO2 fluxes correlate with changes in activity. The simplest
mechanism proposed to affect these rates in advance of an eruption is magma rising to shallow depths, where pressures are insufficient to confine the dissolved gases, such that they exsolve and escape to the atmosphere. This interpretation has been ascribed to the behaviour of a number of volcanic events in the past, such as the increase in flux observed before the 1991 Mt Pinatubo eruption (Daag
et al. 1996). Likewise, increasing SO2 emissions from Mt Etna have been noted
prior to a number of eruptions (Caltabiano et al. 1994).
While predicting the onset of eruptions is a vital task for volcanologists, identifying the end or decline of activity can be equally important, informing resettlement strategies for surrounding areas. Remotely sensed data can also provide useful insights here. For instance, spectroscopic measurements following the cataclysmic 1980 eruption of Mt St Helens revealed a general exponential decline in SO2flux over the following 8 years (McGee 1992), suggesting a gradual
cessation of activity, as the intruded magma, responsible for the main explosion, was steadily losing its dissolved gases and not being recharged. Smaller eruptions during this period were preceded by elevated SO2 fluxes, indicating intermittent
phases of rising magma (McGee & Sutton 1994).
During eruptions volcanic SO2 fluxes are elevated as gas is erupted with lava
chambers, has been proposed to account for such behaviour (Wallace 2001). SO2 flux measurements are relatively straightforward to interpret where the
gases are free to escape to the atmosphere. However, in many cases the situation is more complicated, e.g. the magmatic gases might bubble through a hydrothermal system, which dissolves each species to a different extent, or fracture networks above the magma chamber can seal, inhibiting gas escape. For these reasons, SO2 flux data alone have been less successful when applied to
predicting the vent-clearing cataclysmic explosions that often begin eruptions. For instance, prior to the eruption of Mt St Helens, and in spite of the presence of magma at shallow depth, measured SO2 fluxes were very low, owing to a rock
carapace, which severely restricted gas release.
The ongoing activity of the Soufrie`re Hills volcano has been monitored using both UV and FTIR spectroscopy. A degassing model has thus been developed, whereby the emissions are derived from two distinct sources: SO2is released from
a ‘mafic’ magma, intruded from depth into the chamber of an ‘andesite’ magma, itself rich in HCl (Edmonds et al. 2001,2003b). The latter magma is relatively viscous; therefore, when extruded through the volcano’s conduit, it forms a lava dome at the volcano summit, rather than the lava flows typical of other eruptive styles. These episodes are characterized by elevated HCl fluxes, with exsolution of this gas upon ascent; conversely, HCl fluxes are low when dome growth does not take place. In contrast, SO2 is emitted discontinuously, depending on the
permeability of the system. One proposed sealing mechanism is closure of interconnecting bubble networks in the andesite.
Activity at the Soufrie`re Hills volcano had apparently stopped during 1998, with cessation of dome growth and seismic signals; yet SO2 emissions did not
decline, but rather continued with higher rates than observed during previous phases of lava extrusion. This provided key evidence that the eruption was not over, and indeed activity was later resumed, highlighting the importance of remote sensing in this context. Gas-measurement-based criteria for identifying the end of this eruption have also been highlighted: persistently low HCl and SO2
fluxes would indicate that mafic charging of the magma chamber has ended, as has the resulting dome growth.
While FTIR spectroscopy is normally based upon monitoring volcanic gases’ absorption of radiation from a hotter background source,Loveet al. (1998)used FTIR spectroscopy to observe the plume’s emitted spectra, in contrast to that of the cold sky background. At Popocate´petl volcano, Mexico, they observed a steady increase in SiF4/SO2ratio over a few days prior to an explosive eruption
during February 1997, followed by a rapid tenfold decrease to the pre-eruptive value. Owing to temperature-dependent equilibration between the volcanic species present, this ratio is a proxy for gas temperature and indicated cooling prior to the eruption. The interpretation given was that the gases adiabatically expanded as the conduit plug began to give way in advance of the eruption.
Different gases have different pressure-dependent solubilities in magma, so the ratios of volcanic gas concentrations are also important indicators of the depth of exsolution from the melt. For instance, SO2 is removed at greater depths than
ratio implies shallower degassing. On occasions, volcanoes can manifest ‘lava fountaining’ behaviour, where gas jets propel lava fragments to heights of several hundred metres. However, whether this gas is exsolved during these episodes, or they are driven by a gas layer previously accumulated at depth, has been a matter of debate. FTIR spectroscopic observations of relatively high SO2/HCl
gas ratios for a lava fountain on Mt Etna during 2000 have clarified this matter by indicating the latter origin of gas in this case (Allardet al. 2005). Constraints upon exsolution depths have also been used to map the underground branched magmatic system, which feeds the active vents on Mt Etna (Burtonet al. 2003). Even greater scope for interpretation is provided by combining parallel geophysical and remotely sensed volcanic gas observations. Galeras volcano in Colombia has been the focus of considerable scientific attention, following a resurgence of activity in 1988. During this period, a number of explosive eruptions occurred, one of which resulted in the tragic deaths of six scientists and three tourists. Prior to such events reduced SO2fluxes were observed, in parallel
with increasing ‘long-period’ seismic signals, analogous to the resonances formed in organ pipes. In retrospect, this behaviour was interpreted to indicate sealing and pressurization of gas within the system, followed by explosive release (Stix
et al. 1993; Fischer et al. 1994). One proposed mechanism for this was precipitation of minerals, arising from a hydrothermal system, in gas pathways to the surface. In cases where hydrothermal interactions are suspected, FTIR spectroscopic data act as valuable adjuncts to UV spectroscopic SO2 fluxes in
clarifying interpretation, given the different water solubilities of the gases (e.g. HCl, SO2 and HF) accessible to the former approach (e.g.Symondset al. 2001).
The UV flux measurements, made at many targets worldwide, have been used to derive a total global volcanic SO2 emission of approximately 20 Mton yrK1
(e.g.Stoiberet al. 1987); from this the total fluxes of other volcanic species have been calculated. While this volcanic flux is only around one-fifth of the total anthropogenic release, sulphate loading of the atmosphere may be comparable from the two sources, as the former emitters are, generally, at higher altitudes, where aerosol lifetimes are longer. This is highly significant, as anthropogenic sulphate is presently considered to be the most important factor offsetting the anthropogenic greenhouse effect. Recently, USB2000s have been adapted for remotely sensed measurements of two other volcanogenic gases: NO2 and BrO
(Bobrowski et al. 2003). The former observation supports a recent report that volcanoes may have played a significant role in generating biologically available forms of nitrogen, via thermal fixation, during the evolution of the early Earth (Mather et al. 2004). The BrO data indicate that volcanoes may constitute a significant (yet hitherto largely overlooked) supply of bromine to the lower atmosphere, with potentially important impacts upon tropospheric ozone chemistry.
4. The future
realized: first, flux measurements have large errors (potentially greater than 100%), primarily owing to the anemometric proxies used for plume speeds; second, they normally have low time resolution (ca one week) and are typically sustained for a few months at most; and third, measurements of multiple species (often vital for accurate geochemical interpretation) are not widespread, owing to the complexity and expense of FTIR spectroscopy. For these reasons, while degassing is arguably the primary driver of volcanic activity, determining much observed seismicity and ground deformation, measurements of the latter phenomena are presently considered to be of greater utility in volcano monitoring.
The volcanological application of the USB spectrometers heralds a new era for volcanic gas geochemistry. Automated scanning versions of these devices have been developed over the last few years and enable acquisition of high time resolution (a few minutes) sustained SO2 fluxes. In addition, it has been
demonstrated very recently that accurate plume transport speeds can be measured using two vertically pointing USB2000s, located underneath the plume at different distances from the source (McGonigle et al. 2005; Williams-Jones
et al. in press). By cross-correlating the overhead SO2column amount time-series
from these devices, the time of transit of individual plume ‘parcels’ can be obtained, allowing accurate flux measurements (errors less than 10%). By combining these two approaches, truly unprecedented sustained flux data will become available, in respect of time resolution and accuracy. In addition to the gases already measured, the USB2000 shows potential for remote measurements of other volcanogenic species, such as ClO. While these devices are unlikely to replace FTIR spectroscopy as the standard remote sensing technique for multiple volcanic gas column amount measurements, at least not in the near future, they could prove to be a useful and relatively inexpensive adjunct in this regard.
As a proxy for eruptive activity, SO2suffers the disadvantage of being readily
removed by hydrothermal systems. CO2, which exsolves from magma deeper,
and is comparatively water insoluble, is a far more useful magmatic tracer. Unfortunately, it is notoriously difficult to measure volcanic CO2 using remote
sensing, owing to its high ambient concentrations. While FTIR spectroscopic observation of this species has been achieved in volcanic plumes (Burton et al. 2000), this has been performed only with an artificial lamp source, a configuration that is not widely applicable and requires relatively close access to the source. A number of research groups have tried, without success to date, to develop instruments for spectroscopic CO2 measurements, using scattered
skylight as the radiation source. One possible solution is pressure modulation radiometry, which measures vertically resolved gas profiles and may be able to spatially filter out much of the background CO2 signal. While LIDAR are
capable of making volcanic CO2 flux measurements, these devices are power
consuming and not field portable at present. A new radiometric technique for monitoring H2O fluxes has recently been developed and applied at a number of
Japanese volcanoes.
O’Dwyeret al. (2003)have measured SO2/H2S ratios with a USB spectrometer
fumarolic gas into an optical cell. With ruggedization, the latter configuration shows potential for sustained autonomous operation; and by adding further spectrometer channels it could potentially monitor HCl, CO2 and H2O, in
addition. More complex variations of this, based on laser spectroscopy, have been developed, which measure isotope ratios and are thus capable of providing additional geochemical information.
With the development and implementation of the above technologies, spectacular breakthroughs in volcanology are foreseen during the coming decade, in two particular ways. First, the great improvements in accuracy and time resolution of SO2flux time-series will enable rigorous corroboration of degassing
data with geophysical datasets (seismic, geodetic, thermal and acoustic). Such inter-parametric analyses were hindered by the poor degassing data previously available, yet are a key to increasing our volcanological understanding, given growing evidence for the interconnectedness of these phenomena (e.g. Watson
et al. 2000). Second, these technological improvements will allow the first detailed flux-data-based testing and parameterization of numerical volcanic conduit models (e.g.Melnik & Sparks 1999). The gas data will thus progress from being primarily a useful means of cataloguing volcanic behaviour in retrospect to playing a more vital role in forecasting eruptions, thereby attaining a status more commensurate with the great importance of degassing in driving volcanic activity.
While our understanding of the effects of plumes from explosive eruptions upon the stratosphere is relatively advanced, less is known about the impacts of smaller plumes upon the troposphere. With better and more widely distributed ground-based remote sensing technologies, in parallel with novel satellite sensors, this situation will improve as global volcanic fluxes become better constrained, both spatially and temporally. Further investigations into the conversion of SO2
to sulphate aerosol will provide additional insights here; however, it remains to be seen whether USB2000 observations alone can provide sufficient accuracy to
deuterium bulb
spectrometer
[image:12.493.138.365.60.241.2]fumarolic emission
Figure 5. Spectroscopic measurements of H2S/SO2ratios, using a USB spectrometer and deuterium
forecasting has never been so important.
The author is supported by a NERC post-doctoral fellowship. Pierre Delmelle and David Pyle are thanked for their conscientious reviews, which have greatly improved the quality of this paper.
References
Allard, P., Burton, M. & Mure´, P. 2005 Spectroscopic evidence for a lava fountain driven by previously accumulated magmatic gas.Nature433, 407–410. (doi:10.1038/nature03246.) Bluth, G. J. S., Schnetzler, C. C., Kreuger, A. J. & Walter, L. S. 1993 The contribution of explosive
volcanism to global atmospheric sulfur-dioxide concentrations. Nature 366, 327–329. (doi:10. 1038/366327a0.)
Bobrowski, N., Ho¨nninger, G., Galle, B. & Platt, U. 2003 Detection of bromine monoxide in a volcanic plume.Nature423, 273–276. (doi:10.1038/nature01625.)
Burton, M. R., Oppenheimer, C., Horrocks, L. A. & Francis, P. W. 2000 Remote sensing of CO2
and H2O emission rates from Masaya volcano, Nicaragua.Geology28, 915–918. (doi:10.1130/
0091-7613(2000)028!0915:RSOCAHO2.3.CO;2.)
Burton, M. R., Allard, P., Mure´, P. & Oppenheimer, C. 2003 FTIR remote sensing of fractional magma degassing and Mount Etna, Sicily. InVolcanic degassing(ed. C. Oppenheimer, D. M. Pyle & J. Barclay), pp. 281–293. London: The Geological Society.
Caltabiano, T., Romano, R. & Budetta, G. 1994 SO2flux measurements at Mount Etna (Sicily).
J. Geophys. Res.99, 12 809–12 819. (doi:10.1029/94JD00224.)
Carn, S. A. & Bluth, G. J. S. 2003 Prodigious sulfur dioxide emissions from Nyamuragira volcano, DR Congo.Geophys. Res. Lett.30, 2211. (doi:10.1029/2003GL018465.)
Carn, S. A., Strow, L. L., de Souza-Machado, S., Edmonds, Y. & Hannon, S. 2005 Quantifying tropospheric volcanic emissions with AIRS: the 2002 eruption of Mt Etna (Italy).Geophys. Res. Lett.32, L02301. (doi:10.1029/2004GL021034.)
Daag, A. S.et al. 1996 Monitoring sulfur dioxide emission at Mount Pinatubo. InFire and mud: eruptions and lahars of Mount Pinatubo Philippines(ed. C. G. Newhall & R. S. Punongbayan), pp. 409–414. Seattle: University of Washington Press.
Delmelle, P., Stix, J., Baxter, P. J., Garcia-Alvarez, J. & Barquero, J. 2002 Atmospheric dispersion, environmental effects and potential health hazard associated with the low-altitude gas plume of Masaya volcano, Nicaragua.Bull. Volcanol.64, 423–434. ( doi:10.1007/s00445-002-0221-6.)
Edmonds, M., Pyle, D. & Oppenheimer, C. 2001 A model for degassing at the Soufrie`re Hills Volcano, Montserrat, West Indies, based on geochemical data. Earth Planet. Sci. Lett.186, 159–173. (doi:10.1016/S0012-821X(01)00242-4.)
Edmonds, M., Herd, R. A., Galle, B. & Oppenheimer, C. M. 2003a Automated, high time-resolution measurements of SO2flux at Soufrie`re Hills Volcano, Montserrat.Bull. Volcanol.65,
578–586. (doi:10.1007/s00445-003-0286-x.)
Edmonds, M., Oppenheimer, C., Pyle, D. M., Herd, R. A. & Thompson, G. 2003bSO2emissions
from Soufrie`re Hills volcano and their relationship to conduit permeability, hydrothermal interaction and degassing regime.J. Volcanol. Geotherm. Res.124, 23–43. ( doi:10.1016/S0377-0273(03)00041-6.)
Fischer, T. P., Morrissey, M. M., Calvache, M. L., Gomez, D., Torres, R., Stix, J. & Williams, S. N. 1994 Correlations between SO2flux and long-period seismicity at Galeras Volcano.Nature 368, 135–137. (doi:10.1038/368135a0.)
Galle, B., Oppenheimer, C., Geyer, A., McGonigle, A. J. S., Edmonds, M. & Horrocks, L. A. 2003 A miniaturised UV spectrometer for remote sensing of SO2 fluxes: a new tool for volcano
surveillance.J. Volcanol. Geotherm. Res.119, 241–254. (doi:10.1016/S0377-0273(02)00356-6.) Graf, H. F., Feichter, J. & Langmann, B. 1997 Volcanic sulfur emissions: estimates of source strength and its contribution to the global sulphate distribution. J. Geophys. Res. 102, 10 727–10 738. (doi:10.1029/96JD03265.)
Kazahaya, K., Shinohara, H., Uto, K., Odai, M., Nakahori, Y., Mori, H., Iino, H., Miyashita, M. & Hirabayashi, J. 2004 Gigantic SO2emission from Miyakejima volcano, Japan, caused by caldera
collapse.Geology32, 425–428. (doi:10.1130/G20399.1.)
Krueger, A. J. 1983 Sighting of El-Chicho´n sulphur-dioxide clouds with the Nimbus-7 total ozone mapping spectrometer.Science220, 1377–1379.
Love, S. P., Goff, F., Counce, D., Siebe, C. & Delgado, H. 1998 Passive infrared spectroscopy of the eruption plume at Popocate´petl volcano, Mexico.Nature396, 563–567. (doi:10.1038/25109.) Mather, T. A., Pyle, D. M. & Allen, A. G. 2004 Volcanic source for fixed nitrogen in the early
Earth’s atmosphere.Geology32, 905–908. (doi:10.1130/G20679.1.)
McCormick, M. P., Thomason, L. W. & Trepte, C. R. 1995 Atmospheric effects of the Mt Pinatubo eruption.Nature373, 399–404. (doi:10.1038/373399a0.)
McGee, K. A. 1992 The structure, dynamics and chemical composition of non-eruptive plumes from Mt St. Helens, 1980–1988.J. Volcanol. Geotherm. Res.51, 269–282. ( doi:10.1016/0377-0273(92)90127-Y.)
McGee, K. A. & Sutton, A. 1994 Eruptive activity at Mount-St-Helens, Washington, USA, 1984–1988—a gas geochemistry perspective. Bull. Volcanol. 56, 435–446. (doi:10.1007/ s004450050053.)
McGonigle, A. J. S., Oppenheimer, C., Galle, B., Mather, T. A. & Pyle, D. M. 2002 Walking traverse and scanning DOAS measurements of volcanic gas emission rates.Geophys. Res. Lett.
29, 1985. (doi:10.1029/2002GL015827.)
McGonigle, A. J. S., Oppenheimer, C., Galle, B., Edmonds, M., Caltabiano, T., Salerno, G., Burton, M. & Mather, T. A. 2003 Volcanic sulphur dioxide flux measurements at Etna, Vulcano and Stromboli obtained using an automated scanning static ultraviolet spectrometer.
J. Geophys. Res.108, 2455. (doi:10.1029/2002JB002261.)
McGonigle, A. J. S., Inguaggiato, S., Aiuppa, A., Hayes, A. R. & Oppenheimer, C. 2005 Accurate measurement of volcanic SO2flux: determination of plume transport speed and integrated SO2
concentration with a single device.Geochem. Geophys. Geosyst.6, Q02003.
Melnik, O. & Sparks, R. S. J. 1999 Nonlinear dynamics of lava dome extrusion.Nature402, 37–41. (doi:10.1038/46950.)
Newhall, C. G., Power, J. A. & Punongbayan, R. S. 2002 Pinatubo eruption—‘To make grow’.
Science295, 1241–1242. (doi:10.1126/science.1069838.)
Notsu, K., Mori, T., Igarashi, G., Tohjima, Y. & Wakita, H. 1993 Infrared spectral radiometer: a new tool for remote measurement of SO2of volcanic gas.Geochem. J.27, 361–366.
O’Dwyer, M., McGonigle, A. J. S., Padgett, M. J., Oppenheimer, C. & Inguaggiato, S. 2003 Real time measurements of volcanic H2S/SO2ratios by UV spectroscopy. Geophys. Res. Lett. 30,
1652. (doi:10.1029/2003GL017246.)
Robock, A. 2000 Volcanic eruptions and climate. Rev. Geophys. 38, 191–219. (doi:10.1029/ 1998RG000054.)
Sparks, R. S. J. 2003 Dynamics of magma degassing. InVolcanic degassing(ed. C. Oppenheimer, D. M. Pyle & J. Barclay), pp. 5–22. London: The Geological Society.
Stix, J. et al. 1993 A model of degassing at Galeras volcano, Colombia, 1988–1993.Geology 21, 963–967. (doi:10.1130/0091-7613(1993)021!0963:AMODAGO2.3.CO;2.)
Stoiber, R. E., Malinconico, L. L. & Williams, S. N. 1983 Use of the correlation spectrometer at volcanoes. In Forecasting volcanic events (ed. H. Tazieff & J. C. Sabroux), pp. 425–444. Amsterdam: Elsevier.
volcano monitoring. J. Volcanol. Geotherm. Res. 108, 303–341. ( doi:10.1016/S0377-0273(00)00292-4.)
Thordarson, T., Self, S., Oskarsson, N. & Hulsebosch, T. 1996 Sulfur, chlorine and fluorine degassing and atmospheric loading by the 1783–1784 AD Laki (Skaftar fires) eruption in Iceland.Bull. Volcanol.58, 205–225. (doi:10.1007/s004450050136.)
Wallace, P. J. 2001 Volcanic SO2emissions and the abundance and distribution of exsolved gas in
magma bodies.J. Volcanol. Geotherm. Res.108, 85–106. (doi:10.1016/S0377-0273(00)00279-1.) Watson, I. M.et al. 2000 The relationship between degassing and deformation at Soufrie`re Hills volcano, Montserrat. J. Volcanol. Geotherm. Res. 98, 117–126. ( doi:10.1016/S0377-0273(99)00187-0.)
AUTHOR PROFILE
Andrew J. S. McGonigle