2017 2nd International Conference on Manufacturing Science and Information Engineering (ICMSIE 2017) ISBN: 978-1-60595-516-2
A Study on the Higher-order Waviness
Errors in Ball Bearings Based on
Vibration Experiments
Wentao Liu, Yun Zhang, Zhi-Jing Feng and Dongfeng Wang
ABSTRACT
This paper made a research on the higher-order waviness errors in ball bearings based on vibration experiments. Firstly, to find out the effects of higher-order waviness errors on the vibration of ball bearings, two groups of experiments have been done. In the first group, the inner race and outer race of test bearings had not been processed by superfinishing, while in the second group had been. The measurements of form errors showed that the higher-order waviness errors of the first group were much lower than those of the second group. Then, the vibration levels of the two groups were tested. The results indicated that the effects of higher-order waviness errors on vibration of ball bearings are prominent. Therefore, the higher-order waviness errors should be controlled strictly in the manufacturing processes of ball bearings. Further, to evaluate the higher-order waviness errors effectively, a new evaluation method was intended to be proposed in this paper. By comparing the waviness error excitation spectra of displacement, velocity and acceleration, it was revealed that the acceleration excitation spectrum is much more effective on distinguishing the magnitudes of higher-order waviness errors. Therefore, the acceleration excitation spectrum is proposed to evaluate the higher-order waviness errors.1
1Wentao Liu, Yun Zhang, Zhi-Jing Feng. Beijing Key Lab of Precision/Ultra-precision
Manufacturing Equiments and Control, Tsinghua University, Beijing 100084, P.R. China. Wentao Liu. Department of Mechanical Engineering, Jinan University, Jinan 250022, P. R. China. Dong Fang Wang,
INTRODUCTION
In the manufacturing processes of ball bearings, many form errors are generated inevitably, such as the roundness errors of inner-race, outer-race and balls, which
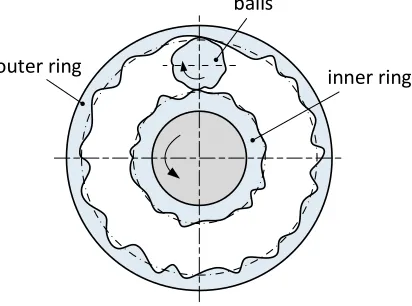
balls
[image:2.612.195.401.146.299.2]inner ring outer ring
Figure 1.The schematic diagram of form errors in rolling contacts in ball bearing.
can give rise to vibration of bearing directly in rolling contacts, as shown in Figure 1. Generally, the roundness errors are evaluated by waviness in mesoscale and macroscale, which can be obtained through Fourier decomposition.
The effects of waviness errors on vibration have been studied by many researchers by now. For example, Tallian and Gustafsson [1] analyzed the vibration frequencies generated by multi sets of special orders of waviness in 1965. Then Yhland [2] made a comparison between the theoretical and measured frequency spectra of waviness errors induced vibration. And Meyer et al. [3] pointed out that the waviness errors can generate sidebands around “normal” frequency tones due to interaction of waviness excitation between different surfaces. Wardle et al. [4-6] further summarized the principal and sideband frequencies of vibration resulted from waviness errors of inner-race, outer-race and balls based on dynamics analyses of rolling bearings. In addition, Walford et al. revealed the dynamic characteristic of the ball-race contacts by simulation in references [7-9]. Aini et al. stated that the bands of vibration frequencies are relevant to the ball passage frequency in reference [10], but the effects of waviness errors were not recognized.
between different parts’ surfaces in rolling contacts, especially for the higher-order waviness errors.
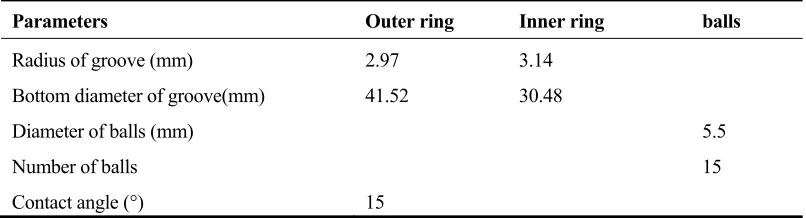
[image:3.612.96.499.212.321.2]To find out the effects of higher-order waviness errors on vibration of ball bearing, a set of experiments have been implemented in this paper. The primary dimension and geometrical parameters of ball bearings used in experiments are
TABLE 1. THE PRIMARY DIMENSION AND GEOMETRICAL PARAMTERSOF TEST BEARINGS.
Parameters Outer ring Inner ring balls
Radius of groove (mm) 2.97 3.14
Bottom diameter of groove(mm) 41.52 30.48
Diameter of balls (mm) 5.5
Number of balls 15
Contact angle (°) 15
listed in Table 1. In the experiments, the form errors of test bearing’s inner race and outer race were changed by superfinishing in manufacturing processes. Firstly, the waviness errors of inner race and outer race were measured before assembling of the bearings. Secondly, the vibration levels of bearings were tested at different regions of frequency. Thirdly, the influences of higher-order waviness errors on vibration were evaluated by comparing the waviness exciting frequencies and vibration frequencies according to the kinematic relations between the balls and rings of bearing. Lastly, to evaluate the higher-order waviness error components more effectively, a new method of evaluation for higher-order waviness errors was presented.
MEASUREMENT OF THE WAVINESS ERRORS OF INNER-RACE AND OUTER-RACE
are still exist in Figure 2(b). As the micro and mesoscale form errors are corresponding to the roughness and higher-order waviness errors respectively, and the macroscale form errors are corresponding to the lower-order waviness errors, it can be known that the magnitudes of roughness and higher-order waviness errors were reduced by superfinishing. Also, it can been seen from Figure 2 that the distributions of micro and mesoscale form errors are very irregular, so the higher-order waviness errors induced vibration should be very complex.
Figure 2. The measured form errors of one test bearing’s inner race: (a) before being processed by superfinishing; (b) after being processed by superfinishing.
COMPARISION OF BEARINGS’ VIBRATION LEVEL
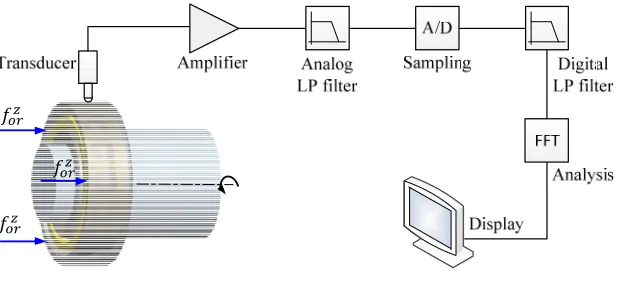
After assembling of the test ball bearings, their vibration levels were tested by the system in Figure 3. When the bearing’s inner ring were rotating with the shaft at the speed of 1500 rpm, a purely axial load of 100 N was applied to the outer ring, and the vibration of outer ring was picked up by an acceleration sensor.
To get the vibration characteristics of ball bearings in frequency domain, power spectral densities (PSD) of the vibration signals were estimated by applying Welch’s method. As an example, the typical distribution of PSD is as shown in Figure 4. It can be seen that most of the power of vibration distributed below 12 kHz, and the distribution can be divided into six zones, that is, A1~A6, corresponding to the frequency ranges of 1~500Hz,501~1600Hz, 1601~4200Hz,4201~9600Hz,9601 ~12000Hz, 12001~15000Hz respectively. The powers of vibration distributed in each zones can be obtained by
, 1, 2, , 6b i
a i
f
i yy
f f
P S f i
(1) (b)
(
m)
whereSyy
f represents the PSD of vibration, fiaand fib are the lower and upperboundaries of each frequency range.
[image:5.612.144.454.245.388.2]In order to find out the influence of higher-order waviness errors on vibration of ball bearing, two groups of vibration tests have been done. In the first group, the races of bearings’ inner ring and outer ring had not been processed by superfinishing, while in the other group the races had been processed. The average powers of vibration of the two groups distributed in the zones A1~A6 are shown in Table 2 respectively. By comparing, it can been known that the bearings’ vibration power
Figure 3. The test system of vibration of ball bearings.
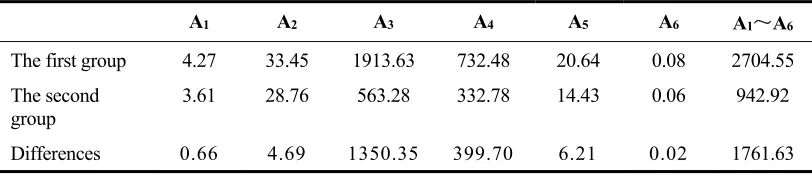
distributed in the zone A3 are the most, and secondly in the zone A4. Although the
main spectral peak in A3 is closely related to the resonance of sensor probe in
contact with the outer ring, it was excited by the vibration of test bearing actually, so it reflects the vibration level of test bearing indirectly in this frequency zone. In addition, it can be known from Table 2 that the main differences of vibration power between the two groups also lie in the zones A3 and A4, illustrating that the most
effects of form errors reduction by superfinishing on vibration are distributed in the two frequency zones.
According to the speeds of relative movement between different parts of ball bearing, the excitation frequencies of waviness errors can be calculated by
2or w c or
Figure 4. The typical PSD distribution of vibration signals of test bearings.
TABLE 2. THE AVERAGE POWERS OF VIBRATION DISTRIBUTED IN THE ZONES AL~
A6 OF THE TEST BEARINGS.(μW)
A1 A2 A3 A4 A5 A6 A1~A6
The first group 4.27 33.45 1913.63 732.48 20.64 0.08 2704.55
The second group
3.61 28.76 563.28 332.78 14.43 0.06 942.92
Differences 0.66 4.69 1350.35 399.70 6.21 0.02 1761.63
2ir w ir c
f n (3)
2b w b
f n
(4)
Where for, fir and fb represent the waviness excitation frequencies of
outer-race, inner-race and balls respectively;
or and
ir represent the angular velocitiesof out ring and inner ring;
c and
b represent the angular velocities of revolutionand rotation of balls; nw is the orders of waviness components.
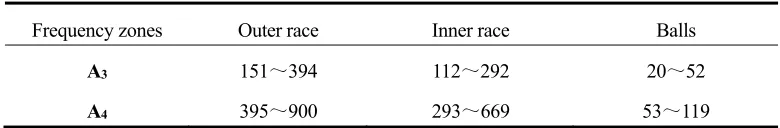
By equations (2)~(4), the orders of waviness error components corresponding to the frequency ranges of A3 and A4 can be obtained when ignoring the nonlinearity of the bearing system. The results are shown in Table 3. Note that the waviness orders of inner race and outer race corresponding to the two frequency ranges are much higher than those in the previous works[5, 15-17]. That is to say, it
2000 4000 6000 8000 10000 12000 14000 -13
-12 -11 -10 -9 -8 -7 -6 -5 -4
f ( Hz )
lo
g10
( S
yy
)
A6 A5
[image:6.612.94.500.325.414.2]is the higher-order waviness components that play an important role on the vibration of bearings. Therefore, the higher-order waviness errors should be paid more attention to and be controlled strictly in manufacturing processes of ball bearings. However, the higher-order waviness errors still lack an effective evaluation method by now, while the traditional methods are only effective for the lower-order waviness. For this problem, a new evaluation method for higher-order waviness errors is proposed in this paper.
TABLE 3. WAVINESS ORDERS CORRESPONDING TO THE FREQUENCY RANGES OF A3 AND A4.
Frequency zones Outer race Inner race Balls
A3 151~394 112~292 20~52
A4 395~900 293~669 53~119
EVALUATION OF HIGHER-ORDER WAVINESS ERRORS
As the waviness errors are one kind of form errors, their excitations for vibration are displacement excitations essentially, which can be described as
cos
n n n
w t A t (5)
Where An and n represent the magnitude and phase of the thn order of
waviness error components. By taking the derivation of both sides of the equation, one can get the velocity expression of excitation of waviness errors, that is,
sin
n n n
w t A n n t (6)
Then by taking derivation again, one can get the acceleration expression of excitation of waviness errors, that is,
2
cos
n n n
w t A n n t
(7)
Because the acceleration expression contains the coefficient
2n
2
8
8
2
12
x n t x n t x n t x n t
x n t (8)
22 16 30 16 2
12
x n t x n t x n x n t x n t
x n t (9)
Wheret denotes the equivalent sampling interval of waviness error excitation
signals. The value of tis equal to the reciprocal of equivalent sampling frequency,
which can be obtained by
2s
or cir c or
f N (10)
2s
ir cir ir c
f N (11)
2s
b cir b
f N (12)
where s or
f , firs and fbs denote the equivalent sampling frequencies of outer race,
inner race and balls respectively; Ncir represents the number of measured waviness error data per circle, and equals 1024 here. As an example, the waviness error excitation signals of displacement, velocity and acceleration of one test bearing’s outer race are as shown in Figure 5. By comparing, it can be seen that the magnitude of acceleration excitation signal is much larger than those of displacement and velocity excitation signals.
The frequency spectra of excitation signals of waviness error scan be obtained through fast Fourier transform (FFT), as plotted in Figure 6 (a), (c) and (e). To evaluate the higher-order waviness errors effectively, the average magnitudes of the spectra in different frequency zones were calculated by
1 ib
a i f b a f i i i f
A A f
f f
Figure 5. The excitation signals of one inner race’s waviness error: (a) displacement excitation signal; (b) velocity excitation signal; (c) acceleration excitation signal.
x (
m)
(a)
(c)
a (
m/
s
2 )
(b)
v (
m/
Frequency regions x Am (b) v Am s Frequency regions (d)
2 a Am s Frequency regions (f) Figure 6. The frequency spectra of waviness error excitation signals in Fig.5 and the average values of magnitudes in zones A1~A4 respectively: (a) displacement excitation spectrum; (b) average magnitudes of the displacement excitation spectrum; (c) velocity excitation spectrum; (d)average magnitudes of the velocity excitation spectrum; (e) acceleration excitation spectrum; (f) average magnitudes of the acceleration excitation spectrum.
In Equation (13), A f
denotes the magnitudes of spectra, andAi denotes theaverage magnitudes of the spectra in any one of the frequency zones A1~A6. As the number of measured data of waviness errors was 1024 per circle in the experiments, the maximum order of waviness errors was 512 according to Shannon’s sampling theorem. Because the maximum order is much lower than the
(e)
0 1000 2000 3000 4000 5000 -2 0 2 4 6 f (Hz) log 10 (Aa1 ) (c)
0 1000 2000 3000 4000 5000 -6 -4 -2 0 2 f (Hz) log 10 (A v1 )
orders corresponding to the frequency ranges of A5 and A6, the average magnitudes of the waviness error spectra in the two zones are ignored here. As a result, the average magnitudes in zones A1~A4 of the test bearings are as shown in Figure 6 (b), (d) and (f), in which the inner and outer races of the first group of bearings had not been processed by superfinishing, while the races of the second group had been processed. By comparing, it can be seen clearly that the differences of the average magnitudes in zone A1 between the two groups in Figure 6 (b) are much larger than those in Figure 6 (d) and (f), while the differences in the zones A3 and A4 between the two groups in Figure 6 (f) are more larger than those in Figure 6 (b) and (d). The results mean that the displacement excitation spectrum is much more effective on distinguishing the magnitudes of lower-order waviness error components, while the acceleration excitation spectrum is much more propitious to distinguish the magnitudes of higher-order waviness error components. Therefore, in order to control strictly the higher-order waviness errors in manufacturing processes, the acceleration excitation spectrum is proposed to evaluate the higher-order waviness errors in this paper.
CONCLUSIONS
In this paper, the effects of higher-order waviness errors on vibration of ball bearings were analyzed based on experiments firstly, and then a new evaluation method was proposed for the higher-order waviness errors. The conclusions can be drawn as follows:
(1) According to the distributions of PSD, the vibration of ball bearings has the most power in the frequency zones A3 and A4, which are corresponding to the
excitation frequencies of higher-order waviness error components.
(2) The reduction of the magnitudes of higher-order waviness errors has a significant effect on cutting down the vibration level of ball bearings, especially in the frequency zones A3 and A4.
(3) The acceleration excitation spectrum is much more effective on distinguishing the magnitudes of higher-order waviness error components, so it is proposed to be the evaluation method for the higher-order waviness errors of ball bearings.
ACKNOWLEDGMENTS
REFERENCES
1. T.E. Tallian, O.G. Gustafsson. Progress in rolling bearing vibration research and control. ASLE transactions, 8 (3) (1965) 195 –207.
2. E.M. Yhland. Waviness Measurement-an instrument for quality control in rolling bearing industry. Proceedings of the Institution of Mechanical Engineers, 182 (1967) 438–445. 3. L.D. Meyer, F.F. Ahlgren, B. Weichbrodt. An analytic model for ball bearing vibration to
predict vibration response to distributed defects. Transactions of the American Society of Mechanical Engineers, Journal of Mechanical Design, 102 (1980) 205–210.
4. F.P. Wardle. Vibration forces produced by waviness of the rolling surfaces of thrust loaded ball bearings part 1: theory. Proceedings of the Institution of Mechanical Engineers, Part C: Journal of Mechanical Engineering Science 202 (1988) 305–312.
5. F.P. Wardle. Vibration forces produced by waviness of the rolling surfaces of thrust loaded ball bearings part 2: experimental validation. Proceedings of the Institution of Mechanical Engineers, Part C: Journal of Mechanical Engineering Science 202 (1988) 313–319.
6. N. Lynagh, H. Rahnejat, M. Ebrahimi, R. Aini. Bearing induced vibration in precision high speed routing spindles. International Journal of Machine Tools & Manufacture 40 (2000) 561–577.
7. T.L.H. Walford, B.J. Stone. The Sources of Damping in Rolling Element Bearings under Oscillating Conditions. Proceedings of the Institution of Mechanical Engineers, Part C: Journal of Mechanical Engineering Science, 197 (1983) 225–232.
8. G.D. Hagiu, M.D. Gafitanu. Dynamic characteristics of high speed angular contact ball bearings. Wear 211 (1997) 22–29.
9. Y.H. Wijnant, J.A. Wensing. The influence of lubrication on the dynamic behavior of ball bearings. Journal of Sound and Vibration, 222(4) (1999) 579–596.
10. R. Aini, H. Rahnejat, R. Gohar. An experimental investigation into bearing-induced spindle vibration. Proceedings of the Institution of Mechanical Engineers, Part C: Journal of Mechanical Engineering Science 209 (1995) 107–114.
11. C.Q. Bai, Q.Y. Xu. Dynamic model of ball bearings with internal clearance and waviness. Journal of Sound and Vibration 294 (2006) 23–48.
12. S.P. Harsha, K. Sandeep, R. Prakash. Non-linear dynamic behaviors of rolling element bearings due to surface waviness. Journal of Sound and Vibration 272 (2004) 557–580. 13. R. Savalia, M.K. Ghosh, R.K. Pandey. Vibration analysis of lubricated angular contact ball
bearing of rigid rotor considering waviness of ball and races. Tribology Online 3 (6) (2008) 322-327.
14. S. Vafaei, H. Rahnejat, R. Aini. Vibration monitoring of high speed spindles using spectral analysis techniques. International Journal of Machine Tools & Manufacture 42 (2002) 1223– 1234.
15. S. Vafaei, H. Rahnejat. Indicated repeatable runout with wavelet decomposition (IRR-WD) for effective determination of bearing-induced vibration. Journal of Sound and Vibration 260 (2003) 67–82.
16. C.S. Sunnersjö. Rolling bearing vibrations—the effects of geometrical imperfections and wear. Journal of Sound and Vibration 98 (4) (1985) 455–474.