Abstract: The experimental data of fatigue crack growth scatter even under identical experimental conditions, including constant amplitude loading. Thus, it is important to take into account the data scatter of crack growth rates by using statistical approach analysis. In this study, the distribution of the fatigue crack growth life was estimated using Markov chain approach based on the modified Paris law equation to consider the variability in the growth of the fatigue crack. In this regard, in the Markov Chain model, the Paris law equation was integrated with the probability distribution of the initial crack length to calculate the probability transition matrix. The result shows that the initial probability distribution was represented by lognormal distribution and it can be said that the initial crack will happen only in state 1 and state 2. The consideration of probability distribution into Paris law equation to represent the physical meaning of fatigue crack growth process. The fatigue life estimation using the Markov chain model are found to be agreed well with experimental results and the value of R2 showed the model is good. The results provide a reliable prediction and show excellent agreement between proposed model and experimental result. This indicates that the model can be an effective tool for safety analysis of structure.
Keywords: Fatigue crack growth, Markov Chain model, probability distribution, randomization Paris law equation
I. INTRODUCTION
It is important to estimate fatigue lifetime with less or more accuracy and durability. In this regard, fatigue phenomenon is difficult due to its highly complex nature (Drewniak & Hojdys, 2015).
Revised Manuscript Received on March 08, 2019.
Siti Sarah Januri, Department of Statistics and Decision Sciences Faculty of Computer and Mathematical Sciences, Universiti Teknologi MARA Cawangan Negeri Sembilan, Seremban, Malaysia.
Zulkifli Mohd Nopiah, Centre for Engineering and Built Environment Education Research Faculty of Engineering and Built Environment, Universiti Kebangsaan Malaysia, Bangi,
Ahmad Kamal Ariffin Mohd Ihsan, Department of Mechanical and Materials Engineering, Faculty of Engineering and Built Environment, Universiti Kebangsaan Malaysia, Bangi,
Nurulkamal Masseran, School of Mathematical Sciences, Faculty of Science and Technology, Universiti Kebangsaan Malaysia, Bangi,
Shahrum Abdullah, Department of Mechanical and Materials Engineering, Faculty of Engineering and Built Environment, Universiti Kebangsaan Malaysia, Bangi, Malaysia.
In addition to the scattering statistical fatigue test results. Thus, predicting system lifetime is crucial to ensure the safety, reliability and availability of the system could be maintained (Le, Fouladirad, Barros, & Levrat, 2013), (He, Hong, Wang, & Lu, 2018). This maintenance operation will help to improve people’s life and assures customer satisfaction (Castro, 2011). However, it can be very difficult to the estimate fatigue lifetime as well as observe physical degradation, especially when real-time observations are required (Zhou, Serban, & Gebraeel, 2011).
This study applied statistical distribution to represent the process of fatigue crack growth. The statistical distribution is determined by analysing the scattering of the test results of the experiment. On the other hand, bootstrap analysis was conducted to determine the statistical distribution. This is because the number of observations has been deemed as too small since the experiment was only conducted on 10 specimens. In this regard, an analysis in the work by (Januri et al., 2017) found that lognormal distribution is the best distribution to represent the data. Therefore, this distribution was integrated with the stress intensity factor function to represent the physical meaning of the fatigue crack growth process.
Accuracy, durability and fatigue strength are important factors to determine structural safety. In the meantime, fatigue crack growth modelling could be used to characterise the evolution of state; a complete fatigue crack growth problem present the whole process from the beginning to material’s complete failure state (Zhou et al., 2011). In this light, fatigue crack growth process is an integration of random factors such as in homogeneity of real material, manufacturing processes, load spectrum, geometry of component, randomness or cracking process technological condition (such as quality of manufacturing) and environmental conditions (Kocańda & Jasztal, 2012), (Ellyin, 1997). These random factors explained the influence of the uncertainty factors to the fatigue crack growth process and how it contributes to the scattering of the crack size. Consequently, there is a significant number of research works that focused on fatigue crack growth models, including models presented in (Becker, Cannon, & Ritchie, 2002), (Alkhateb, Al-Ostaz, & Alzebdeh, 2009), (Sanches, de Jesus, Correia, da Silva, & Fernandes, 2015), (Li, Jiang, Han, & Li, 2015). Many of these models have relied on the experiments.
The Analysis of Fatigue Lifetime using Markov
Chain Model based on Randomization Paris
Law Equation
As fatigue crack growth data reflect a materials statistical nature, therefore the data and analysis could be applied statistically (Wu & Ni, 2004). Many random factors have been considered to describe the whole fatigue crack growth problem. In this light, probabilistic method has brought great interests in works focused on replacing the deterministic method in determining fatigue life prediction (Makkonen, 2009), (Rastogi, Ghosh, Ghosh, Vaze, & Singh, 2016). Probabilistic is also known as stochastic with two types of crack growth model, first, randomisation of the deterministic model with fatigue crack growth model by providing the distribution of random time and second, randomisation of the Paris–Erdogan equation (Kocańda & Jasztal, 2012), (Wu & Ni, 2003). Randomization the Paris-Endorgan equation which involves enhancing the random factors into the equation. In this study, probability distribution of the random factors was introduced into the Paris law equation to analyse the fatigue lifetime by using the Markov chain model.
One important application of fatigue crack growth modelling is predicting the lifetime of the material in the field. There are many statistical models that can be used to predict the fatigue life such as Bayesian estimation (Doh & Lee, 2018) and Weibull modelling (Lan et al., 2018). Factors that contribute to fatigue life include Gumbell distribution of initial crack length (Anderson & Daniewicz, 2018) and the effect of mean stress (Morgantini, Mackenzie, Comlekci, & Van Rijswick, 2018). A Markov Chain approach was introduced to evaluate and model the stochastic behaviours of fatigue crack growth data. Furthermore, probability distribution of initial crack length was introduced to explain the initial probability distribution and randomisation Paris law equation was used to explain the fatigue crack growth process. This study aims to study the effect of probability distribution of initial crack length in the cooperation with Paris law equation in Markov Chain modelling to predict the fatigue lifetime.
II. METHODOLOGY
Markov Chain model is defined as a mathematical model for predicting the future state that depends only on the current state. For a given system, the Markov model consists of the number of possible states, the possible transition paths between these states, and the probability values of these transitions. Figure 1 explains the changes in the transition probabilities from the state to the next. This process is known as Markov Chain model. Each circle represents a state, while the arrows denote the transition path between states. The process starts from the initial state, and end with the failure state, .
Fig. 1 Markov Chain model with a circle represents a state. and are probabilities in particular state and
changing state, respectively (Gansted, Brincker, & Hansen, 1991).
In Markov model, it is an important element to introduce
a duty cycle. Duty cycle as a time to reach crack growth or as the group of the number of cycles accumulated to make a transition to next crack length (Kozin & Bogdanoff, 1983). Consequently, the growth process of fatigue crack length was defined as a discrete both in time and states stochastic process.
The whole procedures of estimating the probability distribution of the states involves several steps. Initially,
time, is measured by the number of duty
cycles. This is followed by the number of damage states, where state denotes a failure state. The duty cycle is specified in a probability transition matrix, as shown below,
(1)
Where
Next, the number of states, where the state reflects crack length increment was determined. The states are assumed to
be discrete with the states, , with
corresponds to the failure state. In the Markov Chain model, it is assumed that crack length increases by stage. The calculation of each state is presented in Equation (2).
(2)
where, is crack length in state , and is initial crack length .
Markov Chain model has two important elements: the initial distribution and the transition probability distribution. Defining the probability distribution of the initial state is represented in the form of (3).
(3)
where
and .
comparing the Kolmogorov Smirnov values of all three distributions (Lognormal, normal and Weibull) (Januri et al., 2017).
Subsequently, the transition probabilities matrix was computed. In this study, the transient probability was obtained by applying the Paris law equation with integrating the lognormal distribution into the model to represent the physical meaning of fatigue damage. The probability of changing to next state, can be defined as stress intensity factor function in Equation (4) which was derived from Equation (5).
(4)
Paris law equation: (5)
where = crack length increment (mm), = number of cycles increment, = material constant, = stress
intensity factor range with
and ,
and lognormal distribution. The lognormal
distribution is as follows:
(6) Here, is a shape parameter and is a scale parameter of the length of the initial crack. The transition probability matrix values were then computed to determine the presence of the fatigue crack growth process. Classical Paris law equation integrated with the lognormal distribution was applied to compute the probability values.
Lastly, Markov property value was computed by using Equation (7).
(7) Equation (7) explains the probability of value changes due to time changes. Comparisons were conducted several times in order to ascertain the future probability in any time (duty cycle), .
As mentioned, this study focuses on the performance of the Markov Chain model to estimate the probability distribution of damage state. In this paper, transition probability matrix was calculated using the randomisation Paris law equation. Meanwhile, the initial probability distribution of the initial state was computed based on Lognormal probability distribution which could describe the distribution of the initial crack length more accurately.
The Fatigue Crack Growth Data
The data used in this analysis were drawn from secondary data. Fatigue crack growth data consists of three stages, initial crack length, fatigue crack growth and failure stage. It is worth noting that this analysis only limited to the stable region. The material used was Aluminium Alloy A7075-T6. Its characteristics are tested at room temperature under constant amplitude loading of 45kN stress load and 0.1 fixed stress ratio, while, the dimension of the specimens was fixed
at 160 mm wide and 60.0 mm thick. The results from the experiment as shown in Figure 2
[image:3.595.312.544.49.294.2]shows there are five stages of fatigue crack growth starting from initial crack length to the failure part. The crack lengths are plotted against the number of cycles in Figure 3. Measurements started at different initial crack lengths while the probability distribution for this part was determined by lognormal distribution.
Fig. 2 Material surface of the aluminium alloy 7075-T6 from the experiment
Fig. 3 Crack length plotted against the number of cycles in Al 7075-T6, R=0.1
III. RESULTS AND DISCUSSION Initial Probability Distribution
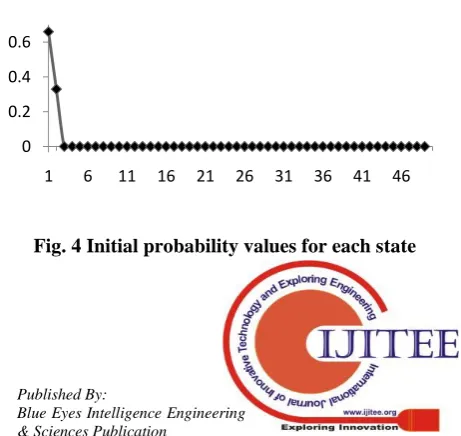
In this paper, the Markov property was used to demonstrate the probability distribution for damage state and the Markov Chain model was constructed with duty cycles are 2000 cycles and . The probability distribution of initial state and transition probability matrix will be discussed in the proceeding section. Figure 4 shows the probability values of initial state, which was determined as the lognormal distribution. Lognormal distribution was chosen as the best distribution to represent the initial crack length with parameter estimation
[image:3.595.309.547.50.154.2]and . In the meantime, states could be defined as the crack length increment. The state starts with initial crack length and ends with failure. The highest probability values of initial crack length have been implied logically at the first and second state, with 66% and 33%, respectively. The values then decrease gradually through the states where all the values are approximately 0%. Therefore, it is safe to say that the initial crack length could not happen in other states except at the first and second state.
Fig. 4 Initial probability values for each state 0
0.2 0.4 0.6
[image:3.595.314.545.611.829.2]Probability Transition Distribution
The transition probabilities matrix was calculated from the randomised Paris law equation as shown in Figure 5. The resulting matrix was used to determine the probability distributions for interesting fatigue crack lengths. The values explain that the lower states will lead to lower probability of cracks occurrence in the same states. Meanwhile, the probability of the crack changed to the next is quite high as the values are larger than 60%.
[image:4.595.318.541.110.376.2]
Fig. 5 Transition probability values
As simple illustration of the Markov Chain model is given in Figure 6. It is assumed that the number of damage states is 50 and the state of damage is considered after 10 duty cycles. This indicates that the probability of being in a state, e.g. state 2, after 10 duty cycles depends greatly on the transition probability. Thus, the probability of crack being in state 3 changed from the initial value 0.0001 to 0.2568, respectively.
[image:4.595.56.280.183.301.2]
Fig. 6 Probability distribution of the states
Fatigue Lifetime Prediction
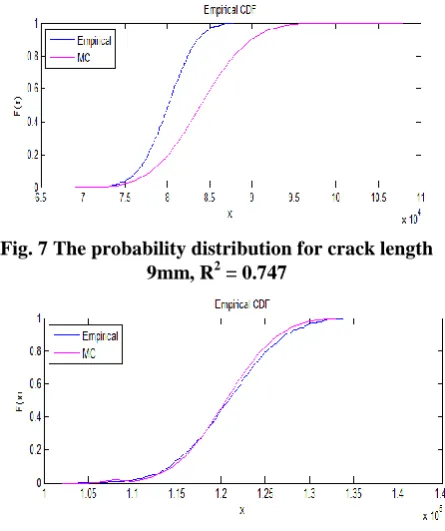
The capability of the model is shown in the Figs. 7 and 8. Figures 7 and 8 present the examples of cumulative distributions obtained by using the Markov Model. These figures include cumulative distribution derived from experimental data to validate the model. The advantages of the Markov Chain model its capability to easily calculate the probability of state of damage at any time, , using Markov property when all the parameter values have been determined. The model shows good agreement with the empirical data with the value of R2 shows 74.71% and 94.75% for life estimation of 9 mm and 16 mm, respectively. The R2 also proves that the model is good
model to predict the life estimation. The random factor is integrated in the probability transition matrix which known as randomised Paris law which was used in calculating the transition probability matrix explained by the lognormal distribution.
Fig. 7 The probability distribution for crack length 9mm, R2 = 0.747
Fig. 8 The probability distribution for crack length 16mm, R2 = 0.9475
IV. CONCLUSION
In this study, the Markov Chain model was used to analyse the probability distribution of the damage state of the Aluminium Alloy, A7075-T6 material. It was found that the factors that contributing to the fatigue are the initial crack length and the stress intensity factor including the width and the length on the specimen, the number of loading cycles and the stress ratio. Meanwhile, the initial crack length was classified as the lognormal distribution and the probability distribution of the initial crack length is important to determine probability distribution for interesting fatigue crack length due to the uncertain of this variable. As mentioned, this study focuses on the random factors in the model to calculate the transition probability matrix and visualises the performance of the model for capturing fatigue life prediction. The result for fatigue lifetime prediction shows that the model has good agreement with the experimental data and R2 proves that the model is able to make the prediction. This highlights the capability of the Markov Chain model in capturing the results. Moreover, it was observed that once the model parameters have been determined, the state of damage in the given structure could be assessed at any time using the Markov property. This shows that the model is able to represent all statistical information about the damage process.
0.00 0.10 0.20 0.30 0.40 0.50 0.60 0.70 0.80
1 6 11 16 21 26 31 36 41 46
q p
0 0.05 0.1 0.15 0.2 0.25 0.3
[image:4.595.58.274.446.581.2]REFERENCES
1. Alkhateb, H., Al-Ostaz, A., & Alzebdeh, K. I. (2009). Developing a stochastic model to predict the strength and crack path of random composites. Composites Part B: Engineering, 40(1), 7–16. http://doi.org/10.1016/j.compositesb.2008.09.001
2. Anderson, K. V, & Daniewicz, S. R. (2018). Statistical analysis of the in fl uence of defects on fatigue life using a Gumbel distribution. International Journal of Fatigue, 112(August 2017), 78–83. http://doi.org/10.1016/j.ijfatigue.2018.03.008
3. Becker, T. L., Cannon, R. M., & Ritchie, R. O. (2002). Statistical fracture modeling: Crack path and fracture criteria with application to homogeneous and functionally graded materials. Engineering Fracture Mechanics (Vol. 69). http://doi.org/10.1016/S0013-7944(02)00047-4 4. Castro, I. T. (2011). A periodic inspection and replacement policy for
systems subject to competing failure modes due to degradation and traumatic events. Reliability Engineering & System Safety, 96, 497– 508. http://doi.org/10.1016/j.ress.2010.12.018
5. Doh, J., & Lee, J. (2018). Bayesian estimation of the lethargy coefficient for probabilistic fatigue life model. Journal of Computational Design and Engineering, 5(2), 191–197. http://doi.org/10.1016/j.jcde.2017.10.002
6. Drewniak, J., & Hojdys, L. (2015). The Method of Analysis of Fatigue Crack Growth by Bogdanow-Kozin Model. Machine Dynamics Research, 39(4), 125–132.
7. Ellyin, F. (1997). Fatigue Damage , Crack Growth and Life Prediction. Chapman & Hall, 2-6 Boundary Row, London SE18HN, UK. 8. Gansted, L., Brincker, R., & Hansen, L. P. (1991). Fracture mechanical
Markov chain crack growth model. Engineering Fracture Mechanics, 38(6), 475–489. http://doi.org/10.1016/0013-7944(91)90097-K 9. He, P., Hong, R., Wang, H., & Lu, C. (2018). Fatigue life analysis of
slewing bearings in wind turbines. International Journal of Fatigue, 111(February), 233–242. http://doi.org/10.1016/j.ijfatigue.2018.02.024 10. Januri, S. S., Nopiah, Z. M., Akramin, M., Romlay, M., Kamal, A., &
Mohd, A. (2017). Statistical distribution for initial crack and number of loading in fatigue crack growth process. International Journal of Advanced and Applied Sciences, (x), 1–9.
11. Kocańda, D., & Jasztal, M. (2012). Probabilistic predicting the fatigue crack growth under variable amplitude loading. International Journal of Fatigue, 39, 68–74. http://doi.org/10.1016/j.ijfatigue.2011.03.011 12. Kozin, F., & Bogdanoff, J. L. (1983). On the probabilistic modeling of
fatigue crack growth. Engineering Fracture Mechanics, 18(3), 623–632. http://doi.org/10.1016/0013-7944(83)90055-3
13. Lan, C., Bai, N., Yang, H., Liu, C., Li, H., & Spencer, B. F. (2018). Weibull modeling of the fatigue life for steel rebar considering corrosion effects. International Journal of Fatigue, 111(February), 134– 143. http://doi.org/10.1016/j.ijfatigue.2018.02.009
14. Le, K., Fouladirad, M., Barros, A., & Levrat, E. (2013). Remaining useful life estimation based on stochastic deterioration models : A comparative study. Reliability Engineering & System Safety, 112, 165– 175. http://doi.org/10.1016/j.ress.2012.11.022
15. Li, B. C., Jiang, C., Han, X., & Li, Y. (2015). A new approach of fatigue life prediction for metallic materials under multiaxial loading. International Journal of Fatigue, 78, 1–10. http://doi.org/10.1016/j.ijfatigue.2015.02.022
16. Makkonen, M. (2009). Predicting the total fatigue life in metals. International Journal of Fatigue, 31(7), 1163–1175. http://doi.org/10.1016/j.ijfatigue.2008.12.008
17. Morgantini, M., Mackenzie, D., Comlekci, T., & Van Rijswick, R. (2018). The Effect of Mean Stress on Corrosion Fatigue Life. Procedia
Engineering, 213(2017), 581–588.
http://doi.org/10.1016/j.proeng.2018.02.053
18. Rastogi, R., Ghosh, S., Ghosh, A. K., Vaze, K. K., & Singh, P. K. (2016). Fatigue crack growth prediction in nuclear piping using Markov chain Monte Carlo simulation. Fatigue & Fracture of Engineering Materials & Structures. http://doi.org/10.1111/ffe.12486 19. Sanches, R. F., de Jesus, A. M. P., Correia, J. a. F. O., da Silva, a. L. L.,
& Fernandes, a. a. (2015). A probabilistic fatigue approach for riveted joints using Monte Carlo simulation. Journal of Constructional Steel Research, 110, 149–162. http://doi.org/10.1016/j.jcsr.2015.02.019
20. Wu, W. F., & Ni, C. C. (2003). A study of stochastic fatigue crack growth modeling through experimental data. Probabilistic Engineering Mechanics, 18(2), 107–118. http://doi.org/10.1016/S0266-8920(02)00053-X
21. Wu, W. F., & Ni, C. C. (2004). Probabilistic models of fatigue crack propagation and their experimental verification. Probabilistic
Engineering Mechanics, 19, 247–257.
http://doi.org/10.1016/j.probengmech.2004.02.008