International Journal of Innovative Technology and Exploring Engineering (IJITEE) ISSN: 2278-3075, Volume-8 Issue-7, May, 2019
Abstract: Many engineering colleges in India are competing with one another to improve the standards of the college by providing best education to the students. The major marking sign among the various criteria is the pass percentage of the students. Sometimes the college management is miffed by stack holders such as parents, other professional bodies, alumni due to the pressure impounded on the students to get the best pass percentage. The proposed paper uses the traditional, but powerful naive Bayes classifier for forecast the student performance, that in turn help the faculty and management to take appropriate movements. The data is collected from the students of 4 year bachelor degree programs of Computer Science and Electronics programs. The data preprocessed for missing value imputation and attribute subset selection. The Bayes classifier model is built by the preprocessed data. The model is tested for check of accuracy and that provided satisfactory results on unknown class label forecasting or prediction, although the features are assumed to be independent as norms of Bayes’ theorem. This helps the teachers and all the stakeholders of the academic institutions that lead to know the performance of the students and to give them the knowledge based on their performance. Further the students and the stakeholders can take corrective actions against the students, whose result is dissatisfactory and it helps to improve their result. Keywords: Naïve Bayes classifier, prediction preprocessing, student performance.
I. INTRODUCTION
Data mining in general is the process of extracting the useful information from the raw data. Various data mining tasks are partitioned in to descriptive and predictive tasks. Descriptive tasks provide the whole description of the data depending on the user requirements. Characterization and discrimination comes under this category. Predictive tasks deals with the finding of unknown label by considering all other independent variables/attributes. Classification and prediction are comes under this task [1]. Classification is the process of building a model or function that portrays the data classes. This model is built by training set and tested for its integrity by test set. The training and test both have the independent and dependent (target) class variables. But the test set tuples hide the class label while it applied on to the model.
Revised Manuscript Received on May 06, 2019
A Daveedu Raju, pursuing 3rd B.Tech at Ramachandra College of
Engineering, Eluru, India.
Ch Gaayathre, pursuing 3rd B.Tech at Ramachandra College of
Engineering, Eluru, India
G Leela Deepthi, pursuing 3rd B.Tech with specialization Computer
Science and Engineering Eluru, India
K Madhuri, pursuing, 3rd B.Tech with specialization Computer Science and Engineering, at Ramachandra College of Engineering, Eluru, India
D Maheswari, pursuing, 3rd B.Tech with specialization Computer
Science and Engineering, at Ramachandra College of Engineering, Eluru, India
The classification tasks are comes under the supervised learning as it utilizes the class label for building the model. Various classification methods are decision trees, naïve Bayes, stochastic gradient descent, logistic regression, k-nearest neighbors, decision trees, random forest, and support vector machine (SVM) [2].
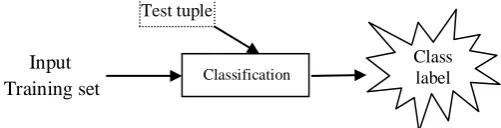
[image:1.595.303.554.254.318.2]Input Training set
Figure 1. Schematic diagram for class label prediction.
Among the various prediction techniques, Bayes classifier has its own advantages for its simplicity by considering the attributes that are not influence one another and carries the equal weights. The schematic diagram of finding the class label for test tuple is shown in Fig. 1. Few outlines of the classification are prescribed here.
A. Bayes classifier
Naïve Bayesian classifier adopts the Bayes’ theorem which predicts the class membership probabilities, that indicates the probability of a particular tuple that belongs to a specific class.
B. Bayes’ Theorem
The theorem is named after the statistician and philosopher, Thomas Bayes [3], who formulated the theorem
P(A|B) = P(B|A)P(A)P(B), which comes in to light by Richard Price, a preacher and philosopher after Bayes called to glory.
The description of the terms in the theorem is stated below: P(A|B) represents the probability that occurrence of variable A given that B is true, it is a conditional probability known as posterior probability. P(A) and P(B) represents probabilities of the occurrence of variable A and B respectively.
P(B|A) represents the probability that occurrence of variable B given that A is true, it is the likelihood or conditional probability.
Further P(A) is called the prior probability of proposition and P(B) is called the prior probability of evidence.
In the naïve Bayes classification, it is written as
Prediction of Students’ Performance for a Multi
Class Problem Using Naïve Bayes Classifier
A Daveedu Raju, Ch Gaayathre, G Leela Deepthi, K Madhuri, D Maheswari
Classification
= P
x
iis value of attributeAk for tuple X. The
probabilitiesP ,P ,P can beobtainedfromtraining
set.
is the prior probability of each class Ci, this is the probability of class Ci irrespective of tuple values.Naive Bayes is a simple, effective and commonly-used, machine learning classifier.
The naive Bayes algorithm is called “naive” because it makes the assumption that the occurrence of a certain feature is independent of the occurrence of other features. It is a probabilistic classifier that makes classifications using the maximum a posteriori decision rule in a Bayesian setting. It can also be represented using a very simple Bayesian network. In general it is a machine learning algorithm for classification problems. It mainly used for high dimensional data sets which used for training like text classification. Naive Bayes classifiers have been especially popular for text classification, and are a traditional solution for problems such as spam detection [4].
Some of the Bayes classification applications are news classification; it is used to divide news by using the content of the news (use of naive Bayesian text classification). Further it involves in medical diagnosis, digit recognition and weather prediction. Bayes classifier is advantageous as it assumes all variables are contribute towards the classification and mutually independent. Some other advantages with Bayes classifier is its easy to apply and classify the test data in less duration, and also good at non binary class predictions. Naïve Bayes compute well compared to other prediction models when independence of attributes occurs, and still it needs less data. It shows effective results with the categorical features/attributes than the numerical attributes.
II. LITERATURE REVIEW
Azwa et al. [5] proposed a paper on a framework for student academic performance analysis using naive Bayes classifier. They had collected data from two different sources where the data contains information about the bachelor of computer science students, FIC, UniSZA. In data selection phase, only six parameters were selected for the mining process. Four parameters that taken from the academic department, UniSZA database are students’ gender, race, home town, and GPA. Mining shows that the naive Bayes classifier gave the 57.4% accuracy in prediction. Average category students got the accuracy of 68.5% of actual data. Family income, gender and home town play a role in determining the accuracy measure, the author used WEKA tool for mining the patterns.
Asif et al. [6] conducted a case study at two universities by gathering the information from their students in electronic form which contains students’ pre-admission data and the examination scores of the courses of first and second academic years to predict the students’ overall performance at the end of the degree. It is observed in their investigation that it possible to predict the 4th year (i.e., graduation performance) by pre university and 2nd and 3rd year courses without considering the demographic and economic features. Further classification accuracy is increased for 5 courses of their consideration.
Dekker et al. [7] gave a case study on predicting the students drop outs by using the WEKA tool and comparative study performed on CART and C4.5, a Bayesian classifier, a logistic model, a rule-based learner and the Random Forest. The classifiers gave the results with 75 to 80 percentage of accuracy.
III. DATA SET
The data set named, D, is collected from the four years bachelor degree students who are studying at Ramachandra College of Engineering [8] which has NAAC accreditation [9] and the programs (Computer Science and Engineering, CSE, and Electronics and Communication Engineering, ECE) from which the data is collected are NBA accredited [10]. The data is collected through the Google form and by paper survey. The data is collected from approximately 400 students who credited with various academic performance levels. Various features are considered that assumed to be influence the students’ academic pass percentage [6].
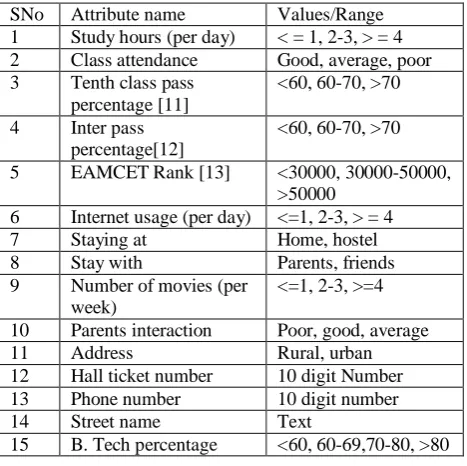
[image:2.595.311.545.378.611.2]Demographic data, mobile/net utilization, parents and friends interaction, area of time spent are some of the criterion considered in this prediction process. Attribute values are shown in the Table 1, the sample data for 8 tuples is given in the Table 2.
Table 1. The attributes considered for data collection.
SNo Attribute name Values/Range 1 Study hours (per day) < = 1, 2-3, > = 4 2 Class attendance Good, average, poor 3 Tenth class pass
percentage [11]
<60, 60-70, >70
4 Inter pass percentage[12]
<60, 60-70, >70
5 EAMCET Rank [13] <30000, 30000-50000, >50000
6 Internet usage (per day) <=1, 2-3, > = 4
7 Staying at Home, hostel
8 Stay with Parents, friends
9 Number of movies (per week)
<=1, 2-3, >=4
10 Parents interaction Poor, good, average
11 Address Rural, urban
12 Hall ticket number 10 digit Number 13 Phone number 10 digit number
14 Street name Text
15 B. Tech percentage <60, 60-69,70-80, >80
IV. METHODOLOGY
International Journal of Innovative Technology and Exploring Engineering (IJITEE) ISSN: 2278-3075, Volume-8 Issue-7, May, 2019
A. Preprocessing
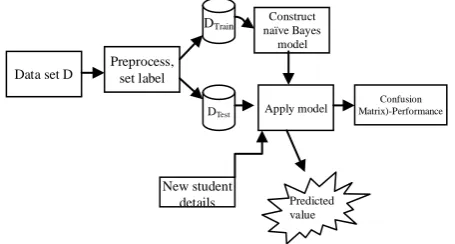
The overall architecture of the proposed model which contains preprocessing, building the model, test the model and predict the unknown class label is shown schematically in Fig. 2. The collected data D, from the students is initially preprocessed for missing values, as may be some of the students may not submit the values or at some values there is a possibility of rolling the typographical error. For the data set D, only two percentage of missing values found, the tuples are ignored in which more than 6 attribute values are missed, the others are substituted with the mode of the corresponding class value [14].
Figure 2. A schematic diagram for the architecture of the prediction model.
Some of the attributes are removed by performing the decision tree classifier [15], the attributes that are not involved in construction of decision tree are assumed to be irrelevant and removed from data set D, those are address, hall ticket number, phone number, street name and time stamp.
The Rapid miner [16] is used to build and test the model. The knowledge flow in Rapid miner is depicted in the Fig. 3. The data is given to the operator missingValueImputation
where the missing values are imputed, the data then forwarded to attributeSelection operator for selecting the best attributes that needed for classification, in next step B.Tech percentage is set as a label or target class by setRole operator.
B. Build the model
The preprocessed data is supplied to crossValidation
operator which uses 10 fold cross validation. 75% of data is set for training the model and the remaining data is to test the model. As shown in Fig. 3, the knowledge flow diagram with operators, the preprocessed data is supplied to
crossValidation operator that uses 10 fold cross validation. In
this process the data is divided into training and test sets. The other layer inside the validation contains model (Bayes classifier) operator and applyModel and performance
operators. The model operator produces the model by training set, the model is then tested by input test set at applyModel
operator. The test result is produced for various test cases that performed at performance operator, this results the confusion matrix.
The mathematical workout of the naïve Bayes’ theorem is given at results and discussion section. In the Table 3, Laplace correction is applied to protect the conditional probabilities against zero.
Table 3. Counts, conditional probability, conditional probability with Laplace correction (lc = 1/20) for sample data (20 tuples with 2 attributes) by considering B.Tech % as class label.
Study hours Class attendance Class
label B.Tech %
< = 1 2-3 > =4 good average poor
C
o
u
n
t <60 3 5 0 3 5 0 60-69 2 5 2 6 2 1 70-80 0 0 1 1 0 0 >80 0 0 2 0 2 0
Pr
o
b
ab
ili
ty <60 3/5 5/10 0 3/10 5/9 0 60-69 2/5 5/10 2/5 6/10 2/9 1 70-80 0 0 1/5 1/10 0 0 >80 0 0 2/5 0 2/9 0
p
ro
b
. w
it
h
L
ap
lac
e
co
rr
e.
<60 3/5+ lc 5/10+ lc
0+ lc 3/10+ lc
5/9+ lc 0+ lc
60-69 2/5+ lc 5/10+ lc
2/5+ lc
6/10+ lc
2/9+ lc 1+ lc
70-80 0+ lc 0+ lc 1/5+ lc
1/10+ lc
0+ lc 0+ lc
>80 0+ lc 0+ lc 2/5+ lc
0+ lc 2/9+ lc 0+ lc
The prediction of class label for test tuple is described for two attributes and one class label for sample data. Initially the probabilities are found for individual values for the attribute. The probability for a student to get 60-69 % of B.Tech marks who study 2-3 hours per day is 5/10, where numerator 5 represents the occurrences at study hours 2-3 and with 60-69% i.e., the value corresponds to 2-3 study hours’ column and 60-69% class label row. Similar validation can be done for all values. The count, probability, probability with Lapalce correction is shown in Table 3.
To predict B.Tech percentage for a test tuple with study hours = 2-3 and class attendance = good, the following procedure has to be adopted. The following equation predicts the class label by calculating the conditional probability and .
Data set D Preprocess, set label
Construct naïve Bayes
model
New student details
Apply model
Predicted value DTrain
ing
DTest
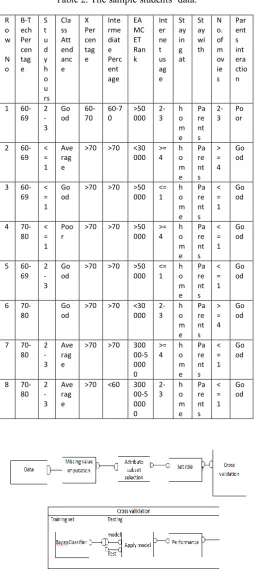
[image:3.595.53.281.205.327.2] [image:3.595.313.542.224.407.2]Table 2. The sample students’ data.
Figure 3. An operator view for preprocessing and validation.
The class labels in this sample are . Let =[77/1000]/P(X) Similarly = [1287/8000]/ = [3/8000]/ = [1/4000]/
The predicted class label is the one which has maximum . From the above four values, 70-80 class value scored maximum probability. Therefore the predicted B.Tech percentage for the student is 60-69.
C. Performance
The performance operator will construct the confusion
matrix which contains the true and false positive and negative values. In this case the test tuple hide its class label to predict label from the new built model. Ones the value is predicted, this compared with the actual value of the test tuple. The values are noted in the confusion matrix as actual and predicted as shown in the Table 5.
V. RESULTS AND DISCUSSION
The confusion matrix is given in the Table 5. The accuracy of the prediction is 84%. Accuracy is calculated as the tuples that are correctly predicted is divided by the total number of observations or prediction.
It is observed that certain attribute combination of tuples not exist in the data set, still the Bayes classification provided the best prediction probability of student performance for a given tuple (this is the tuple that not exist in training and testing). The Bayes classifier provided the probabilities for certain cases that rarely happen in reality, this is because of the assumption of attribute independencies.
The following description reveals the performance of the Bayes classifier.
The confusion matrix provides the extraction of results for the proposed classifier. The count of correct and incorrect predictions are outlined that leads to various measures that discussed which not only informs the errors being made by the model, but types of errors.
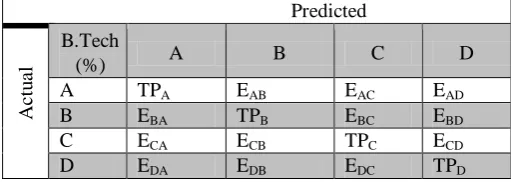
The proposed data set D, is comes under the multiple class problem which containing 4 class values for the attribute B.Tech marks percentage. Let the values are renamed as A = <60%, B = 60 -69%, C = 70-80%, and D = >80% (these doesn’t indicate the grades, but easing of complexity for visualization). The confusion matrix for the 4 class problem is given in Table 4. The letter TPA represents true positive, actual (observed) value of A is predicted or classified as A. EAB represents error prediction as the actual value of A is predicted as B.
The true positive (TP), true negative (TN), false positive (FP), false negative (FN) of 2x2 confusion matrix can be mapped to 4x4 confusion matrix for calculating accuracy, precision, recall, specificity, that is described below. Further following notation needed to calculate the various measures.
Table 4. Confusion matrix with character representation for the 4 class problem; the class attribute is ‘B.Tech percentage’. R o w N o B-T ech Per cen tag e S t u d y h o u rs Cla ss Att end anc e X Per cen tag e Inte rme diat e Perc ent age EA MC ET Ran k Int er ne t us ag e St ay in g at St ay wi th N o. of m ov ie s Par ent s int era ctio n
1
60-69 2 -3 Go od 60-70 60-7 0 >50 000 2-3 h o m e Pa re nt s 2-3 Po or
2
60-69 < = 1 Ave rag e
>70 >70 <30 000 >= 4 h o m e Pa re nt s > = 4 Go od
3
60-69 < = 1 Go od
>70 >70 >50 000 <= 1 h o m e Pa re nt s < = 1 Go od
4
70-80 < = 1 Poo r
>70 >70 >50 000 >= 4 h o m e Pa re nt s < = 1 Go od
5
60-69 2 -3 Go od
>70 >70 >50 000 <= 1 h o m e Pa re nt s < = 1 Go od
6
70-80
Go od
>70 >70 <30 000 2-3 h o m e Pa re nt s > = 4 Go od
7
70-80 2 -3 Ave rag e
>70 >70 300
00-5 000 0 >= 4 h o m e Pa re nt s < = 1 Go od
8
70-80 2 -3 Ave rag e
>70 <60 300
International Journal of Innovative Technology and Exploring Engineering (IJITEE) ISSN: 2278-3075, Volume-8 Issue-7, May, 2019
The total number of test examples of any class would be the sum of the corresponding row (i.e., the TP+FN for that class); The total number of FNs for a class is the sum of values in the corresponding row (excluding the TP); The total number of FPs for a class is the sum of values in the corresponding column (excluding the TP); The total number of TNs for a certain class will be the sum of all columns and rows excluding that class’s column and row.
[image:5.595.40.296.56.147.2]Table 5 shows the prediction performed by the Bayes classifier that includes class precision and recall.
Table 5. The true and false predictions performed by Bayes model with class precision and recall.
True A True B True C True D Recall (%)
Pred. A 24 6 2 0 75.00
Pred. B 1 86 14 1 84.31
Pred. C 2 3 108 0 95.58
Pred. D 0 0 0 13 100.00
Class Precision
(%)
88.89 90.53 87.10 92.86
A. Accuracy
Accuracy is calculated as the sum of correct classifications divided by the total number of classifications.
Accuracy = (Total number of TPs/Total number of all test results) x100% = 88.8%
B. Precision
[image:5.595.42.297.313.411.2]Precision = TP/(TP+FP), where TP and FP are the numbers of true positive and false positive predictions for the considered class, FP is the sum of values in the corresponding column (excluding the TP), from Table 5, Precision for A = TPA/(TPA+EBA+ECA+EDA) = 0.89, the other values given in Table 6 and the corresponding visual representation is shown in Fig. 5.Precision, the fraction of the positive predictions that are actually positive. From the above confusion matrix the prediction of class A is 75% it tells that out of 32 predictions 24 predictions indicates the correct predictions.
Table 6. The precision, recall, specificity from the predictions shown in Table 5.
A B C D
Precision 0.89 0.90 0.87 0.92
Recall 0.75 0.84 0.95 1
Specificity 0.98 0.93 0.89 0.99
C. Recall
It is commonly called sensitivity, corresponds to the true-positive rate of the considered class. Recall = sensitivity = TP/(TP+FN), TP+FN is the total number of test examples
of the considered class (i.e., the row of that class in our model).
Recall of class A = Sensitivity of class A = TPA/(TPA+EAB+EAC+EAD) = 0.75, the other values are shown in Table 6. Recall tells that when the actual value is A, how often it would predict A. From the above table the recall of class A is 88.89% that is out of 27 cases 24 cases predicted as A.
D. Specificity
It corresponds to the true negative rate of the considered class, that is proportion of the negatives that are correctly classified.
Specificity = TN/(TN+FP), where TN and FP are the numbers of true negative and false positive predictions for the considered class. The total number of TNs for a certain class is the sum of all columns and rows excluding that class’s column and row, FP is the sum of values in the corresponding column (excluding the TP),
Specificity A = TNA/ (TNA+EBA+ECA+EDA) = 0.98, the other values shown in the Table 6. The three measures gave the satisfactory results for the proposed naïve Bayes model.
Figure 5. Visual representation of specificity, recall, precision.
VI. CONCLUSIONS
The practical difficulty of predicting the students’ academic performance is overcome through this proposed paper. The authors focused on preprocessing the data, at missing value imputation and attribute subset selection. Some ineffective attributes are removed through the decision tree technique. Naïve Bayes model is built from the training set and is tested with test set. The accuracy of the classifier, 89%, is much satisfactory when compared with the other publications due to the care in the division of the data set and consideration of Laplace measure to replace zero in conditional probability. The management and faculty are freed by knowing the pass percentage in advance, so that in the case of poor students they can take appropriate action plan to improve the percentage. Further the students who predicted with high/good performance they are well trained for higher education or to motivate them for entrepreneurship or to have a role in digital India campaign. In future course the authors interested to work on deep neural networks that to be applied to reveal the student performance on inter college or university level population of
students.
0 0.5 1
A B C D
Specificity
Recall
Precision
Predicted
A
c
tu
a
l
B.Tech
(%) A B C D
A TPA EAB EAC EAD
B EBA TPB EBC EBD
C ECA ECB TPC ECD
[image:5.595.313.546.333.454.2] [image:5.595.41.297.659.730.2]uthor-1 Phoo
Further, the other studies are in progress to depict the various factors that influence the student performance with respect to economical, social and demographic features on rural and urban students.
REFERENCES
1. J. Han, and M. Kamber, Data Mining Concepts and Techniques, 2nd ed. San Francisco: Morgan Kaufmann, 2012, pp. 5-23.
2. M. Fern´andez-Delgado, E. Cernadas, S. Barro, D. Amorim, Journal of Machine Learning Research, Do we need hundreds of classifiers to solve real world classification problems?, vol. 15, 2014, pp. 3133–3181. 3 https://en.wikipedia.org/wiki/Thomas_Bayes
4. R. O. Duda, P. E. Hart, and D. G. Stork, Pattern Classification (2nd ed.), John Wiley & Sons, 2001.
5. Azwa Abdul Aziz, Nur Hafieza Ismail, Fadhilah Ahmad, Hasni Hassan, A framework for student academic performance analysis using naive Bayes classifier, Journal Teknology, vol. 75, issue. 3, 2015, pp. 13-19. 6. Raheela Asif, Agathe Merceron, and Mahmood K. Pathan, Predicting
student academic performance at degree level: a case study, International Journal of Intelligent Systems and Applications, vol. 1, 2015, pp. 49-61.
7. G. Dekker, M. Pechenizkiy, J. Vleeshouwers, Predicting Students Drop Out: a Case Study, 2nd Int Conf on Educational Data Mining, Proceedings, Cordoba, Spain, 2009, pp. 41-50.
8. www.rcee.ac.in
9. http://www.naac.gov.in/assessment-accreditation 10. http://www.nbaind.org
11. http://main.bseap.org 12. http://bieap.gov.in 13. https://apeamcet.nic.in
14. M. Hua and J. Pei, Cleaning disguised missing data: A heuristic approach. ACM SIGKDD Intl. Conf. Knowledge Discovery and Data Mining (KDD’07), Proceedings, San Jose, CA, 2007, pp. 950–958. 15. M. Dash and H. Liu, Feature selection methods for classification.
Intelligent Data Analysis, vol. 1, pp. 131–156. 16. https://rapidminer.com
AUTHORSPROFILE
Dr A Daveedu Raju, working as a Professor,
Department of Computer Sciences and Engineering at Ramachandra College of Engineering, Permanent Affiliated to JNTU, Kakinada, A.P., India. He was awarded his Ph.D Degree from Andhra University in 2014 with the specialization Data mining. He pursued his Masters of Technology from Andhra University Campus, Vizag, India. He also pursued his master of philosophy from Central University, Hyderabad, India. He developed feedback system for college students at present working college. He is the coordinator for data science club at RCEE. His research interests are machine learning, deep neural networks, data mining, big data analytics and IoT. In his credentials various national and international journals that include IEEE. He is life member of IEEE, LMISTE, AMIE. Presently working on DST, India, NewGen project - A smart kit for detecting Dissolved Oxygen (DO) levels in fish ponds. He played several skits and dramas at student level to create social awareness. He served at various portfolios at his university level as university cultural secretary, department secretary, hostel and mess secretary. He is good at various event managements. He loves to council the students and preach gospel of Lord Jesus.
Ch Gaayathre, at present pursuing 3rd B.Tech at
Ramachandra College of Engineering, Eluru, India. Her interesting subjects are Block Chain Technology, Data Mining, Big Data, Design of Algorithms and IoT. She is active member in various college clubs, JAVA, IoT, Data Science.Active member in buddy program where delivers lectures to Junior students.
G Leela Deepthi, at present pursuing 3rd B.Tech at
Ramachandra College of Engineering, Eluru, India. Her interesting subjects are Data Mining, Image Processing, Big Data and Algorithms. She is active member in various college clubs like JAVA, IoT, Data Science, NSS.
K Madhuri, at present pursuing, 3rd B.Tech with specialization Computer Science and Engineering, at Ramachandra College of Engineering, Eluru, India. Her interesting subjects are Data Mining, Image Processing, Big Data and Algorithms. She is active member in various college clubs, JAVA, IoT, Data Science.