Abstract: Wireless Sensor Networks have number of sensor nodes with limited energy resources that can be deployed regularly or randomly in the applications area. Compared to conventional technologies WSN plays vital role in major applications including structural health monitoring, hospitals, environment monitoring, defense, mining, manufacturing and industry automation. In WSN reliability of network architecture is the crucial parameter. In this paper the study of reliability of three different topologies of WSN (Wireless Sensor Networks) namely star, ring and mesh networks are explained. This paper explains the energy utilized by an each sensor node for during data transmission in each topology. The simulation results will provide useful idea for selection of topologies for sensor network designers for continuous transmission and reception of data for their applications.
Keywords: Energy Efficiency, Transport Protocol, Topology, Reliability, Wireless Sensor Networks.
I. INTRODUCTION
S
ensor networks have of a more number of sensors, processing circuits, and a wireless transceiver [1], [2], [4]. The sizes of a sensor node are small in order to deploy a many sensor nodes into remote and unmanned areas. When the nodes are deployed, they organized themselves as a network, and they can monitor the data in the application area. The nodes get the energy from the battery cell, since the size of a cell is limited; the amount of available energy is also limited. Therefore, in sensor networks the reduction of energy used by the each sensor nodes is the major issues. Lifetime of the sensor networks is mostly depends on consumption of energy in each node during transmission and reveal of data [3]. In energy optimization technique takes priority in WSNs for continuous transmission of data thereby enhancing the network lifetime. By considering above cons proper design has to make for each sensor node so that the efficiency of networks can be improved.In order to reduce the energy usage in each sensor nodes
Revised Manuscript Received on November 27, 2019. * Correspondence Author
T. V. Padmavathy, Professor, Department of ECE in R.M.K. Engineering College, Mail: [email protected]
Dr.T.Blesslin Sheeba, Professor, Department of ECE in R.M.K. Engineering College, Mail: [email protected]
S.Jagadeesh Babu, Assistant Professor, Department of ECE in R.M.K. Engineering College, Mail: [email protected]
D.S. Bhargava, Assistant professor in ECE in R.M.K Engineering College, Mail: [email protected]
and to extend the lifetime of sensor networks an energy management protocols and techniques have to be addressed. There is no rule to select a particular architecture for monitoring data in any applications. Wireless Sensor Nodes formed a cluster of densely deployed nodes to communicate the sensed information through sink nodes. Most of the sensor networks constrained by the low power, dense deployed and limited processing speed. Wireless Sensor Networks has small, cheap, independent, and disposable sensor nodes. Triangular lattice pattern was proposed in [5] for monitoring the entire application area. But there are several problems occur for finding optimal deployment pattern. Dual Triangular pattern of deployment was proposed in [6]. But this proposed method has disadvantage that is usage of energy nodes at the edges are not considered for finding overall energy calculation. Also in this paper they deal with only information coverage. Some authors explained range based sensing and communication models for finding connectivity of nodes in the surveillance areas [7]. Due to the some issues in sensor networks for routing the packets from source to sink the researchers are start to address the routing protocol in different aspects. To address many issues in MAC layer and network layer, a lot of research focuses on usage of energy in each sensor nodes which is placed in the application areas [6], [7].
Energy efficient protocol related to coverage of nodes was addressed in [8]. In this paper the authors present network coverage problem of the WSNs. Here based on the network characteristics the coverage protocols are named as distributed and cluster protocols. The proposed algorithm uses a probability model which is applied to node to node and from source to control station. From this model, the numbers of hops are calculated when the packet has to be transmitted from one to other node. The literature survey concludes that the reliability of network mainly depends energy level each node deployed in the application area but, there is a trade-off between reliability of the data transmission and energy consumption. This paper clearly explains good performance metrics in terms of energy efficiency by comparing node to node and source to sink communication.
In this paper, the probability model is proposed in two scenarios, that is hop-by-hop and end-to-end delay. From this model, the numbers of hops are calculated that a packet has to pass when it is being sent from source to destination. The result shows each node
requires more energy for higher reliability. Obviously, there is a
Identification of an Optimized Network
Topology for WSN Based on Reliability and
Power Efficiency
trade-off between reliability and utilization of energy of the entire network. This paper clearly focuses on comparison between hop-by-hop and end-to-end mechanism in terms of energy-efficiency.
II. RELATED WORKS
Most of the researchers address the energy usage of sensor nodes during transmission of data between the nodes. Because of these requirements, most of the literature is concentrated on finding solutions at various levels of the communication protocol, including energy efficient protocols. Energy usage of sensor nodes reduces the network performance [7]. Although we do not wish to waste energy, our system does have a constant, renewable energy source. Number of algorithms had been projected by the researchers with respect to energy consumption of sensor nodes. Most of the related works deals with area coverage protocols for both random and regular deployment of nodes. The author of [16] addresses the k-coverage protocols and problems. Researchers put more efforts for developing an energy efficient protocol for improving the lifetime of the sensor networks which can be given in [19]. A complete survey on existing topology can be explained in [16] and [19]. There are increasing research efforts on studying the issue of reliable data transfer in WSN,[7]-[12]. From Hop-to-hop data transmission was addressed in [7], recovery of data was explained in [8], from end to end communication of data was proposed in [9] and multi path data forwarding was addressed in [12]. These techniques are used to achieve for reliable data transmission.
Using probability model the hop to hop count and end to end mechanism in transport layer was explained in [8]. By using probability model they used to evaluate the number of hops that a packet has to pass when it is being sent from node to node. They also find the best possible number of transmissions and also know there is a trade-off between reliability and energy consumption. Probabilistic coverage with various topologies also been studied in [5] but no specific coverage protocol is presented. References [14] and [15] are survey papers. These papers give an introduction to the reliable data transport problem in sensor networks.
Authors in [18], [19] gives the features of Smart RF CC2420, 2.4GHz IEEE 802.15.4/ZigBee-ready RF Transceiver. Two most important roles are reliability and congestion control. A good protocol is not only a protocol that guarantees two such goals but also an energy-efficient protocol. Some researcher gave investigation about reliable data transport between the nodes in sensor networks but they are not focused on network lifetime and utilization of energy by the sensor nodes.
III. MOTIVATION
There are many issues found from the related reviews which were addressed by many authors in terms of sensor node connectivity, congestion control in transport layer, energy
topology. The following section explains the mathematical equation for finding maximum number of transmission, probability of data packet reach the destination and probability of sending packet successfully. Since each topology has its own pros and cons under the operational conditions therefore there is no common procedure for selecting a best architecture for all conceivable wireless sensor Network applications. Various performance parameters such as energy efficiency, network scalability, communication reliability, data latency and environmental constraints must be considered before deciding a particular topology. The problem is to find the optimal network topology based on the values of the performance parameters (reliability and power consumption). The number of data retransmissions and reception is mainly depends on the reliability requirement, probability of link error and network size.
The following assumptions are also made for WSN analysis: i.Since the nodes are deployed randomly the connectivity of sensor nodes are demonstrated by an directionless probabilistic graphG(V,E), where V is the position of
vertices of the sensor nodes present in the network and E is the position of edges (links).
ii.Let
d
(
i
,
j
)
be the distance between nodesi
andj
andR
c , be the range of each transceiver.Sensors
i
andj
can communicate directly and a corresponding undirected edge eij, exists, i.e.
i,j Eif and only ifd
i,j Rc . Nevertheless, directed edges can be easily incorporated.iii.A link
e
E
fails independently with a known failure probability. A node vE also fails independently link with a known probability.iv.The failure probability for each link or node is given as a fixed probability for a specified mission time or terms of a lifetime distribution.
v.Here each sensor node is stationary and the topology of network does not change during the transmission time.
IV. PARAMETERS
n
: Hops counts between source node to sink or destination. Plink: Probability of error for a single attempt across one link.T
: Maximum number of transmission, which is maximum number of times that node has to transmit a packet. That is when the node transmits a packet the node will store a duplicate of data packet in its buffer, and assign a count variable with initial value as 1. In the absence of acknowledgement signal from the receiving nodes the source node will retransmit the packets to those particular receiving nodes. For every retransmission of data packet the assigned variable count will increase by 1. Until the node receives the acknowledgement packet from the receiving node or theH
: Number of hops, it is the number of links between nodes that the data packet has to be transmitting between source to sink node or its destination. If there is no error, then the distance of hops between source and sink are equal. In fact, when an error occurs, a node needs to retransmit the packet. The hop distance of packets between sources to destination is equal to the total hop distance that the packets need to be transmitting to reach its destination which includes the transmission and retransmissions. The hop distance is usually greater than number hops between sources to destination. The energy consumption of a node is calculated based on packets transmitted by an each hops. Therefore the hop count is considered as cost of the network.err
P
: which is probability of event that a packet cannot successfully reach destination even after using retransmission.P
err can be represented as reliability of thenetwork, if
P
err is small, then the network is fully reliable.(max) err
P
: Maximum probability of error, which is requiredthreshold of
P
err.The value of the threshold, should be oneof {0.01, 0.05, 0.1, 0.2, and 0.5}. In network, the condition of reliability requirement is
P
err
P
err(max)[20], [13].V. MATHEMATICAL MODEL
Let us consider a packet is transmitted using one hop link. The probability of the event that the packet reach the
destination after the
i
th transmission is
link
i link
i
P
P
P
11
(1) Probability of the event that a packet not reached the destination afterT
transmission is given byT link
fail
P
P
(2) The estimated number of hops of a packet is
Tlink T i link i link T i i
hop
i
P
i
P
P
T
P
E
1
1 1
1
(3)We know that,
link T link T i i linkP
P
P
1
1
1 0 (4)By applying derivative on both sides of (4) then,
2 1 1 11
1
1
link T link T link T i i linkP
P
T
TP
P
i
(5)Using Eqn (5), and Eqn (3) can be reduced as,
2 2 1 1 1 1 1 link link link T link T link hop P P T P P T TPE (6)
Now the equation (6) can be simplified and the expression for the estimated number of hops of a packet can be written as,
link T link hopP
P
E
1
1
1 (7)To reach the destination, the packet needs to take
n
links, so the number of hops is,
link T link hopP
P
n
E
n
H
1
1
1 (8)The probability of forwarding a packet successfully after
T
transmissions through first hop is,T link T
link
P
P
P
1
1
1
(9)The probability of sending a packet successfully after
T
transmissions from source to destinationis given by
T
nlink n
link
s
P
P
P
1
(10) The probability of unsuccessfully sending a packet after
T
transmissions from source to destination is,
T
nlink s
err
P
P
P
1
1
1
(11) So, in the case of hop-by-hop, the estimated hop count of a packet is derived from (8) and the reliability of network can be obtained from equation (11). To get successful reliable of transfer of data is obtained only if
(max) err err P
P Perr(max)0.01,0.1,...).) Therefore,
1
(max)1
linkT n errerr
P
P
P
(12)From equation (12), the maximum number of transmission
T
is satisfied only when
P
err nT
1
1
1
log
(13)Thus, the value of
T
should be a positive integer which is satisfied by equation (13).VI. SELECTION OF TOPOLOGIES
The topology architectures used to implement wireless sensor network solutions include star, mesh, and star-mesh hybrid topologies. The selection of the suitable topology depends on the quantity of data transferred, transmission range, frequency range, life of the battery and mobility of sensor nodes. The following section presents the comparison between various configurations of WSN related to energy efficiency, lifetime of the network and other performance metrics.
A. Star Topology
If the nodes long distance from the sink node it consumes more energy to complete the successful transmission of packets so the battery energy is drained faster. Star topology is illustrated in Fig.1.
Fig.1. Star Topology
In a star topology sensor nodes are heterogenic and the base station sends the commands to the sensor nodes at the endpoints, and to transfer data to a higher-level system, such as the Internet. Compared to other networking topologies the star topology consumes less power but it is limited by the transmission distance.
The main advantage is the network can be enlarge based on the user applications that is star topology is scalable. In this topology, if the single point or if any one node fails due to lack of energy or any other physical disturbance there is no reliable data transmission between nodes. In the star topology, all the data transmissions are directed through the central node. Hence the highest number of hops possible is 2.We have allowed 6 transmissions for the simulation in case of failure. So the highest number of hops of the packet possible is 12(worst case) and depends on the value of
P
linkB. Mesh Topology
Mesh topology is a multi-hoping system. In this configuration each node can exchange the data directly with each other. In this network, a node can have a maximum of four neighbours. An example of such neighbours is indicated in red in Fig 2 . In the network if any one of the nodes fails to transmit the data to its neighbors the performance of the network will not be reduced.
Therefore mesh topology provides reliable communication. In mesh topology the size of the network can be increased based on the user applications that is mesh topology is
more energy and more delay for transmitting data from node to node.
C. Ring Topology
In ring topology as illustrated in Fig.3 each node has its two neighbour nodes for communication purposes. The direction message transmitted towards either clockwise or counterclockwise direction. Incase if one node fails due to environmental conditions or lack of power then there is no communication between the nodes and the performance of the networks get reduced.
Fig.2. Ring Topology
The energy utilization of the transmitting nodes gets increased because of retransmission of the packets. In this configuration there is no data collision because each node release the data packet after getting the acknowledgement packet from neighbouring nodes but this causes the more latency. Here there is no coordinator node for network connectivity so there is equal access of resources.
D. Multi-Hop Power Consumption Model
Mathematical model for source to destination communication power utilization model is explained here. When calculating the power utilization of node, the energy consumption due to overhead also to be considered. Always power consumption of receiving circuitry is greater than transmitting circuitry. Similarly, the power usages of base band signal is estimated to be more compared to the sum of power utilized by transmitting and receiving circuitry. In order to calculate the total power used by the nodes we have consider transmitting power, receiving power and distance between the nodes.
Total power consumed by the network when data packet is transmitted from source to destination can be written as,
n
R
P
P
n
P
n
n
P
T T
R
0 0
1
(14)Where,
n
R
P
T - Power consumption for transmitting over adistance
n
R
- Constant given byP
Rmin
A
Rx
P
- RF power received by an antennaTx
P
- RF power transmitted from an antenna
is the path loss and is about 2 for free space and it will increase when there is obstaclesVII. SIMULATION RESULTS
[image:5.595.307.555.51.248.2]Here simulation results are presented and analyzed. The simulation parameters are inferred in Table 1. in this simulation scenario the SN(sensor nodes) are placed as regular deployment as four different configurations such as Star, Mesh, Ring topology and Multihop.
Table- I: RF Power Module for MICA 2 Mote
Parameters Value
RF Power Received by an Antenna (
P
R0) 22.2 mWRF Power Transmitted by an Antenna (
P
T0) 15.9 mWNumber of Hop Counts
H
18Simulation results are discussed in terms of two parameters, 1. Probability of error vs the number of transmissions 2. Estimated number of hops vs number of transmissions
[image:5.595.308.553.278.472.2]Fig. 4. Probability Error for Star Topology
Fig.5. Estimated Numbers of Hops for Star Topology
Fig.6. Probability Error for Ring Topology
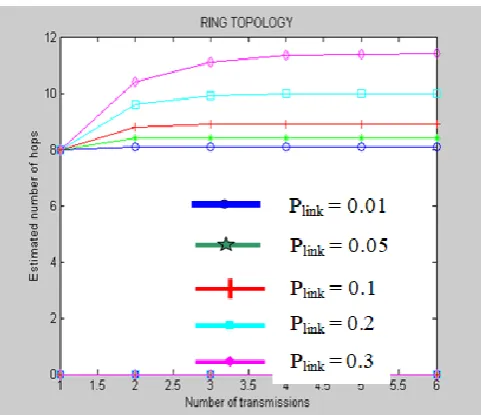
Fig. 7. Estimated Numbers of Hops for Ring Topology Plink = 0.2
Plink = 0.1 Plink = 0.05 Plink = 0.01
[image:5.595.48.289.481.678.2] [image:5.595.311.552.496.703.2]Fig.8. Probability Error for Mesh Topology
Fig. 9. Estimated Numbers of Hops for Mesh Topology
Figures 4, 6 and 8 show the total Probability of error for a star, a ring and a mesh network respectively for various values of link error probabilities. The plot shows the number of transmissions versus the probability of error. Clearly, when the number of transmissions increases, the probability of error decreases, thus, reliability goes up. We also see that reliability goes down when probability of error per link increases
[image:6.595.47.289.267.471.2]Fig. 5, 7 and 9 show the relationship between estimated hops count and the number of transmissions. Let the estimated hop count from source to destination is 3. If there is congestion then there will be a packet lost which will increase the hop count. The higher probability of error per link, the higher the estimated number of hops is. We see that the estimated number of hops goes up when the number of transmissions increases; it also means that energy consumption increases.
Fig. 10. Power Consumed in Star Topology
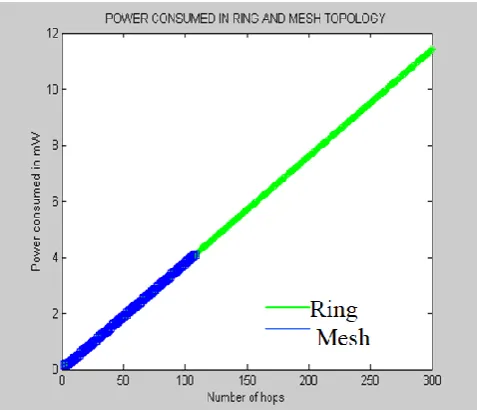
Fig. 11. Power Consumed in Mesh and Ring Topology
Figures 10 and 11 show the power used in each topology for a message transmission as a function of the hop count. As the hop count increases the power utilized by an each node also increases for star and ring topology. Whereas in case of mesh topology as the hop count increases the energy consumed by an each node is not increased so much as compared to star and ring topologies. Therefore increased power consumption reduces the efficiency and lifetime of the network.
VIII. CONCLUSION AND FUTURE WORKS
[image:6.595.308.547.283.488.2]probability per link is the maximum because if one of node in the ring topology fails then there will be no communication between two neighbouring nodes. Mesh configuration gives better efficiency than ring topology with a comparatively lesser error probability for maximum error probability per link.
Power consumed in a mesh is less compared to the ring topology to transmit data between two nodes separated by the same distance. Considering the dependence on the central node in star topology even though the power consumed may be less it cannot be considered as efficient. As a whole, mesh topology will be the best because, in case of any node failure, routing will become extremely difficult in a ring and star network as compared to mesh. The hop count will not vary much between the nodes in a mesh due to the availability of several alternative paths of same distance.
Our future work includes study of performance of different topologies based on other performance parameters such as latency, self-organization and sensitivity. The simulation results shows the mesh topology provide better performance metrics compared to star and ring topology and this results helpful for WSN designers to choose proper topology for their applications.
REFERENCES
1. Shrestha, Akhilesh Xing, Liudong, ―A Performance Comparison of Different Topologies for Wireless Sensor Networks‖, IEEE Conference on Technologies for Homeland Security, May 2007.
2. M. Rausand and A. Hoyland , ―System Reliability Theory: Models and Statistical Methods‖, Wiley Series in Probability and Mathematical Statistics, John Wiley &Sons, 2004 3. Dang Quang and Hwang Won-Joo,―Trade-off between
Reliability and Energy Consumption in Transport Protocols for Wireless Sensor Networks‖, International Journal of Computer Science and Network Security, Vol.6 No.8B, August 2006.
4. Wang, X.; Xing, G. Integrated coverage and connectivity configuration in Wireless Sensor Networks. Proceedings of ACM International Conference on Embedded Networked Sensor Systems 2003, pp 28-39.
5. Bai, X.; Kumar, S. ―Deploying Wireless sensors to achieve both coverage nd connectivity.‖ Proceedings of ACM MobiHoc’06 2006, p.p.131-142.
6. Joseph Polastre, Robert Szewczyk, and David Culler, ―Telos: Enabling Ultra-Low Power Wireless Research‖, IPSN/SPOTS, 2005.
7. Mark Hempstead, Nikhil Tripathi, Patrick Mauro,Gu-Yeon Wei, David Brooks, ―an Ultra Low Power System Architecture for Sensor Network Applications‖,ISCA05
8. Y. H. Chee, J. Rabaey, .M.Niknejad, ―A Class A/B Low Power Amplifier for Wireless Sensor networks‖,ISCAS’04. 9. Devrim Aksin, Stefano Gregori, Franco Maloberti,
―High-efficiency power amplifier for wireless sensor network‖, ISCAS’05.
10.J. M.. Rabaey, J. Ammer, T. Karalar, S.Li, B. Otis, M.Sheets, T. Tuan, ―Pico Radios for wireless sensor networks—the next challenge in ultra-low power design‖, ISSCC2002.
11.Martin Haenggi and Daniele Puccinelli, ―Routing in Ad Hoc Networks: A case for Long Hops‖, IEEE Communication Magazine, Oct. 2005.
12.Andreas Willig and Holger Karl, ―Data Transport Reliability in Wireless Sensor Networks. ―A Survey of Issues and Solutions,‖ Praxis der Informationsverarbeitung und Kommunikation, vol. 28, No.2, pp.86-92, 2005.
13.Chonggang Wang, Sohraby K., Yueming Hu, Bo Li and Weiwen Tang, ―Issues of transport control protocols for wireless sensor networks,‖ in Proceedings of IEEE ICCCAS, vol. 1, May 2005 pp. 422 - 426.
14.Zhong, L.C.; Rabaey, J.M.; Wolisz, A, ―Does proper coding make single-hop wireless sensor networks reality: the power consumption perspective‖, WCNC2005.
15.Qin Wang, Mark Hempstead and Woodward Yang, ―A Realistic Power Consumption Model for Wireless Sensor Network Devices‖, SECON2006.
16.Li, F.; Deng, K.; Meng, F. Coverage in Wireless Sensor Network Based on Probabilistic Sensing Model. In Proceedings of the 2015 International Conference (AMMIS2015), Nanjing, China, 19–20 June 2015;pp. 527–533.
17.S.Kumar and D.K.Lobiyal, ―Sensing Coverage Prediction for Wireless Sensor Networks in Shadowed and Multipath Environment‖, The Scientific World Journal , 2013.
18.H.P.Gupta, P.K.Thyagi and M.P.Singh, ―Regular Node Deployment for k-coverage in m-connected Wireless Networks,‖IEEE Sensor Journal, Vol.15, pp. 7126-7134, 2015. 19.S.Silversti, and K.Goss, ―Mobibar: An Autonomous Deployment Algorithm for Barrier Coverage with Mobile Sensors,‖ Adhoc Networks , Vol 54, pp.111-129,2017.
AUTHORSPROFILE
T. V. Padmavathy Professor, Department of ECE in R.M.K. Engineering College, has 24 years of teaching and research experience in the in the fields of Wireless sensor networks, Under Water Acoustic Sensor Networks and Antenna Design. She has graduated from Institution of Engineers (India), in Electronics and Communication Engineering. She has obtained her Master degree in Control and Instrumentation from College of Engineering, Guindy, Anna University, Chennai and Ph.D. degree from Anna University, Chennai. She has published more than 50 research papers in International and National Journals and conferences in the area of Mobile Ad hoc Networks, Wireless sensor networks, Under Water Acoustic Sensor Networks and Antenna design and she has four Patents in Wireless Sensor Networks. Her current area of research includes security and architecture issues of Mobile ad hoc networks, Wireless sensor networks and Millimeter Wave Antenna design for Wireless Communications. She is a technical paper reviewer for African Journal of Engineering Research and Journal of Engineering and Technology Management. She is recognized as Fellowship member by The Institution of Engineers (India) also she is a member of various professional bodies such as Institute of Electrical and Electronics Engineers (IEEE), Life member of Institution of Electronics and Telecommunication Engineers (IETE), International Association of Engineers (IAENG), ACM, ISSE and Life member of Indian Society for Technical
Education ISTE.
S.Jagadeesh Babu, Assistant Professor, Department of ECE in R.M.K. Engineering College, has 10 years of teaching and research experience in the in the fields of VLSI Design, Wireless sensor networks and Wireless Communication. He has graduated from Adhiparasakthi Engineering College, in Electronics and Communication Engineering. He has obtained his Master degree in VLSI Design from Easwari Engineering, Chennai. His current area of research includes Low power VLSI and proficient in backend tool CADENCE. He is a member of various professional bodies such as Life member of Institution of Electronics and Telecommunication Engineers (IETE), International Association of Engineers (IAENG), and Life member of Indian Society for Technical Education ISTE.