Abstract: Cloud Computing necessitates virtual machines that can deploy users to a machine in a sub-optimal fashion for effective and maximum utilization of resources conserving overall energy within the specified duration. PNN is an effective probabilistic classifier which has been applied for a wide variety of computer application problems. However, for big data applications, we need either pre-processing algorithms for efficient classification with lower computing time or Mathematical tracking operators to speed up a parametric approach. This paper focuses to combine the traditional K means algorithm and a PNN to process the data obtained from Google cluster to classify them into pre-specified groups so as to implement PM classifier design to monitor the Cloud usage pattern. It is found after validation of KPNN with different data sets that KPNN works better than PNN in terms of accuracy even when the number of classes increases and turns out to be a computationally attractive tool.
Keywords : classification, clustering, PNN Probabilistic Neural Network
I. INTRODUCTION
In the current scenario, cloud computing is getting treated as a vital technology to overcome many of the resource-wasting bottlenecks [1]. In the cloud computing environment, virtualization is the key technology to achieve the maximum utilization of resources. To utilize the cloud environments, virtual machines will be created and allocated to the end-users based on their specifications [2]. As a cloud service provider, they are supposed to manage their resources effectively so that poor utilization or keeping the resources in an idle mode can be minimized. For the effective utilization of resources, one of the primary jobs is to track the resources utilization rate of the physical machines. The resources that are to be taken into an account to track are CPU utilization rate, RAM utilization rate, Network bandwidth utilization rate and Hard Disk capacity of each physical machine [3]. The reason behind in tracking the physical hosts is that virtual machines are going to be created and served from the physical host [4-5]. Based on the tracking results of the utilization rate, the physical hosts can be identified as either under loaded
Revised Manuscript Received on November 06, 2019.
N.Venkata Subramanian http://orcid.org/0000-0001-8096-742X*, Assistant Professor, School of Computing, SASTRA Deemed University, Thanjavur, India. Email: [email protected]/[email protected]
N.Saravanan, https://orcid.org/0000-0001-7598-3812 Assistant Professor, School of Computing, SASTRA Deemed University, Thanjavur, India. Email: [email protected]/[email protected]
S.Bhuvaneswari, QET Engineer, TCS, Chennai, Thoraipakkam, Chennai, India. Emaiil:[email protected]
system(UL) or normal loaded system(NL) or overload system(OL)[6-7]. To do this, clustering techniques are to be employed as the preliminary step to group the utilization rates data. Grouping of the unlabeled data based on some similarity factors are called as data clustering [9]. Variety of data clustering applications can be seen in real-world problems such as knowledge discovery, pattern recognition, fault detection, face recognition, e.t.c.[8]. Among the various data clustering techniques, K-means clustering is one of the known and popular unsupervised learning tasks, that is broadly accepted technique because of its simplicity to implement the technique as well as high speed in data clustering [10].
Probabilistic Neural Network(PNN) is one of the best classifiers over the other neural network-based classifiers. The proposed paper comprise of sections, in which section 2 discuss about the working principles of K-means algorithm. Section 3 contains a brief discussion on PNN working flow, then discussed the impact of K-means based PNN under section 4. Finally done the experiments on proposed technique using “Google cluster” data set in section 5.
II. PROCEDUREFORPAPERSUBMISSION
A. K-means algorithm - An overview:
Similar data points are grouped under a group with the calculation based on distance[11-14].
The classic K-means algorithm is as follows: 1. Initialize the cluster centroid randomly. Y={y1,y2,....yk}
2. Repeat the process until the condition is satisfied.
For each i, set the cluster clusi to be the set of points in Y, and that clusi to be very much closer than the clusj, for all i ≠ j.
3. For each i let clusi be the center of cluster Clusi( mean of the vectors in clusi).
4. Repeat till the convergence met. .Properties of K-means:
1.
It can be used for finding out the local optimum value.2.
It can fetch the convergence often very earlier stage itself.K- Means Based Probabilistic Neural Network
(KPNN) For Designing Physical Machine –
Classifier
3.
Selecting the initial points are very much worthier and will have a very high impact on the results that are obtained by this algorithm.
B. Diagram of different K-means Clustering’s
K-means algorithm is a popular unsupervised learning algorithm to group a set of data points into a predefined cluster. Euclidean distance-based centroid calculation is the most extensively implementing procedure in this K-means clustering technique. Similarity measures among cluster.
.
III. PROBABLIISTICNEURALNETWORK
A. Introduction
Signal classification and pattern recognition problems are common in the areas of engineering, science and research. Input and output of the systems may vary in time based on features and certain functions. Degree of uncertainty may occur in results often due to systematic error and noise. These results are then converted into values between 0 and 1 to ensure a degree of certainty, which in turn generates ambiguity. Methods to solve this sort of problem is being investigated.
By considering the Bayesian decision model PNN (Probabilistic Neural Network) proposed by Specht, with learning properties of artificial neural networks. PNN model is more advantageous because it uses an activation function derived from statistics as well as it has strong fault tolerance and can be implemented in hardware.[15-17]
In the following sections, the concept and architecture of the Probabilistic Neural Network will be discussed. Its application to a real-time problem and the capability of results is also verified.
B. The Concept
Probabilistic neural network (PNN) has many similarities with Parzen window pdf estimator. A PNN comprises of several sub-networks, each of which is a Parzen window pdf estimator for the classes. Parzen window is a technique for classification and density estimation[18]. It is a nonparametric procedure that fusions and approximates training set distribution by placing the number of windows as
replicas of a function.
C. Approachand Mathematical Aspects
Let us assume that there are certain inputs and/or target vectors. The test input will be assigned to one class among the K defined classes and conditional density will also be estimated[19]. To ascertain optimal decision, prior results are combined by the rule of Bayes to obtain A- Posteriori class probabilities.
As per Specht’s implementation, Gaussian kernels are used as a window:
p(s, x) = exp( -||x-s||2 / 2 sigma2)
In the above equation, the smoothing parameter (sigma) is the only free parameter.
D. PNN Architecture
PNN architecture consists of the following four layers[20]:
Input Layer: The input nodes are a set of measurements
which are meant for providing input to the system.
Pattern/ Exemplar layer: Each sample has a corresponding pattern unit. This layer consists of kernel function used to compute the Gaussian distance of each sample from the input.
exp[ ( xTwki-1 ) / s2 ]
Summation/ Class layer: The output of the previous layer is
the input for all the summation nodes. This layer performs an average operation on the outputs
Si=1N k exp[ ( xTwki-1 ) / s2 ]
Output / Decision layer: This layer performs the decision of
selecting the largest value. It produces binary output for two values.
Si=1Nkexp[ ( xTwki-1 ) / s2 ] > Si=1Njexp[ ( xTwkj-1 ) / s2 ]
E. PNN Architecture
IV. TEST VERIFICATION METHODS
A. Need for verification
The results of the tests will indicate the suitable type of input pattern representation which generates successful output. In this case, the Iris plant database of R.A. Fisher[22] has been used for the test verification procedure.
B. IRIS Plant Database
The IRIS dataset[23] classifies a plant as belonging to either of the three different classes of IRIS plant by performing pattern classification. The data set includes three classes of 50 objects each. The total of 150 instances, which are equally separated between the three classes, contains the following four attributes:
1. sepal length followed by 2. sepal width followed by 3. petal length followed by 4. petal width.
The attributes can be described as categorical, nominal or continuous. The three classes are Iris Setosa, Iris Versicolor and Iris Verginica. To train the network test process accepts the training set, to validate the network here validation set is used, to adjust it to design parameters and a test set which is used to test the performance of the selected design of the neural network. The aim is to identify/classify the IRIS plant based on analysis of pattern, petal and sepal size.
C. Test pattern corresponding successful classification of Iris Versicolor:
It is clear from the test verification carried out on the PNN paradigm that the network has worked well with regard to an analogue input. This is a strong point of this approach as few other paradigms are not adaptable towards handling analogue inputs and in a few cases even require a large scale modification in NN topology itself. Further, the PNN is able to handle noisy data well and trains well from training patterns. The training phase is a case of adjusting only the smoothing parameter also called the free parameter.
(Table: 1)
Sample attributes information for Iris dataset Attribute information for
Iris Versicolor
Attribute information for Iris Virginica
[6.1, 2.9, 4.7, 1.4]- Training pattern 1 [5.9, 3.2, 4.8, 1.8]- Training pattern 2 [6.3, 2.5, 4.9, 1.5]- Training pattern 3 [6.7, 3.0, 5.0, 1.7]- Training pattern 4
[6.1, 2.7, 5.1, 1.9]- Training pattern 1 [6.8, 3.0, 5.5, 2.1]- Training pattern 2 [5.7, 2.5, 5.0, 2.0]- Training pattern 3 [5.8, 2.8, 5.1, 2.4]- Training pattern 4
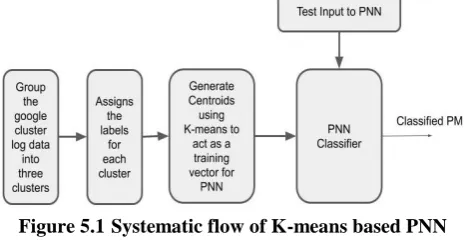
V. K MEANS BASED PNN
a) The first step is to collect the log data from Google cluster, then cluster the collected data into three groups using K-means clustering algorithm.
b) The second step is to assign the labels on the obtained clustered data as Under Load(UL), Normal Load(NL) and Overload(OL).
c) The third step is to generate the centroids from the clustered data. To generate the centroids the primary step
is to obtain the elements count of each cluster. Next step is deciding what will be the value to be given for k, so that k= sqrt(n), Here, n represents the number of elements in a cluster.
d) Based on the value obtained from the above equation, k sub-clusters will be formed on each cluster.
e) Obtained sub-clusters will be acting as training sets for PNN to classify the test input as either Under loaded(UL) or Normal loaded(NL) or Overloaded(OL).
f) The fourth step is that the input to be given to verify the accuracy of the trained PNN.
[image:3.595.310.544.253.374.2]g) As we have expected it gave us the accuracy rate of 91% in classifying and identifying the class of the data set that has been given.
Figure 5.1Systematic flow of K-means based PNN architecture
VI. EXPERIMENTS AND OBSERVATIONS: As we all know that PNN is a well-known classifier in disclosing the class of the data that has been given. Though PNN classified the Iris plant data as well as any data with remarkable accuracy rate, the reason behind in adopting the K-means as a preprocessing step is that, K-means will help to identify how many numbers of optimal training sets are needed to classify the physical machines based on running virtual machines’ utilization rate that is installed in that physical machine. Faster convergence can be realized with the adoption PNN as a classifier to classify PM either as normally loaded system(NL) or under loaded system(UL) or overloaded system (OL).
Before going to use this KPNN with PM– data, we have tested its efficiency with other data sets for ascertaining its efficiency. with lower sized, moderately sized data sets. The results of those experiments with data size, application-focused classification accuracy are furnished in the following table :
(Table: 2)
Results of classification accuracy of KPNN for various data sets
S.No Application Data size # of classes # of
Attributes
Kernel function Classification
error (%)
1 Iris plant database [23] 150 3 4 RBF 2
2 Bioinformatics[24] 450 8 14 Polynomial 7
3 Vehicle[25] 560 4 18 linear 6
4 CPT data for soil classification[26,27]
470 4 4 linear 2
5 QCM sensor SASTRA VOC data[28]
800 3 3 RBF 3
6 VOC database[29] 200 24 16 RBF 2
7 SnO 2 sensor VOC Data[30]
910 2 2 RBF 2
8 Boiler Flue Gas[30] 420 4 5 RBF 2
(Table: 3)
Sample Data set from Google cluster log:
UL stands for Under Load, NL stands for Normal Load and OL stands for Overload
CPU Utilization rate (%)
RAM Utilization rate (%)
Disk Utilization (%) Class
0.000185 0.01521 0.0001793 UL
0.06232 0.1224 0.0003576 OL
0.0002003 0.01523 0.0001831 UL
0.0001497 0.01515 0.0001602 UL
0.0001707 0.0152 0.0001717 UL
0.02725 0.09131 0.0002117 NL
0.0614 0.1223 0.0003557 OL
0.06024 0.103 0.0003548 OL
0.02689 0.09119 0.0002117 NL
0.02756 0.09143 0.0002136 NL
VII. CONCLUSION
In this paper, we have discussed various factors of K - means and PNN with special reference to processing VM data. The cluster centres serve as good inputs to PNN and the cluster centres themselves are found to be good training sets. For various data sets with sizes ranging from 150 to 4000, KPNN is found to be a good classifier with higher classification accuracy. However, this needs to be tested for very large data sets where the cluster centres need to be reduced to a reasonable extent to form support vectors to ensure good classification accuracy. Future work includes Machine learning algorithms to forecast the utilization for effective VM migration.
REFERNCES
1. M. Armbrust, A. Fox, R. Griffith, A.D. Joseph, R. Katz, A. Konwinski, G. Lee, D. Patterson, A. Rabkin, I. Stoica, M. Zaharia, “ A view of cloud computing” Commun. ACM, 53 (4) (2010), pp. 50-58.
2. S. Chaisiri, B.S. Lee, D. Niyato, “Optimization of resource provisioning cost in cloud computing”, IEEE Trans. Serv. Comput., 2012, 5, (2), pp. 164–177.
3. J.-H. Liu, J. Chen, Y.-C. Tai, and C.-H. Shih, “Aces-application cloud
for embedded systems,” in Applications and the Internet (SAINT), 2011 IEEE/IPSJ 11th International Symposium on. IEEE, 2011, pp. 145–151. 4. Z. Tang, Y. Mo, K. Li, and K. Li, “Dynamic forecast scheduling algorithm for virtual machine placement in a cloud computing environment,” The Journal of Supercomputing, vol. 70, no. 3, pp. 1279–1296, 2014.
5. R. Buyya, C.S. Yeo, S. Venugopal, J. Broberg, I. Brandic, “Cloud computing and emerging {IT} platforms: Vision, hype, and reality for delivering computing as the 5th utility”, Future Gener. Comput. Syst., 25 (6) (2009), pp. 599-616.
6. Ahmed Amokrane, Mohamed Faten Zhani, Rami Langar, Raouf Boutaba, Guy Pujolle Greenhead, “Virtual data centre embedding across distributed infrastructures”, IEEE Trans. Cloud Comput., 1 (1) (2013). 7. Hao Jin, Deng Pan, Jing Xu, Niki Pissinou, “Efficient VM placement
with multiple deterministic and stochastic resources in datacenters”, in IEEE GLOBECOM, 2012, pp. 2505–2510.
8. J.A. Hartigan, M.A. Wong, Algorithm AS 136, “K-means clustering algorithm”, J. R. Stat. Soc. Ser. C Appl. Stat., 28 (1) (1979), pp. 100-108.
9. A.K. Jain, R.C. Dubes, “Algorithms for Clustering Data”, Prentice Hall (1988) .
10. L. Kaufman, R.J. Rousseeuw, “Finding Groups in Data: An Introduction to Cluster Analysis”, John Wiley & Sons (1990).
11. J. Han, M. Kamber, “Data Mining: Concepts and Techniques”, Morgan Kaufmann (2001).
12. A.K. Jain, “Data clustering: 50 years beyond k-means”, Pattern Recognit. Lett., 31 (8) (2010),
13. K. Alsabti, S. Ranka, V. Singh, “An efficient k-means clustering algorithm”, Proc. First Workshop on High-Performance Data Mining (1998), pp. 35-43.
14. J.Grabmeier, and A. Rudolph, "Techniques of cluster algorithms in data mining", Data Mining and knowledge discovery, 2002, pp. 303-360.
15. P.A. Kowalski, P. Kulczycki, Interval probabilistic neural network, Neural Comput. Appl. 28 (4) (2017) 817–834, doi:10.1007/s00521-015-2109-3.
16. M. Kusy, J. Kluska, Assessment of prediction ability for reduced probabilistic neural network in data classification problem, Soft. Comput. 21 (1) (2017) 199–212.
17. J. Iounousse, S. Er-Raki, A. El Motassadeq, H. Chehouani, Using an unsupervised approach of probabilistic neural network (pnn) for land use classification from multitemporal satellite images, Appl. Soft Comput. 30 (2015) 1–13.
18. E. Parzen, “On estimation of a probability density function,” Annals of Mathematical Statistics, vol. 33, pp. 1065-1076, 1962.
19. Chu et al., "Numerical conditional probability density function and its application in jitter analysis", Proc. IEEE Int. Symp. Electromagn. Compat. Signal/Power Integrity, pp. 427-432, 2017.
20. Piotr A. Kowalski et al,“Sensitivity Analysis for Probabilistic Neural Network Structure Reduction”, IEEE TRANSACTIONS ON NEURAL NETWORKS AND LEARNING SYSTEMS, VOL. 29, NO. 5, MAY 2018, pp. 1919-1932.
21. Harry C. Powell Jr., John Lach, and Ma¨ıte Brandt-Pearce,“SYSTEMATIC ESTIMATION OF ANN CLASSIFICATION PERFORMANCE EMPLOYING SYNTHETIC DATA”, IEEE International Workshop on Machine Learning for Signal Processing (MLSP 2010) August 29 – September 1, 2010.
22. J.C. Bezdek, J.M. Keller, R. Krishnapuram, L.I. Kuncheva, and N.R. Pal. “Will the real iris data please stand up?”, IEEE Transactions on Fuzzy Systems, 7(3):368-369, 1999.
23. https://archive.ics.uci.edu/ml/machine-learning-databases/iris/iris.data. 24. A. Bhattacharjee, et al, “Classification of human lung carcinomas by mRNA expression profiling reveals distinct adenocarcinoma subclasses”, Proc.Natl.Acad.Sci.USA 98, 13790 - 13795, 2001. 25. M.I. Jordan, R. A. Jacobs,”Hierarchical mixtures of experts and the EM
algorithm”, Neural Comput, 6, 181 - 214, 1994.
26. Pradeep U. Kurup et al, “Prediction of soil composition from CPT data using General Regression Neural Network”, Journal of Computing in Civil Engineering, ASCE, 281 - 289, 2006.
27. M. T. Tumay and A. Kebede, “PClass-CPT program, Version 3.0”, Louisiana State University, 2003. (http://www.coe.1su.edu/cpt/). 28. A. Ozmen., et al,” Finding the composition of gas mixtures by a
phthalocyanine-coated QCM sensor array and an artificial neural network”, Sensors and Actuators B, 115, 450 - 454, 2005.
29. Robi Polikar, “Algorithms for enhancing pattern reparability, feature selection and incremental learning with applications to gas sensing electronic nose system”,Ph. D. thesis, Iowa State University, 2000. 30. A.Sivakumar, “Development of Soft Computing Techniques for
Estimation and Analysis of Boiler Flue Gases”, Ph. D. thesis, SASTRA University, 2016.
AUTHORSPROFILE
Mr. N.Venkata Subramanian, is serving as an Assistant Professor in the School of Computing at SASTRA Deemed University, Tamilnadu, India. His qualification is M.C.A and pursuing Ph.D. His research is centered on cloud computing and published various research papers. He is possessing about 10 years of experience in the field of teaching. He is a corporate trainer also as freelancer. He has guided many post graduate students.
Mr. Saravanan Natesan, is serving as an assistant professor in computer science at SASTRA Deemed University, tamil nadu, India. His qualification is M.C.A., M.Phil., M.E(CSE)., M.Tech(CSE). His research has centered on distributed, mobile, cloud computing and published various research papers. He is possessing almost 20 years of rich teaching experience in the field of computing..