International Journal of Innovative Technology and Exploring Engineering (IJITEE) ISSN: 2278-3075, Volume-8 Issue-7, May, 2019
Abstract:. Face Recognition (FR) has established noteworthy attention in the recent years due to its wide applications in various fields. FR technology uses image processing algorithms for comparing and verifying the human faces. This paper proposes a FR system which employs a novel mixture of Fast Fourier Transform (FFT), Discrete Cosine Transform (DCT) and Swarm Intelligence (SI). FFT and DCT help in extracting the features efficiently. PSO and ABC are used for feature selection that finds the best solution for a given problem. Many hybrid approaches are used to overcome its weakness and more over fit for various applications. The usage of transformation techniques helps in reducing image information redundancy. Experimental results show that there is a notable reduction in the number of features and a considerable increase in the recognition rate.
Index Terms: ABC, DCT, FFT, PSO, Swarm Intelligence
I. INTRODUCTION
Face recognition has got substantial attention, especially during the past several years, due to its various applications in different fields. Facial recognition (or face recognition) is an application that can automatically identify a specific individual using a digital image of that person [1]. Facial recognition systems are mostly used for security purposes for identifying the persons. Other Biometric systems used for identification purpose are skin texture recognition, voice recognition, iris recognition, scanning finger prints and finger vein identification.
Considering the analysis of finger print and iris images, they need support of the participants, whereas a personal identification system grounded on analysis of digital image of the face is often effective without the knowledge and cooperation of candidates.
This paper encompasses two phases viz. training phase and recognition phase. In first phase i.e., training phase, Pre-Processing, Feature extraction, Selection and Creation of image gallery are done. In the Recognition stage pre-processing, feature extraction, feature selection and classification using Euclidean Classifier are done. The pre-Processing stage includes gamma correction for image
Revised Manuscript Received on May 10 , 2019
P. Malin Bruntha, Department of Electronics and Communication Engineering, Karunya Institute of Technology and Sciences, Coimbatore, India. S. Dhanasekar, Department of Electronics and Communication Engineering, Karunya Institute of Technology and Sciences, Coimbatore, India. K. Martin Sagayam, Department of Electronics and Communication Engineering, Karunya Institute of Technology and Sciences, Coimbatore, India. S. Immanuel Alex Pandian, Department of Electronics and Communication Engineering, Karunya Institute of Technology and Sciences, Coimbatore, India.
enhancement and gaussian pyramid for reducing the image dimensions and information redundancy.
The next stage includes Fourier Transformations. Here FFT and DCT are applied to the image. The resulting image undergoes PSO and ABC. The Euclidean distance is calculated between trained and testing image. Finally, the experiments are done and the results are evaluated.
II. PRE-PROCESSINGSTAGE
In this paper, image pre-processing uses two techniques such as Gamma correction and Gaussian pyramid [3]. If images are having varying illumination conditions, gamma correction is used for neutralization of the impact of illumination. As it is necessary that the concerned image is to be displayed on a computer screen in an accurate manner, Gamma correction is done.
The images which are not pre-processed appears either bleached out or too dark. By varying the values of gamma there is changes not only in the brightness but also in the ratios offered to green to blue. Hence for reproducing the colors accurately some knowledge of gamma correction is necessary. Nowadays, Gamma correction has gained much importance as the usage of digital images over the internet has been increased.
The basic formula for Gamma correction is given as, G(m,n) = B * I(u,v)ɤ (1) where
G(m,n) – Gamma corrected image B – Constant
I(u,v) – input image ɤ - correction factor.
Technologists who are working in the field of image processing have given a special type of signal representation called as ‘Pyramid Representation’. In this technique, a signal or an image will be repeatedly made to go for smoothing and sub-sampling. Some images are huge in size and they can make pre-processing stages a cumbersome one. To avoid this problem, the images can be resized using a technique known as ‘Gaussian Pyramid’. This is used for texture synthesis in image processing. In this method, a series of images having weighted down Gaussian average is used and thus they are scaled down. If this process is repeated, this can create a pile of smaller images in succession. Each pixel contains an average locally calculated which, on a lower level of the pyramid, corresponds to a pixel neighborhood. Here this technique is used to reduce the image dimensions.
P. Malin Bruntha, S. Dhanasekar, K. Martin Sagayam, S. Immanuel Alex Pandian
Fig. 1 Gaussian pyramid
TABLE I. REDUCTION FACTOR
Face Databas
e
Original size Reductio n Factor
Reduced size
ORL [7] 92 * 112 1 46 * 56
OR L[7] 92 * 112 2 23 * 28
YALE B [8]
640 * 480 1 320 * 240
YALE B [8]
640 * 480 2 160 * 120
YALE B [8]
640 * 480 3 80 * 60
III. FOURIERTRANSFORMATION
The digital images are not having continuous function. They may be having a finite number of discrete samples. An image is formed from the pixels that make up the samples. One needs Discrete Fourier Transform (DFT) for the analysis of images using computers. DFT is a discrete version of Continuous Fourier Transform. Hence it provides a spectral representation that is based on frequency of the input image. Since highly correlated data have little energy at high frequencies, the DFT packs information into lower-order components.
An image can be represented by fewer number of features in order to describe it accurately and transformation-based feature extraction methods can play a vital role in this scenario. In order to reduce redundant image information, one can used transformation of frequency domain based facial images. The advantage of this step is that to preserve important and most desired features which are required for recognition, a subset of transformed coefficients is enough.
A. Fast Fourier Transform
Fast Fourier Transform (FFT) is also known as ‘Divide and Conquer’ technique. This FFT decreases the number of complex multiplications. FFT is separable and this makes the technique much simpler to carry out. As a result, one can reduce FFT operation in 2 dimensions to two 1 dimension. It was noted that most of the information was found in lower frequency components. As FFT was applied, at the corners of the image spectrum, lower frequency components
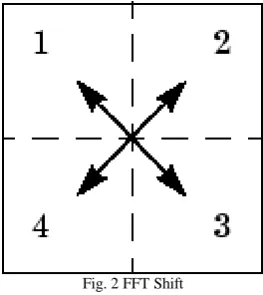
[image:2.595.52.286.280.419.2]got concentrated. In order to shift the components to the middle of the spectrum, FFT shift was used which made the process of visualization and extraction much easier. In order to obtain optimum feature set, desired FFT coefficients need to be extracted using spectrum-based feature extraction better recognition [10].
Fig. 2 FFT Shift
B. Discrete Cosine Transform
Discrete Fourier transform represents a discrete version of complete frequency based ortho normal system, while the transform of choice is usually the discrete cosine transform. It is close to statistically optimal for common place images possessing strong pixel-to-pixel correlation. Since optimal transforms are image dependent, the fact that DCT is often close to optimal and not image dependent makes it an excellent candidate for many applications. The basis functions for DCT are digital samplings of the cosine basis functions.
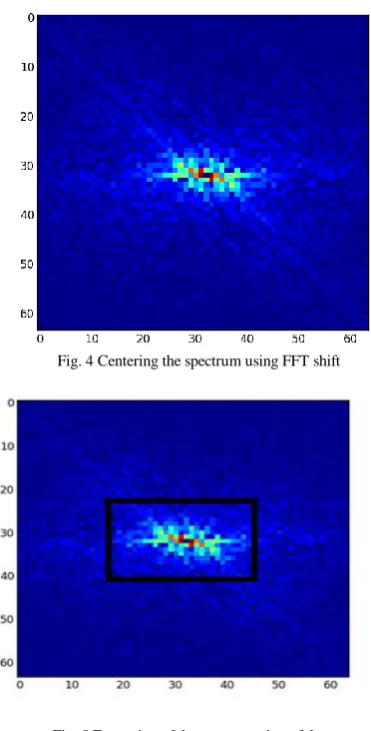
At the center of the spectrum, all the frequency components are present. One needs to extract the center portion by a centered rectangular mask [3]. To maintain the image quality, DCT is used which gives higher compression rate. By these cosine basis functions, high energy compaction is achieved.
There is no need to manipulate complex numbers in DCT. This gives an edge to DCT over DFT. Decomposition of images into a set of DCT basis functions is similar to Fourier series. By the summation of these basis functions, proper image can be created.
[image:2.595.317.554.581.714.2]International Journal of Innovative Technology and Exploring Engineering (IJITEE) ISSN: 2278-3075, Volume-8 Issue-7, May, 2019
Fig. 4 Centering the spectrum using FFT shift
Fig. 5 Extraction of the center portion of the spectrum using rectangular mask
IV. SWARMINTELLIGENCEBASED
OPTIMIZATION
Multidimensional optimization is most significant in engineering, statistics, and other fields. Swarm based optimization is most predominant technique used to hybrid methods for getting better performance measures. Two popular algorithms are investigated in this work: particle swarm optimization (PSO) and artificial bee colony (ABC) algorithm.
A. PSO Algorithm
Particle Swarm Optimization is an artificial intelligence technique that optimizes a problem to find the best candidate solution to improve the quality. Since PSO constitutes of a swarm that moves around in search of space and thereby looking for the best possible solution, it does not use the gradient of the problem which needs to be optimized. Here, a number of particles are used as if they are in a swarm. Here, the swarm represents a set of particles. The position and velocity of each particle is known which constitutes the potential solution. Each particle maintains an individual best position known as pbest, whereas a swarm maintains its global best known as the gbest. An individual particle tends to change its position based on the following factors: current position, current velocities, the distance between current position and gbest and the distance between current position
and pbest. PSO algorithm operates with a swarm (i.e. population) of particle solutions. PSO is a process that will be repeated many times. Based on some specified formulae, these particles will be moving around in search space. Each particle which knows its local best position is moved towards global best position. The velocity of each particle is given by the change in the position between the current and the previous one. For each particle in the swarm, fitness function is assessed. This is equated with the fitness of previous best result for that particle. It is also equated with the fitness of the best particle among all swarm particles. After observing the two best values from the space search, particles advances by updating their velocities and positions [5]. Let us denote the swarm particles number by S, their positions by Xi and their velocities by Vi. Let G be the best known position of the whole population and let Pi be the best known position of particle i. The fundamental PSO algorithm is as follows : Let the individual particles be i, where i = 1, 2, 3,…, S.
1. Each particle position is initialized in the search space using their upper and lower boundaries (Bup & Blow).
2. Now the particles best known position is found and is set as its initial position. Xi Pi.
3. If (f(G) > f(Pi)) the particles’ best-known position is revised.
4. Similarly, the particles velocity is also initialized using (Bup & Blow).
5. When the number of iterations gets over, it is repeated until the pbest and gbest solutions are found.
6. The particles position and velocity is updated using the formula given below :
Xi ← Xi + Vi (2) Vij (t + 1) = Vij (t) + C1 r1j (t) [ yij (t) – Xij (t) ] + C2 r2j(t)[ yij (t)
– Xij (t) ] (3)
where, Vij (0) = 0; initially
C1, C2 – positive acceleration co - efficient If (f(Xi) < f(Pi)) ,then
The particle’s best known position is updated: Pi Xi If (f(Pi) < f(G)), then update the swarm's best known position:
GPi
Finally, the best found solution is held in variable G.
TABLE II . PARAMETER SETTING FOR PSO
PARAMETER SETTING
B. ABC Algorithm
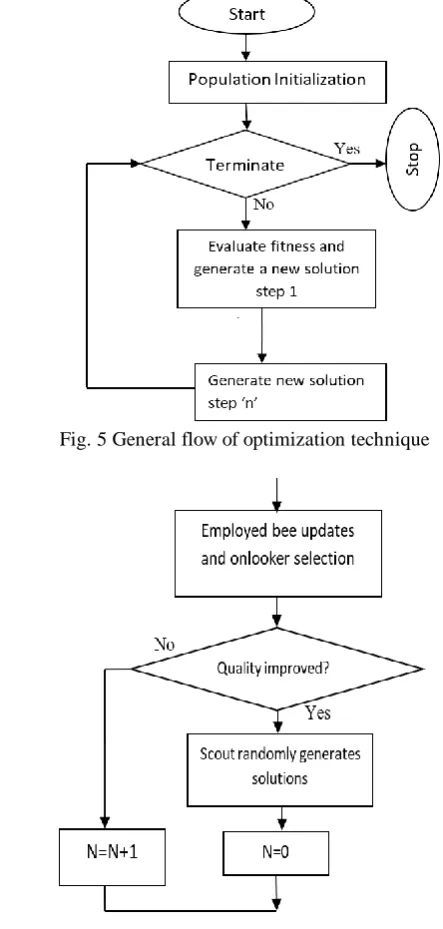
[image:4.595.48.269.287.520.2]Several approaches have been used with the behavior of honey bee. It has three major things: - The first one is food sources, the second one is employed bee and the final one is unemployed bee. A food source represents the solutions in the global search space. Employed bee represents the specific solution which are currently working or taking new bee in the colony. Unemployed bees continually look for food source. These are classified into two types: Scouts and Onlookers. Scouts are searching the path in which near and surrounding to the food source. Onlookers which are in the nest, create a food source by the exchange of information by employing employed bees [7]. It consists of two modes of behavioral approach: enlist into rich content of nectar source or superabundant of a poor nectar source. This process is initiated by scout bee to identify the position of food source. The work flow is modified based on general optimization technique is shown in Fig. 5 and Fig. 6.
Fig. 5 General flow of optimization technique
Fig. 6 Generation of new solution in ABC algorithm
V. EUCLIDEANCLASSIFIER
In the recognition phase, similarity check has been made between every image in the feature set and the image to be tested. It also undergoes a similar process as that of trained images in face data base. The following equation gives the Euclidean distance between trained and testing image,
(4)
Where,
fj = feature set of the input images tj = selected feature of the test image
[image:4.595.322.550.289.395.2]The distance ‘D’ between the two images determine how far the images in the face gallery coincide with the testing image. The larger the Euclidean distance, the larger the error in the system. The Euclidean distance should be small as much as possible such that the test images are recognized correctly.
TABLE III. EUCLIDEAN DISTANCE MEASUREMENT
VI. EXPERIMENTALRESULTANDANALYSIS
Experiment using different databases gives the performance improvement of the proposed FR system over other systems. Here the experiment is done using ORL[8] and YALE B [9] database. The experiments are as follows:
A. Experiment 1: ORL database
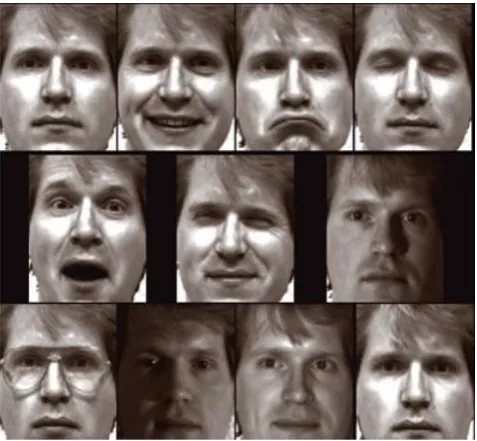
Faces with a variety of facial expressions in various lighting but having uniform background is available with ORL database. There are 10 images of 20 different individuals considered for experiment 1. These images undergo FFT + DCT + PSO/ ABC during both the training and recognition stages. Their average recognition rate is shown in different range based on the optimization approach used in this work. Gray scale images are considered with a size of 92 x 112 pixels.
B. Experiment -1a:
In this paper, a combination of three techniques mentioned above has been used. When DCT and PSO/ ABC are used, the performance of the system is shown statistically. Among 10 images, 3 are given for training and 7 for testing. It is observed after four trails that DCT + ABC combination has a better average recognition rate than a combination of DCT+PSO. By applying FFT prior to DCT, there is an increase in recognition rate for feature extraction.
Under Matched Condition
Under Not Matched Condition
0.00000697 0.1148
Euclidean
0.00000654 0.1625
Distance ‘D’
[image:4.595.46.268.290.755.2]International Journal of Innovative Technology and Exploring Engineering (IJITEE) ISSN: 2278-3075, Volume-8 Issue-7, May, 2019
C. Experiment -1b:
There is a change in number of testing and training images in this work. The corresponding recognition rates have been found out. The change in the ratio of testing and training images does not seem to affect the functionality of the system. This method when compared to PCA and SVD-based FLDA shows better performance than the other two. The latter been designed in a particular way so that it can recognize one training image for one person. With increase in the number of training images, the result showed an increase in recognition rate.
Fig 7. Sample ORL database
D. Experiment 2: Yale B database:
This database is used when there is illumination due to light variation as from left 180o to right 180o. It contains 9200 images of 25 human subjects under 8 poses and 46 illumination conditions. Images are captured with illumination for every subject in a specific pose. The database contains images in gray scale with the size of each image in the range of 640x480 pixels. The main challenge for recognition is the presence of rugged background due to the illumination in pose variations.
In Yale B database to minimize the impact of illumination in the recognition process, an enhancement technique known as gamma correction is used in pre-processing phase. Gaussian pyramid with a reduction factors of 1 and 2 is applied for resizing the images. The image resolution is thus reduced from 640x480 to 320x240 and 160x120. The reduced image is then subjected to fast fourier transform and due to the fftshift the lower frequency components get shifted towards the center from the corners.
From the observation it is clear that there is a dynamic range in the spectrum values for Yale B whereas for ORL database it is very low. As this range is so huge to be displayed, it is reduced using logarithmic transformation. There is a necessity for this transformation to be applied to enhance the pixel values of lower intensity components and to reduce the dynamic range by the replacement of pixels
with its logarithmic value. This is possible only for images that are comparatively dark and is not sufficient for unvarying background images. Therefore, logarithmic transformation is exceedingly operative in Yale B rather than colour FERET and ORL databases. Then DCT is employed followed by PSO/ ABC for the reduction in the number of features observed.
E. Experiment -2a:
The main emphasis of this experiment is to concentrate on brightness balance and the images have variations only in the front pose with a total of 46 images per person. Based on the angle between the camera axis and direction of the light source, the database is divided into small subsets. These images are used for all the experiments without any size reduction due to image cropping. For training phase, five images per person with undetermined lighting background are chosen randomly. These subsets further create testing sets. The final outcome is determined by averaging the results of recognition over 8 trials. Based on the outcome, it is determined that the present method clearly shows better performance even when constrained by various lighting backgrounds.
F. Experiment -2b:
[image:5.595.308.547.475.695.2]Most of the testing images undermined lighting and pose variations which are taken with a variety of backgrounds. Hence, in order to test the capability of this methodology in testing conditions, 24 images/person among which 3 for each pose have been chosen systematically from a set of 456 images which include 46 variety of lighting conditions and 8 different poses. In total, 600 (24 x 25) images have been trained. The images which are remaining under each pose constituting 1075 ((46-3) x 25) are tested individually with the training set and the outcome obtained is observed.
Fig 9. Repetition versus Solution using ABC and PSO optimization
[image:6.595.82.256.304.425.2]ABC optimization provides better solution than PSO techniques when iteration increases. It significantly shows that optimized feature selection has been done for classification process. The error rate calculation has done for reference and target face image from the classified output is shown in Fig. 10.
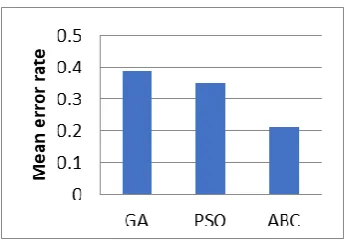
Fig. 10. Optimization techniques versus mean error rate
In order to test target face image, Euclidean classifier is used. Each image in the face gallery is thoroughly checked for similarity index with testing phase image in recognition phase for every feature subset. The same process which was carried out for trained images, is carried out for this test image in the face gallery. The mean error rate is significantly less in ABC than other optimization techniques. So that recognition rate is very high in hybrid ABC method than other technique as shown in Table IV.
TABLE IV: COMPARISON OF RECOGNITION RATE WITH OTHER TECHNIQUES
Experiment Database Techniques Recognition rate
1 ORL
dataset [8]
FFT+DCT+AB C
90%
FFT+DCT+PSO 88%
1a DCT + ABC 89%
DCT + PSO 83%
1b PCA+SVD+ABC 85%
PCA+SVD+PSO 81%
2 Yale
dataset [9]
FFT+DCT+AB C
92%
FFT+DCT+PSO 84%
In both datasets, hybridization of FFT and DCT with ABC and PSO optimization is compared with other existing techniques. The recognition rate for ORL datasets and Yale datasets is 90% and 92% respectively. It shows better recognition rate than other existing techniques.
VII. CONCLUSION
An approach for a better face recognition system is proposed in this paper which uses a unique combination of FFT, DCT and PSO/ ABC. For feature extraction, FFT and DCT combination is used. For feature selection process, a combination of PSO + ABC is used. In feature extraction, FFT has played an important role which has helped in enhancing the recognition rate. In this work, FFT + DCT has helped in improving the system output and PSO + ABC has facilitated in accomplishing a noteworthy decrease in the number of chosen features. But ABC based DCT helps FFT to further more significant reduction in feature selection than PSO. The proposed method shows high performance under frontal poses with changes in details and expressions of the face. This method also proves to be a better one under illumination changes. Thus, this combination is a hopeful technique even when there is variation in poses, illumination and background. The Euclidean classifier used here is one of the simplest classifiers. In future, to improve the recognition rate, random forest classifier can be used to get significant performance measures.
REFERENCES
1. W. Zhao, R. Chellapa, P.J.Phillips, A. “Rosenfeld, Face recognition: a literature survey”, ACM Computing Surveys, vol. 35 , 2003, pp.399-458. 2. R.M. Ramadan, R.F. Abdel-Kader, “Face recognition using particle swarm optimization-based selected features”, International Journal of Signal processing, Image processing and Pattern recognition, vol. 2, 2009, pp. 51-67.
3. G.M Deepa, R. Keerthi ,N. Meghana, K. Manikantan, “Face recognition using spectrum-based feature extraction”, Applied Soft Computing, vol. 12, 2012, pp. 2913-2923.
4. Nitish Sinha, Priyanka.G, “Implementation of binary PSO based face recognition system using image Pre – processing”, International Conference on Signal, Image Processing and Applications with workshop of ICEEA 2011 IPCSIT, vol.21, 2011, pp. 41-45.
5. J. Kennedy, R. Eberhart, “Particle Swarm Optimization”, Proceedings of IEEE International conference on Neural Networks, IEEE service center, Piscataway, NJ, 1995.
6. Dervis Karaboga,Bahriye Basturk, “A powerful and efficient algorithm for numerical function optimization: artificial bee colony (ABC) algorithm”, Journal of Global Optimization, vol. 39, 2007, pp. 459-471.
7. R. Gopalan, D. Jacobs, “Comparing and combining lighting insensitive approaches for face recognition”, Computer vision and Image understanding, vol. 114, 2010, pp. 135-145.
8. ORL database: http://www.cl.cam.ac.uk/research/dtg/attarchive/facedatabase.html. 9. Yale Database: http://vision.ucsd.edu/content/yale-face-database. 10. Shanmukhappa A. Angadi, Vishwanath C. Kagawade, “A robust face
recognition approach through symbolic modeling of Polar FFT features”, Pattern Recognition, vol. 71, 2017, pp.235–248.
11. Jie Chen, Vishal M. Patel, Li Liu, Vili Kellokumpu, Guoying Zhao, Matti Pietikäine , Rama Chellappa,” Robust local features for remote face recognition” Image and Vision Computing, vol.64, 2017, pp.34–46. 12. Suparna Biswas, Jaya Sil, “An efficient face recognition method using
[image:6.595.42.319.594.760.2]International Journal of Innovative Technology and Exploring Engineering (IJITEE) ISSN: 2278-3075, Volume-8 Issue-7, May, 2019
13.Vishwanath, Kagawade, Shanmukhappa A. Angadi, “Multi-directional local gradient descriptor: A new feature descriptor for face recognition”, Image and Vision Computing, vol. 83-84, 2019, pp. 39–50.
14.S. Elaiwat, M. Bennamoun, F. Boussaid, A. El-Sallam, “A Curvelet-based approach for textured 3D face recognition”, Pattern Recognition, vol. 48, 2015, pp. 1235–1246.
15.Yali Penga, Liping Li, Shigang Liu, Tao Lei, “Space–frequency domain based joint dictionary learning and collaborative representation for face recognition”, Signal Processing, vol. 147, 2018, pp. 101–109.
16.Sajid Ali Khan, Muhammad Ishtiaq, Muhammad Nazir, Muhammad Shaheena, “Face recognition under varying expressions and illumination using particle swarm optimization”, Journal of Computational Science, vol. 28, 2018, pp. 94–100.